| Param | Original file | Final file |
|---|---|---|
| Filename | modeM0/AS1A13_038T03_9000006058_45241cztM0_level2.fits | modeM0/AS1A13_038T03_9000006058_45241cztM0_level2_quad_clean.evt |
| Size (bytes) | 513,230,400 | 116,435,520 |
| Size | 489.5 MB | 111.0 MB |
| Events in quadrant A | 5,537,451 | 776,750 |
| Events in quadrant B | 3,326,269 | 826,614 |
| Events in quadrant C | 3,344,889 | 794,771 |
| Events in quadrant D | 6,272,535 | 662,624 |
| Mode M0 | |||
|---|---|---|---|
| Quadrant | BADHDUFLAG | Total packets | Discarded packets |
| A | 0 | 21611 | 2 |
| B | 0 | 14256 | 2 |
| C | 0 | 14434 | 2 |
| D | 0 | 23270 | 2 |
| Mode M9 | |||
|---|---|---|---|
| Quadrant | BADHDUFLAG | Total packets | Discarded packets |
| A | 0 | 15 | 0 |
| B | 0 | 15 | 0 |
| C | 0 | 16 | 0 |
| D | 0 | 16 | 0 |
| Mode SS | |||
|---|---|---|---|
| Quadrant | BADHDUFLAG | Total packets | Discarded packets |
| A | 0 | 136 | 0 |
| B | 0 | 136 | 0 |
| C | 0 | 136 | 0 |
| D | 0 | 136 | 0 |
| Quadrant | Total seconds | Saturated seconds | Saturation percentage |
|---|---|---|---|
| A | 6668 | 157 | 2.354529% |
| B | 6668 | 73 | 1.094781% |
| C | 6667 | 51 | 0.764962% |
| D | 6667 | 650 | 9.749513% |
Noise dominated data is calculated using 1-second bins in cleaned event files. If a bin has >2000 counts, and if more than 50% of those come from <1% of pixels, then it is considered to be noise-dominated and hence unusable.
| Quadrant | # 1 sec bins | Bins with >0 counts | Bins with >2000 counts | High rate bins dominated by noise | Noise dominated (total time) | Noise dominated (detector-on time) | Marked lightcurve |
|---|---|---|---|---|---|---|---|
| A | 7898 | 6668 | 34 | 34 | 0.43% | 0.51% |  |
| B | 7898 | 6668 | 17 | 17 | 0.22% | 0.25% | 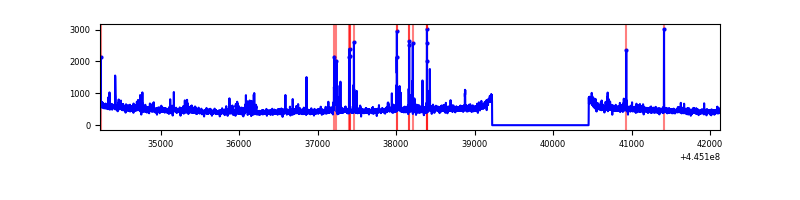 |
| C | 7897 | 6668 | 52 | 52 | 0.66% | 0.78% | 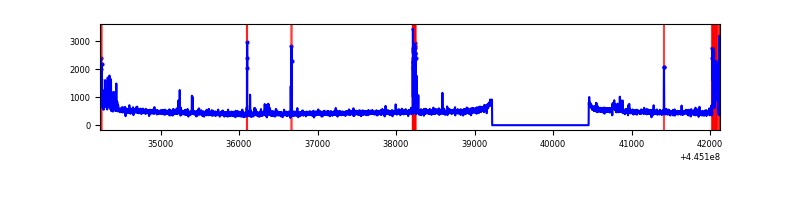 |
| D | 7897 | 6668 | 588 | 588 | 7.45% | 8.82% | 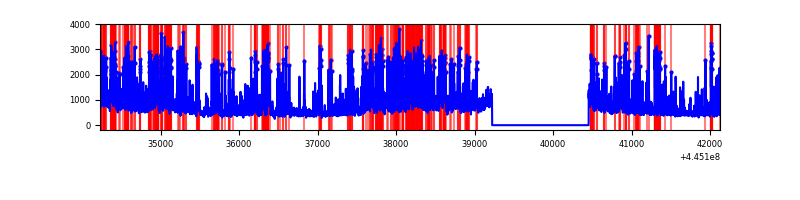 |
Top three noisy pixels from each quadrant. If the there are fewer than three noisy pixels in the level2.evt file, extra rows are filled as -1
| Pixel properties | Quadrant properties | ||||||
|---|---|---|---|---|---|---|---|
| Quadrant | DetID | PixID | Counts | Sigma | Mean | Median | Sigma |
| A | 10 | 83 | 2493984 | 15546.75 | 776 | 760 | 160.4 |
| A | 13 | 248 | 35585 | 217.15 | 776 | 760 | 160.4 |
| A | 3 | 137 | 8454 | 47.98 | 776 | 760 | 160.4 |
| B | 5 | 32 | 81121 | 525.45 | 787 | 763 | 152.9 |
| B | 5 | 172 | 55582 | 358.45 | 787 | 763 | 152.9 |
| B | 5 | 255 | 34279 | 219.16 | 787 | 763 | 152.9 |
| C | 14 | 254 | 114986 | 621.59 | 782 | 788 | 183.7 |
| C | 2 | 14 | 99525 | 537.43 | 782 | 788 | 183.7 |
| C | 1 | 3 | 73202 | 394.15 | 782 | 788 | 183.7 |
| D | 13 | 249 | 1639900 | 8865.97 | 736 | 716 | 184.9 |
| D | 11 | 241 | 522386 | 2821.59 | 736 | 716 | 184.9 |
| D | 12 | 17 | 269957 | 1456.26 | 736 | 716 | 184.9 |
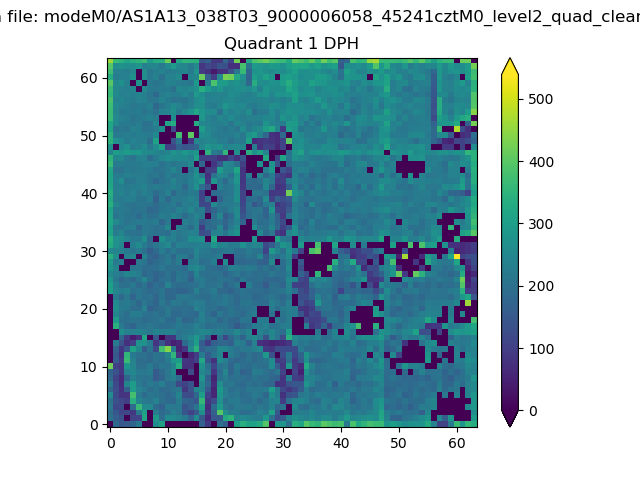
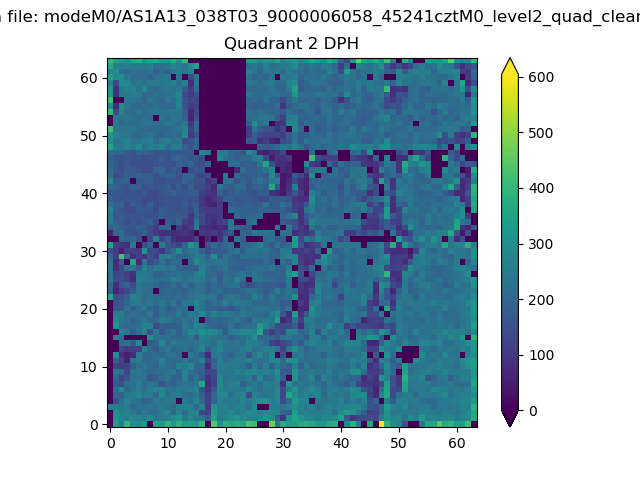
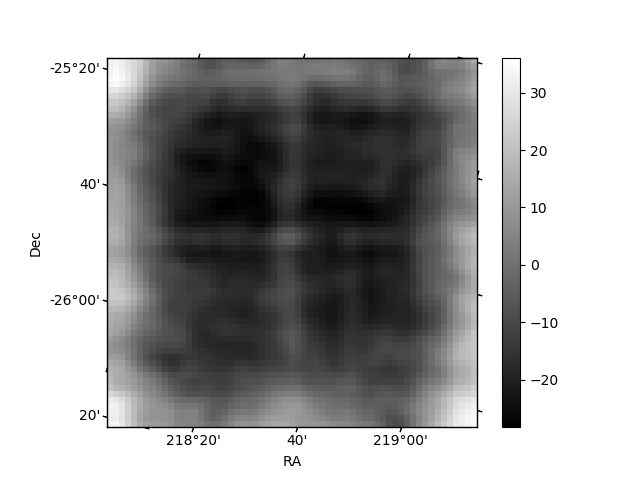
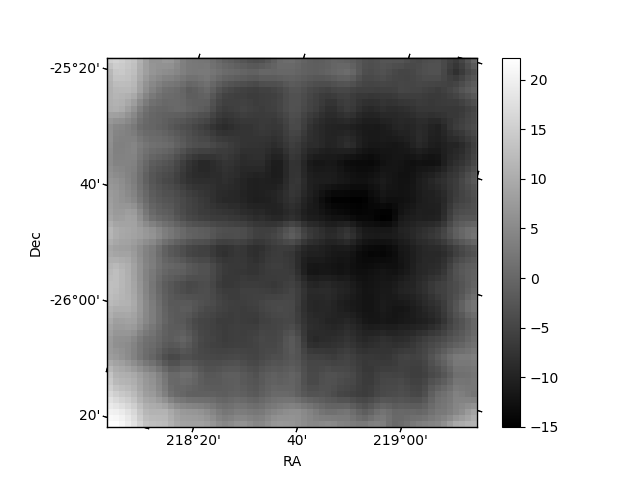
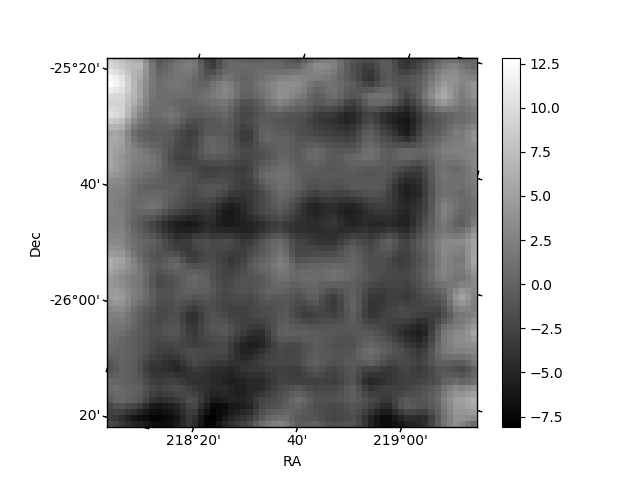
Histogram calculated using DETX and DETY for each event in the final _common_clean file
| Quadrant A | 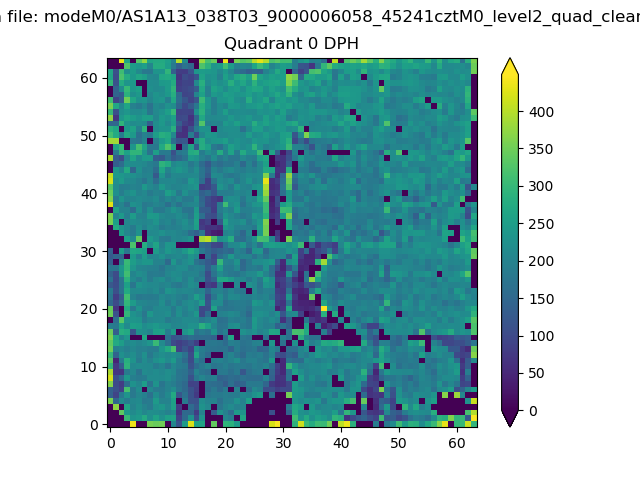 |
 |
Quadrant B |
|---|---|---|---|
| Quadrant D | 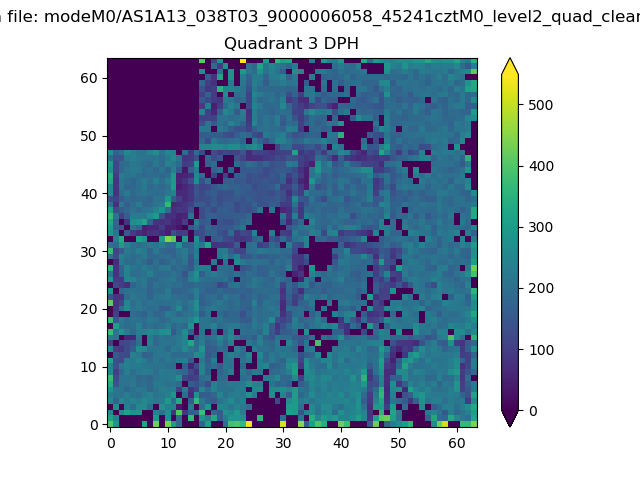 |
 |
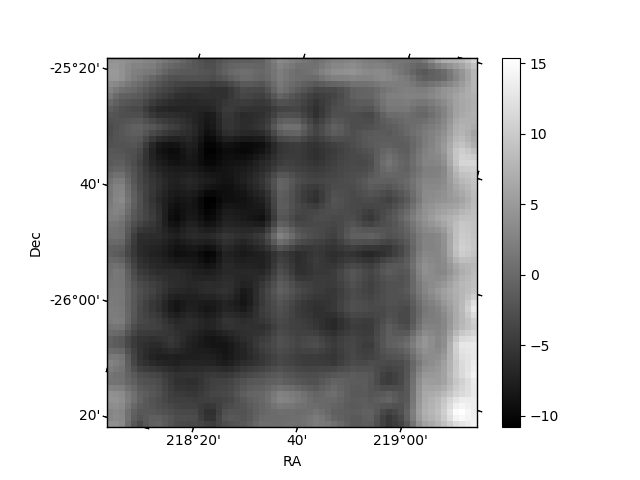
Quadrant C |
| Plot type | Count rate plots | Images |
|---|---|---|
| Comparison with Poisson distribution Blue bars denote a histogram of data divided into 1 sec bins. Red curve is a Poisson curve with rate = median count rate of data. |
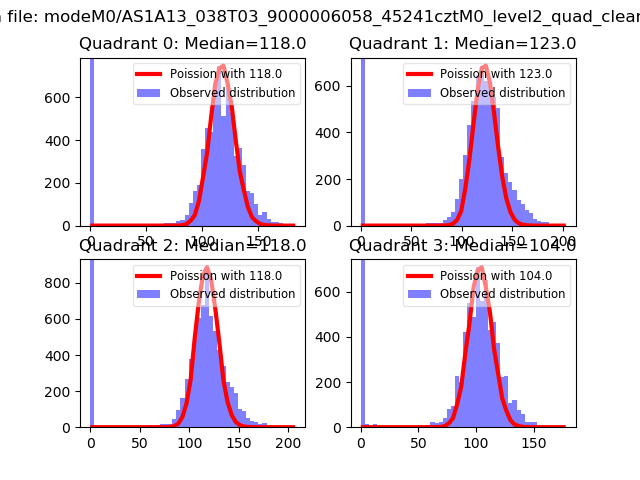 |
 |
| Quadrant-wise count rates Data is divided into 100 sec bins |
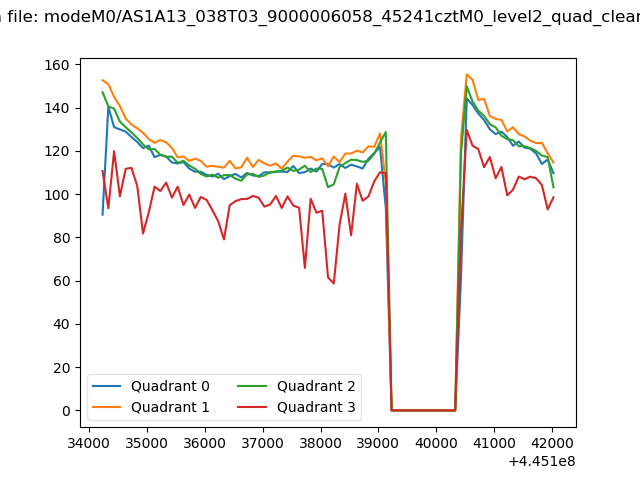 |
|
| Module-wise count rates for Quadrant A Data is divided into 100 sec bins |
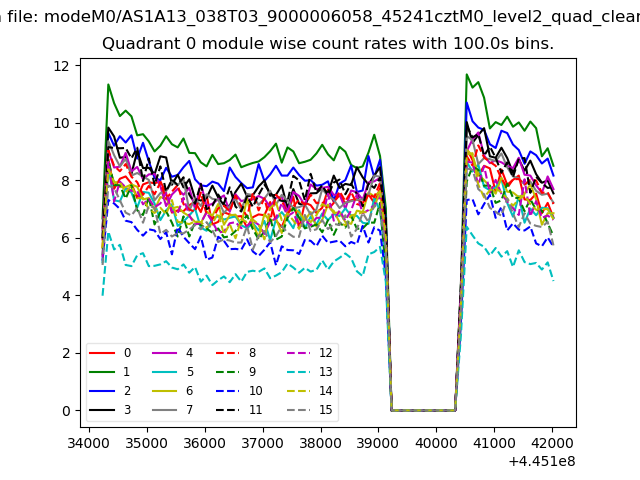 |
 |
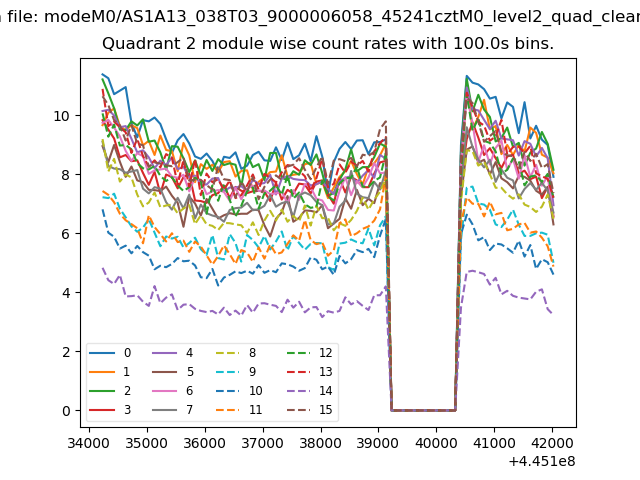
| Module-wise count rates for Quadrant B Data is divided into 100 sec bins |
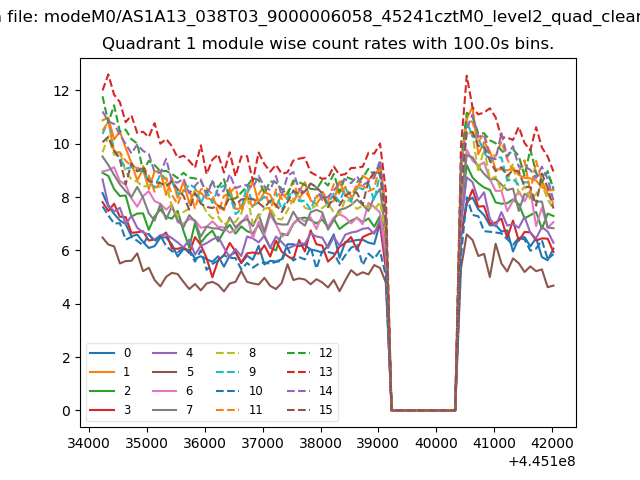 |
 |
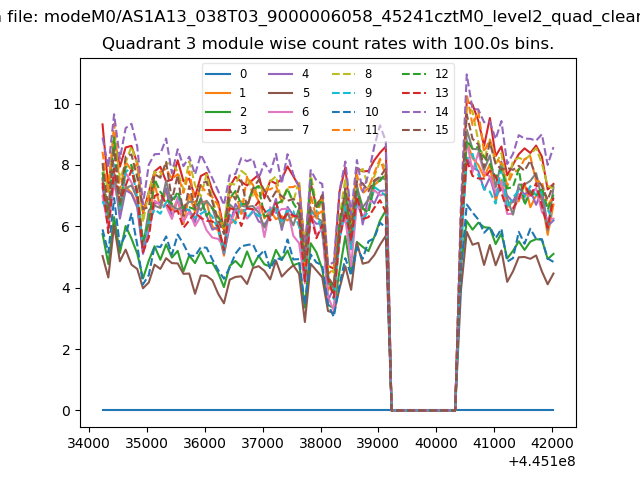
| Module-wise count rates for Quadrant C Data is divided into 100 sec bins |
 |
 |
| Module-wise count rates for Quadrant D Data is divided into 100 sec bins |
 |
 |
| Parameter | Plot |
|---|---|
| CZT HV Monitor | 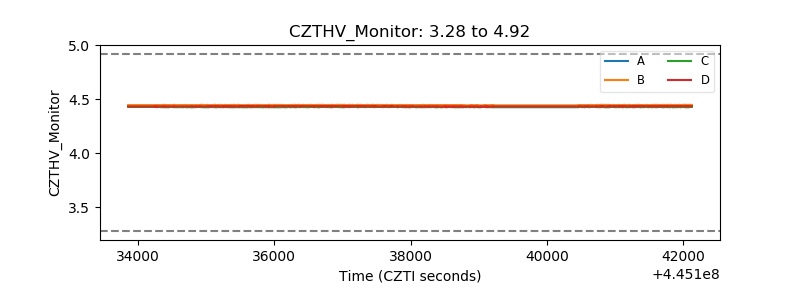 |
| D_VDD | 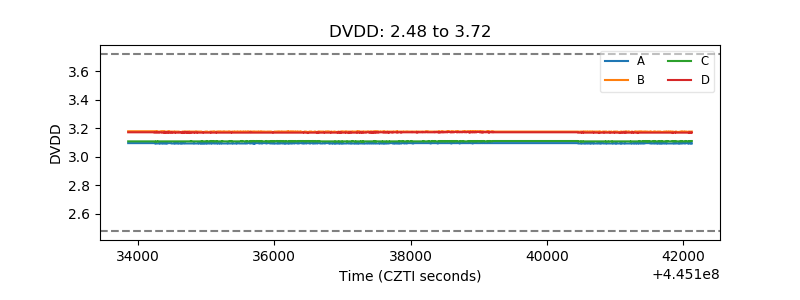 |
| Temperature 1 | 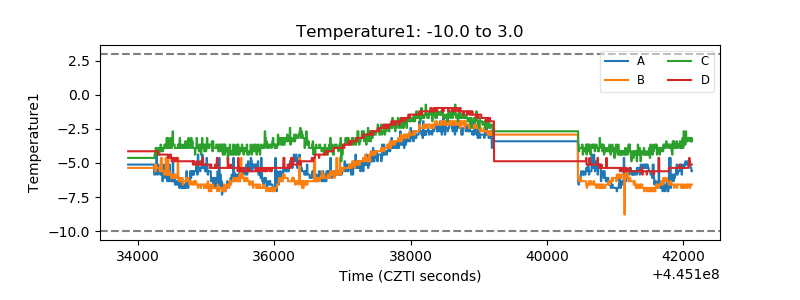 |
| Veto HV Monitor |  |
| Veto LLD | 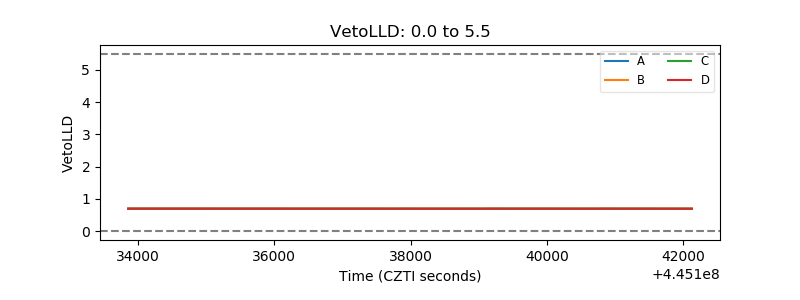 |
| Alpha Counter | 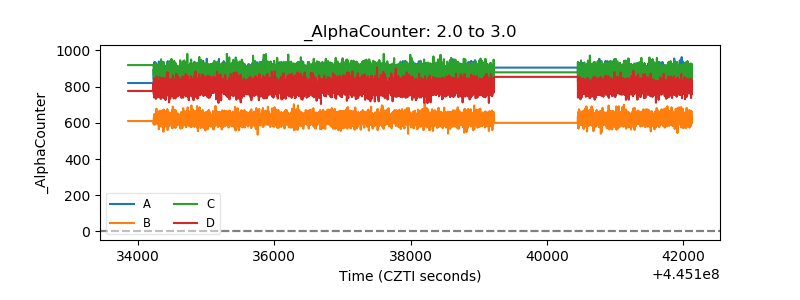 |
| _CPM_Rate | 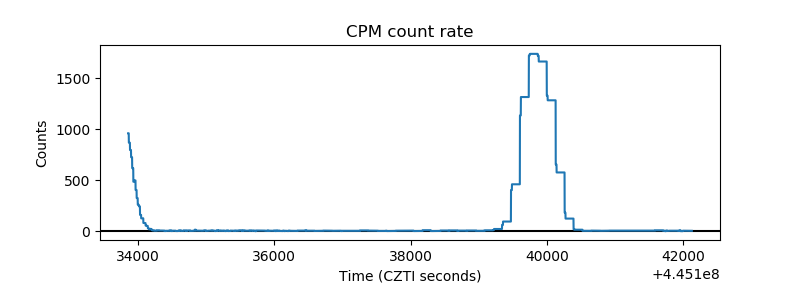 |
| CZT Counter | 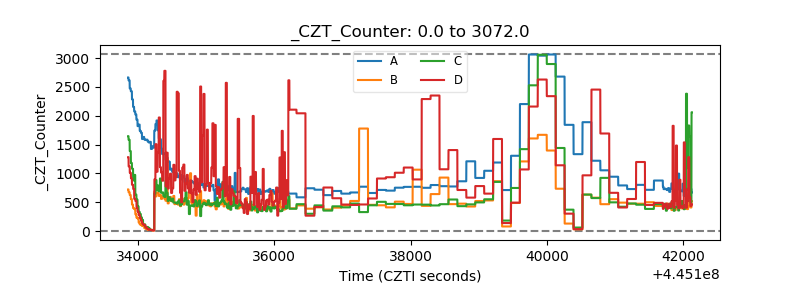 |
| +2.5 Volts monitor | 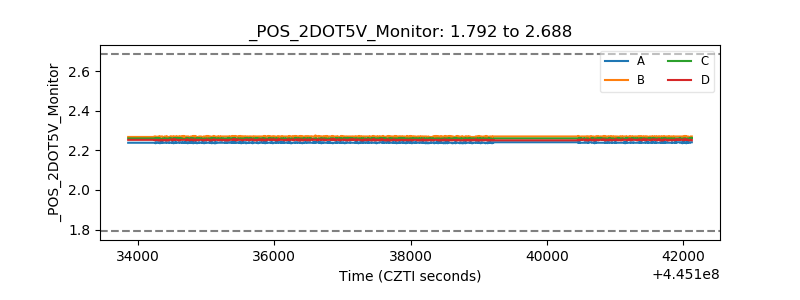 |
| +5 Volts monitor | 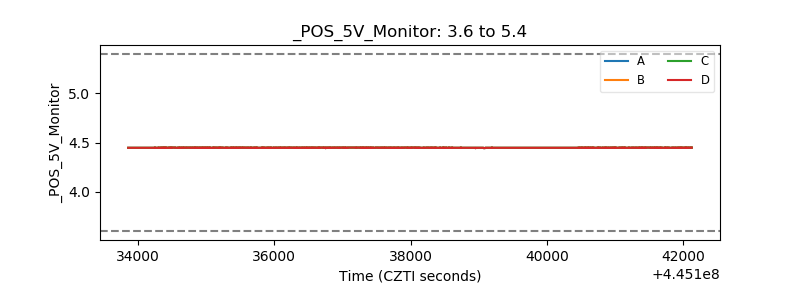 |
| _ROLL_ROT | 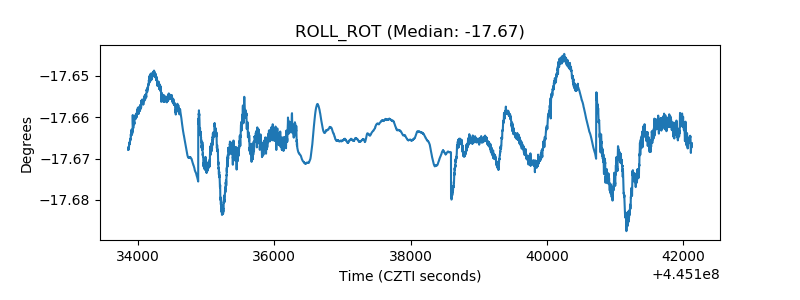 |
| _Roll_DEC | 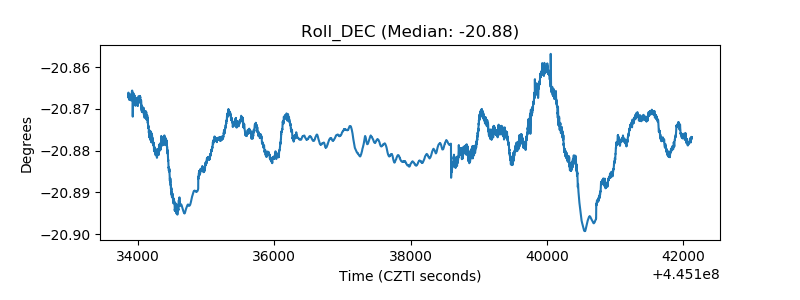 |
| _Roll_RA | 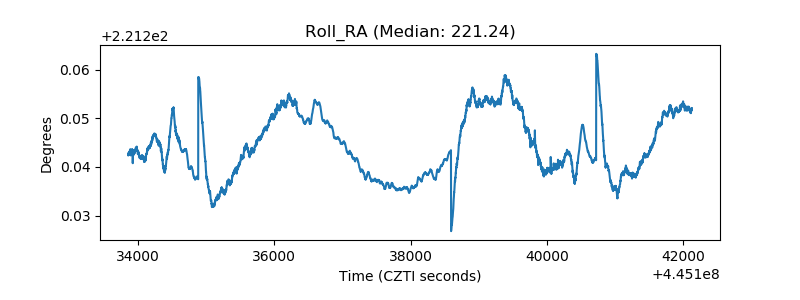 |
| Veto Counter | 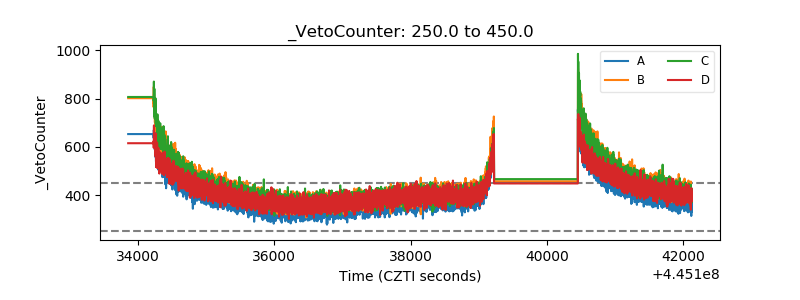 |