| Param | Original file | Final file |
|---|---|---|
| Filename | modeM0/AS1A13_038T03_9000006058_45242cztM0_level2.fits | modeM0/AS1A13_038T03_9000006058_45242cztM0_level2_quad_clean.evt |
| Size (bytes) | 481,484,160 | 111,960,000 |
| Size | 459.2 MB | 106.8 MB |
| Events in quadrant A | 5,223,725 | 750,302 |
| Events in quadrant B | 3,149,192 | 794,410 |
| Events in quadrant C | 3,433,263 | 759,055 |
| Events in quadrant D | 5,521,769 | 641,402 |
| Mode M0 | |||
|---|---|---|---|
| Quadrant | BADHDUFLAG | Total packets | Discarded packets |
| A | 0 | 20370 | 1 |
| B | 0 | 13539 | 1 |
| C | 0 | 14382 | 1 |
| D | 0 | 20765 | 1 |
| Mode M9 | |||
|---|---|---|---|
| Quadrant | BADHDUFLAG | Total packets | Discarded packets |
| A | 0 | 12 | 0 |
| B | 0 | 12 | 0 |
| C | 0 | 12 | 0 |
| D | 0 | 12 | 0 |
| Mode SS | |||
|---|---|---|---|
| Quadrant | BADHDUFLAG | Total packets | Discarded packets |
| A | 0 | 130 | 0 |
| B | 0 | 130 | 0 |
| C | 0 | 130 | 0 |
| D | 0 | 130 | 0 |
| Quadrant | Total seconds | Saturated seconds | Saturation percentage |
|---|---|---|---|
| A | 6380 | 128 | 2.006270% |
| B | 6379 | 68 | 1.065998% |
| C | 6380 | 102 | 1.598746% |
| D | 6380 | 613 | 9.608150% |
Noise dominated data is calculated using 1-second bins in cleaned event files. If a bin has >2000 counts, and if more than 50% of those come from <1% of pixels, then it is considered to be noise-dominated and hence unusable.
| Quadrant | # 1 sec bins | Bins with >0 counts | Bins with >2000 counts | High rate bins dominated by noise | Noise dominated (total time) | Noise dominated (detector-on time) | Marked lightcurve |
|---|---|---|---|---|---|---|---|
| A | 7610 | 6381 | 20 | 20 | 0.26% | 0.31% |  |
| B | 7609 | 6380 | 18 | 18 | 0.24% | 0.28% | 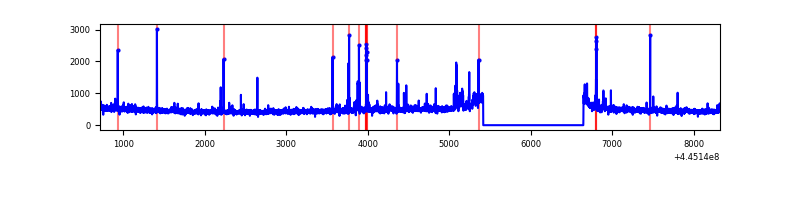 |
| C | 7610 | 6381 | 109 | 109 | 1.43% | 1.71% | 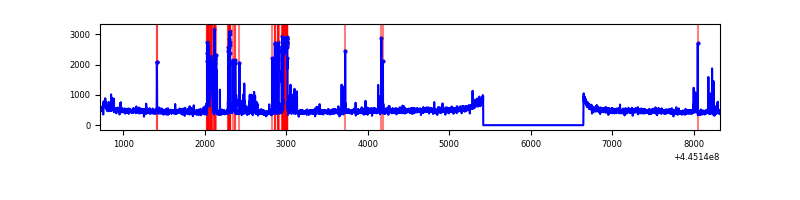 |
| D | 7610 | 6381 | 545 | 545 | 7.16% | 8.54% | 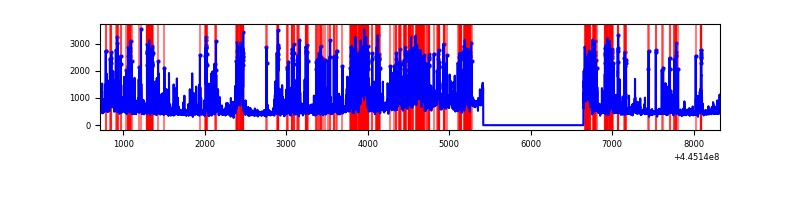 |
Top three noisy pixels from each quadrant. If the there are fewer than three noisy pixels in the level2.evt file, extra rows are filled as -1
| Pixel properties | Quadrant properties | ||||||
|---|---|---|---|---|---|---|---|
| Quadrant | DetID | PixID | Counts | Sigma | Mean | Median | Sigma |
| A | 10 | 83 | 2256526 | 14578.51 | 747 | 731 | 154.7 |
| A | 13 | 248 | 72235 | 462.11 | 747 | 731 | 154.7 |
| A | 7 | 16 | 8968 | 53.23 | 747 | 731 | 154.7 |
| B | 0 | 168 | 51249 | 342.45 | 755 | 731 | 147.5 |
| B | 5 | 32 | 40375 | 268.74 | 755 | 731 | 147.5 |
| B | 5 | 255 | 28145 | 185.83 | 755 | 731 | 147.5 |
| C | 14 | 254 | 351387 | 2003.71 | 747 | 753 | 175.0 |
| C | 2 | 14 | 100925 | 572.44 | 747 | 753 | 175.0 |
| C | 1 | 3 | 52509 | 295.76 | 747 | 753 | 175.0 |
| D | 13 | 249 | 1828872 | 10137.64 | 713 | 692 | 180.3 |
| D | 11 | 241 | 303489 | 1679.07 | 713 | 692 | 180.3 |
| D | 5 | 222 | 170479 | 941.5 | 713 | 692 | 180.3 |
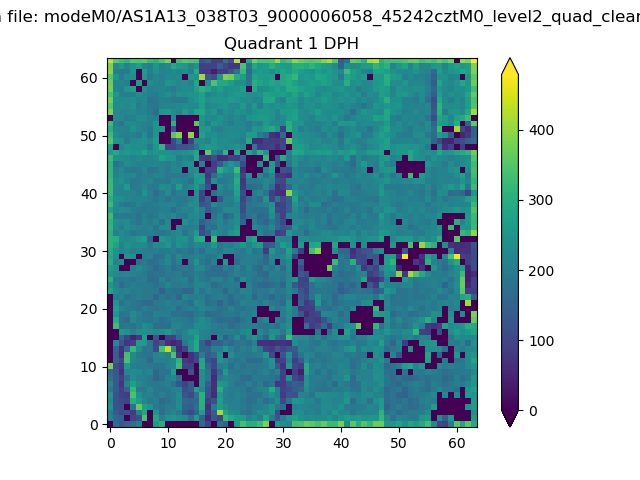
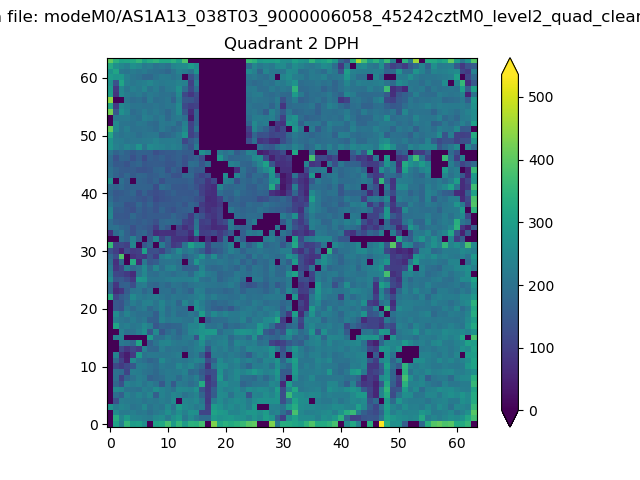
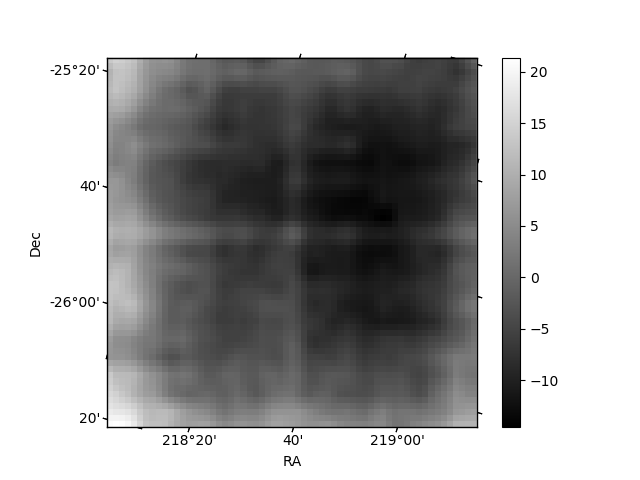
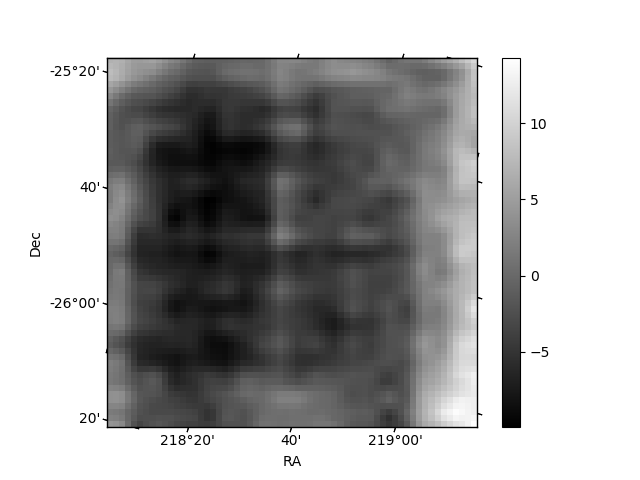
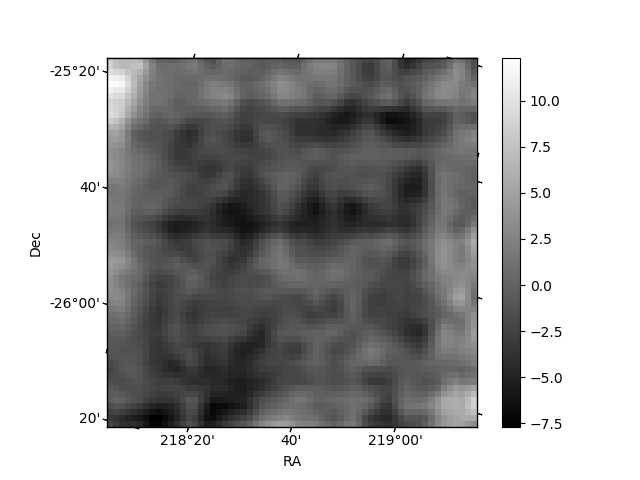
Histogram calculated using DETX and DETY for each event in the final _common_clean file
| Quadrant A | 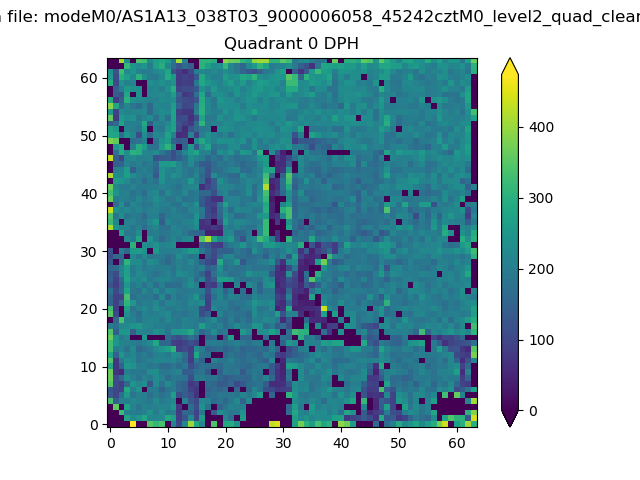 |
 |
Quadrant B |
|---|---|---|---|
| Quadrant D | 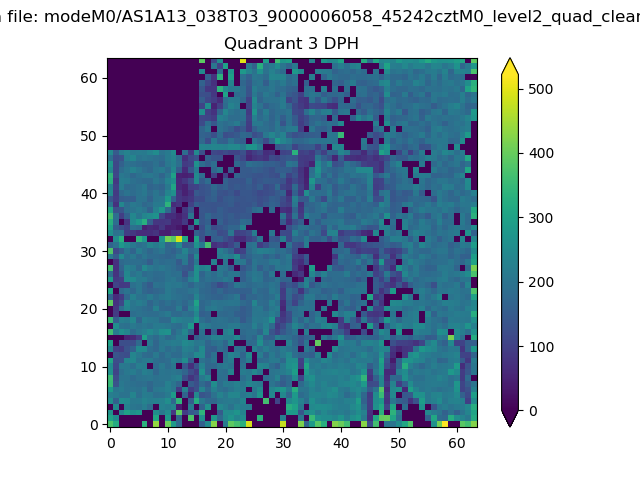 |
 |
Quadrant C |
| Plot type | Count rate plots | Images |
|---|---|---|
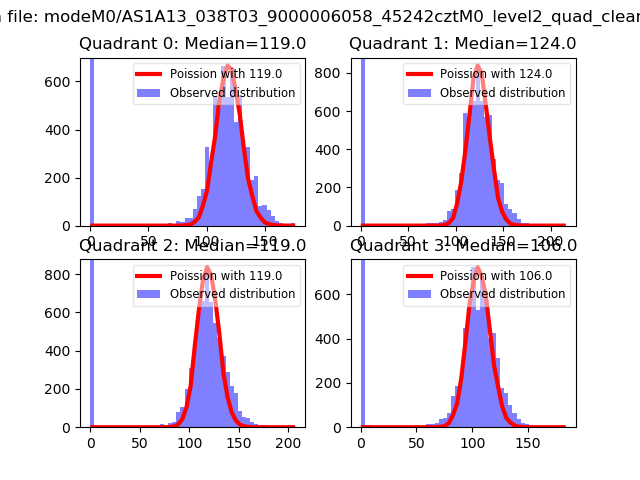
| Comparison with Poisson distribution Blue bars denote a histogram of data divided into 1 sec bins. Red curve is a Poisson curve with rate = median count rate of data. |
 |
 |
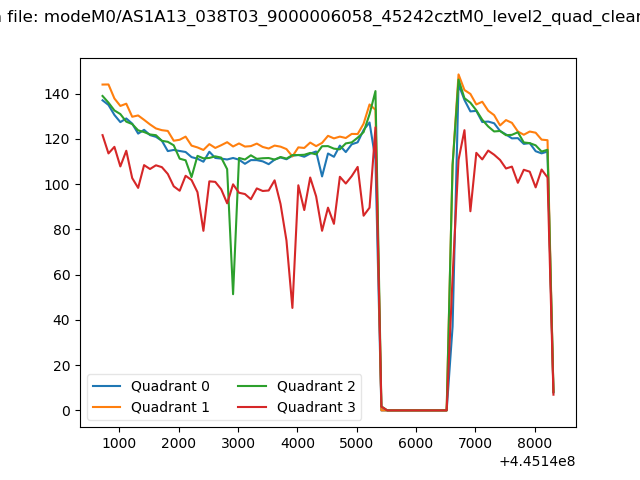
| Quadrant-wise count rates Data is divided into 100 sec bins |
 |
|
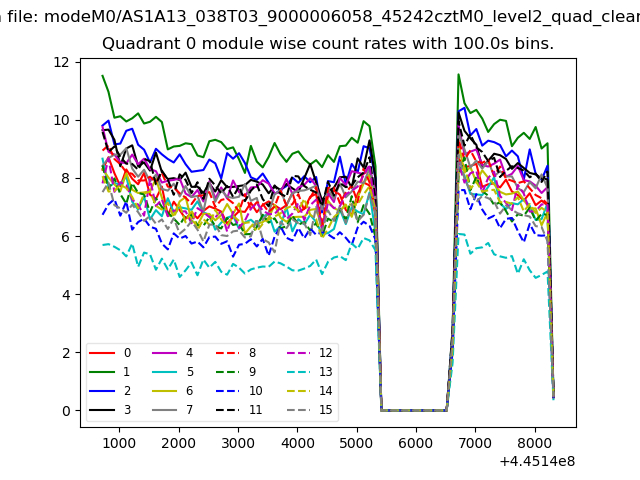
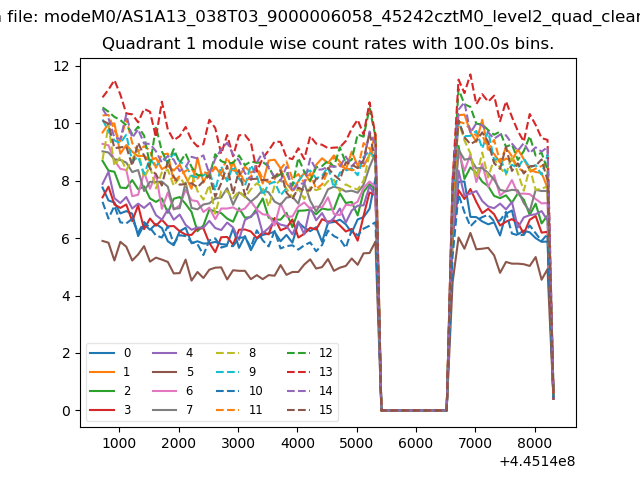
| Module-wise count rates for Quadrant A Data is divided into 100 sec bins |
 |
 |
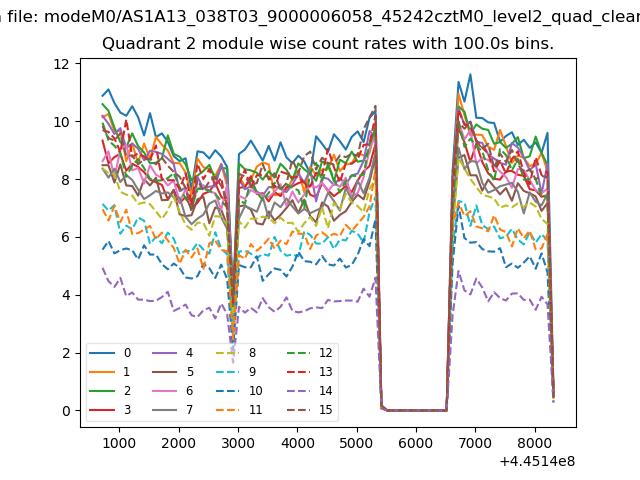
| Module-wise count rates for Quadrant B Data is divided into 100 sec bins |
 |
 |
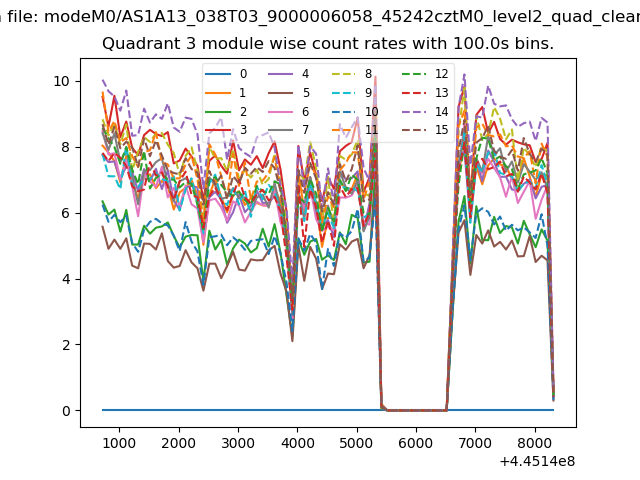
| Module-wise count rates for Quadrant C Data is divided into 100 sec bins |
 |
 |
| Module-wise count rates for Quadrant D Data is divided into 100 sec bins |
 |
 |
| Parameter | Plot |
|---|---|
| CZT HV Monitor | 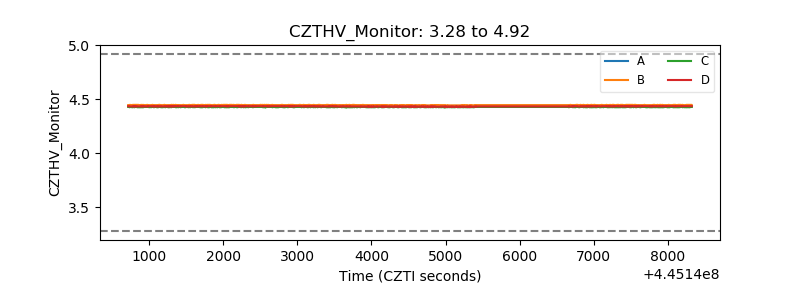 |
| D_VDD | 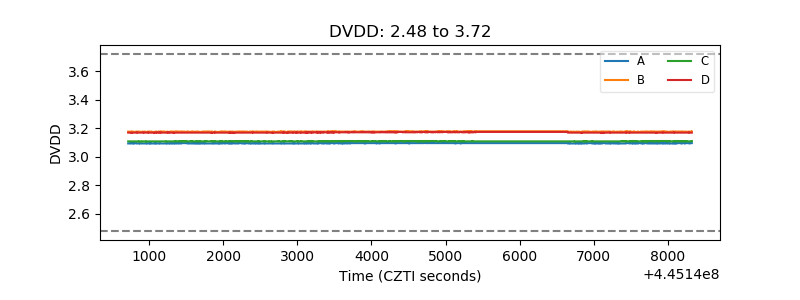 |
| Temperature 1 | 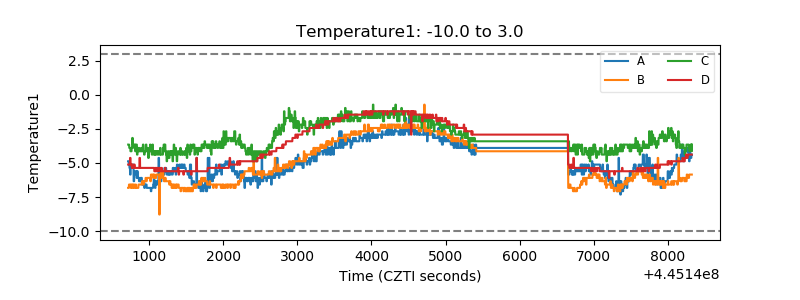 |
| Veto HV Monitor | 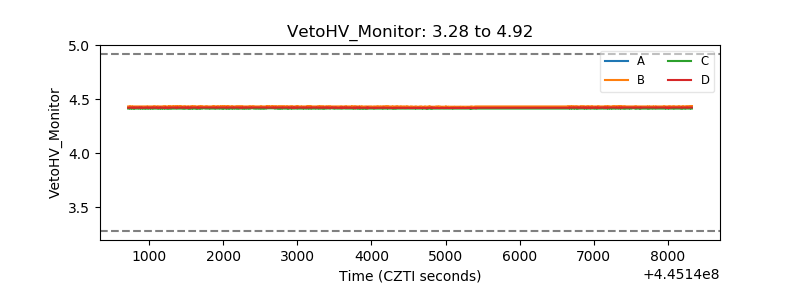 |
| Veto LLD | 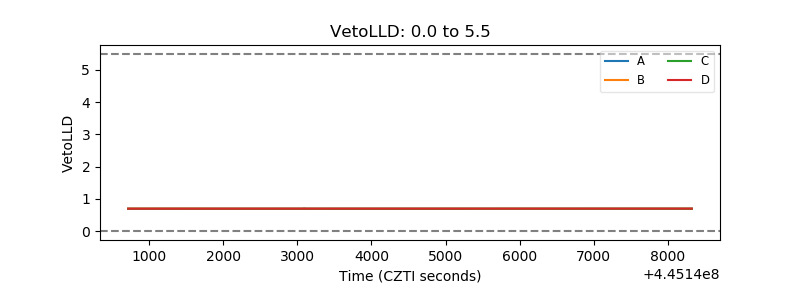 |
| Alpha Counter | 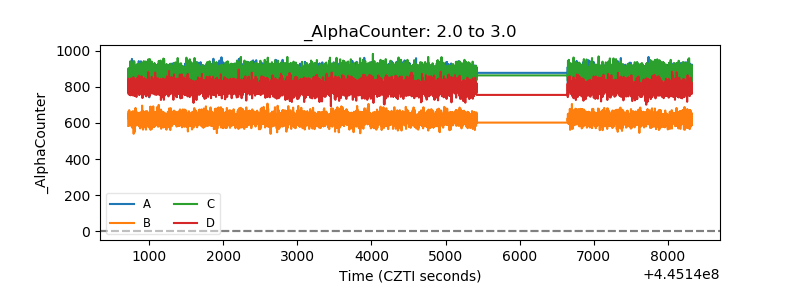 |
| _CPM_Rate | 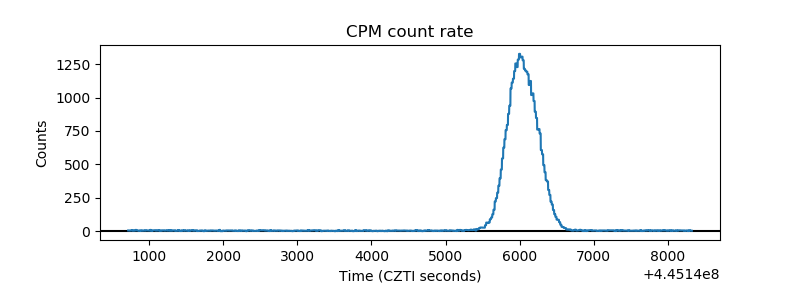 |
| CZT Counter | 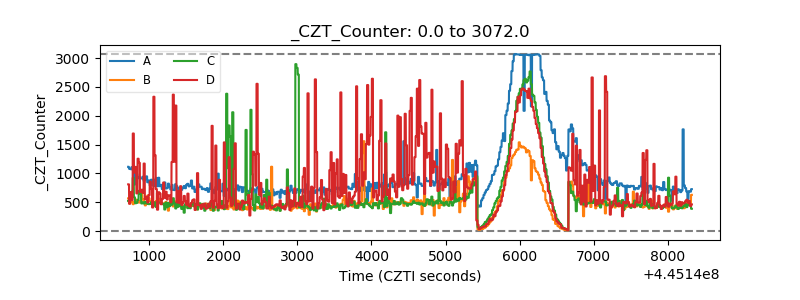 |
| +2.5 Volts monitor | 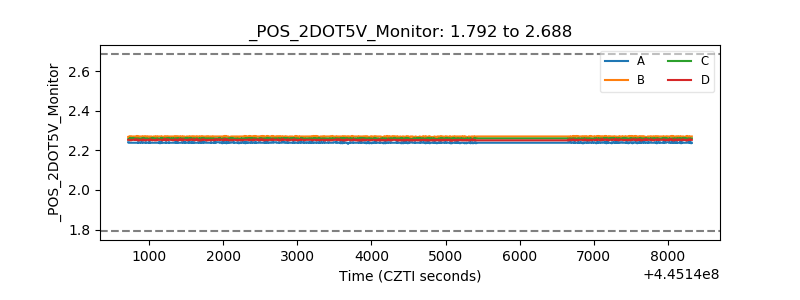 |
| +5 Volts monitor | 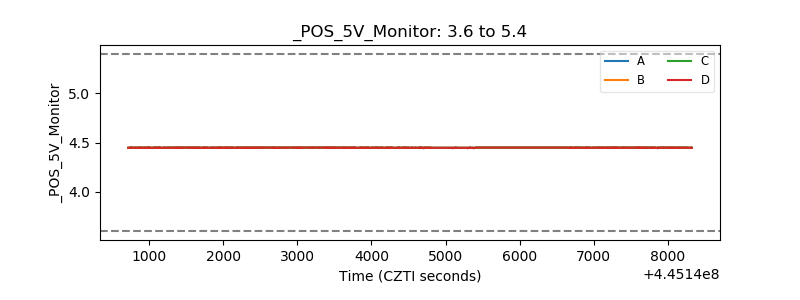 |
| _ROLL_ROT | 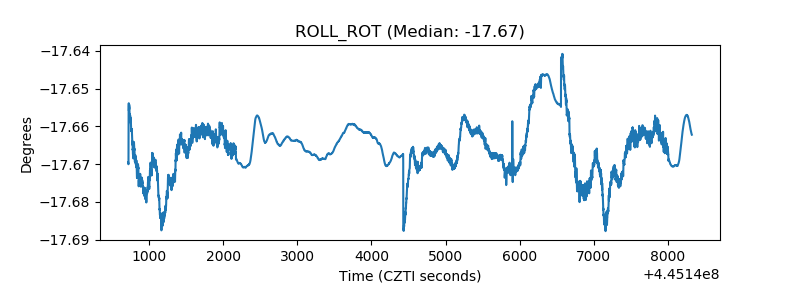 |
| _Roll_DEC | 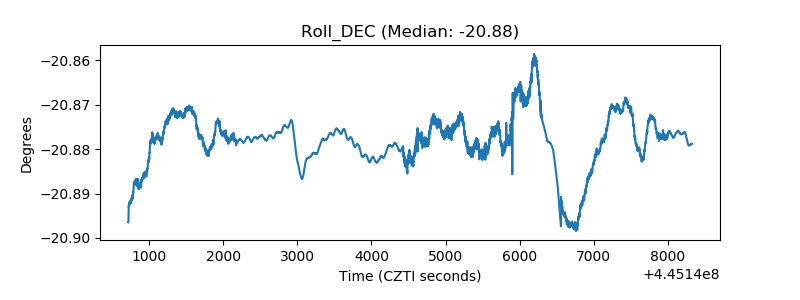 |
| _Roll_RA | 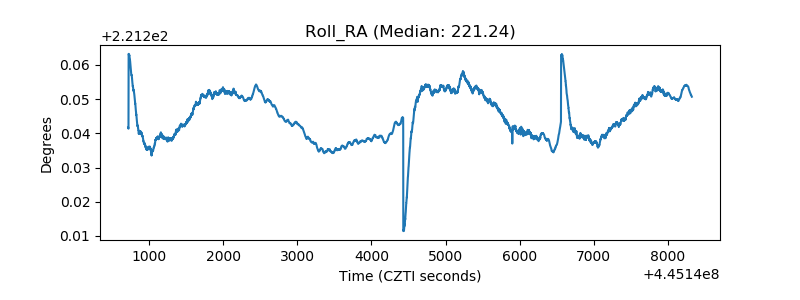 |
| Veto Counter | 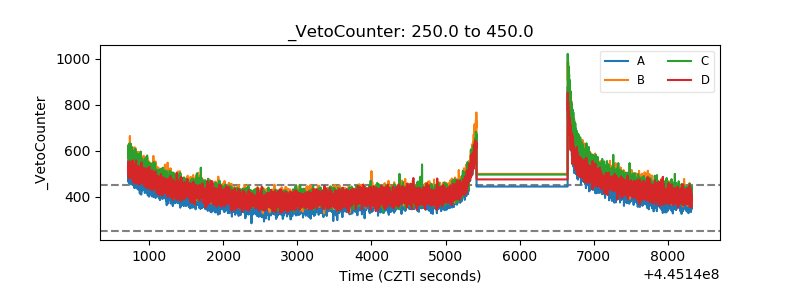 |