| Param | Original file | Final file |
|---|---|---|
| Filename | modeM0/AS1A13_038T03_9000006058_45244cztM0_level2.fits | modeM0/AS1A13_038T03_9000006058_45244cztM0_level2_quad_clean.evt |
| Size (bytes) | 437,958,720 | 101,364,480 |
| Size | 417.7 MB | 96.7 MB |
| Events in quadrant A | 5,035,307 | 670,190 |
| Events in quadrant B | 3,679,840 | 678,142 |
| Events in quadrant C | 2,971,813 | 685,241 |
| Events in quadrant D | 4,050,426 | 609,364 |
| Mode M0 | |||
|---|---|---|---|
| Quadrant | BADHDUFLAG | Total packets | Discarded packets |
| A | 0 | 19371 | 1 |
| B | 0 | 15031 | 1 |
| C | 0 | 13037 | 1 |
| D | 0 | 16159 | 1 |
| Mode M9 | |||
|---|---|---|---|
| Quadrant | BADHDUFLAG | Total packets | Discarded packets |
| A | 0 | 10 | 0 |
| B | 0 | 10 | 0 |
| C | 0 | 10 | 0 |
| D | 0 | 10 | 0 |
| Mode SS | |||
|---|---|---|---|
| Quadrant | BADHDUFLAG | Total packets | Discarded packets |
| A | 0 | 124 | 0 |
| B | 0 | 124 | 0 |
| C | 0 | 124 | 0 |
| D | 0 | 124 | 0 |
| Quadrant | Total seconds | Saturated seconds | Saturation percentage |
|---|---|---|---|
| A | 6106 | 179 | 2.931543% |
| B | 6107 | 326 | 5.338137% |
| C | 6107 | 62 | 1.015228% |
| D | 6107 | 193 | 3.160308% |
Noise dominated data is calculated using 1-second bins in cleaned event files. If a bin has >2000 counts, and if more than 50% of those come from <1% of pixels, then it is considered to be noise-dominated and hence unusable.
| Quadrant | # 1 sec bins | Bins with >0 counts | Bins with >2000 counts | High rate bins dominated by noise | Noise dominated (total time) | Noise dominated (detector-on time) | Marked lightcurve |
|---|---|---|---|---|---|---|---|
| A | 7096 | 6106 | 30 | 30 | 0.42% | 0.49% | 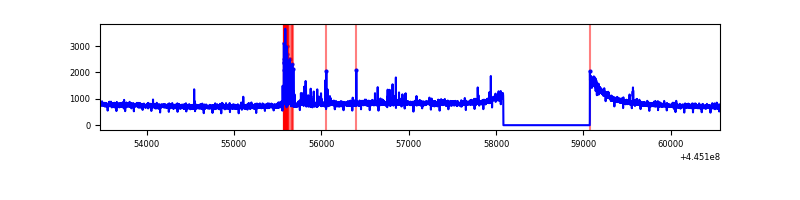 |
| B | 7097 | 6107 | 253 | 253 | 3.56% | 4.14% |  |
| C | 7097 | 6108 | 42 | 42 | 0.59% | 0.69% | 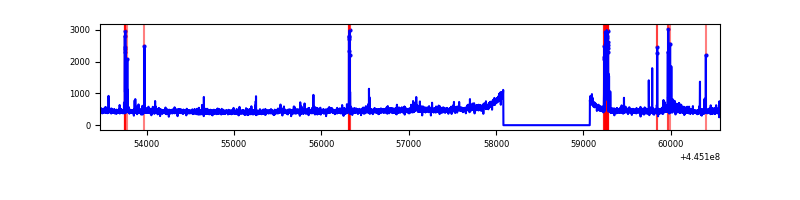 |
| D | 7097 | 6107 | 142 | 142 | 2.00% | 2.33% | 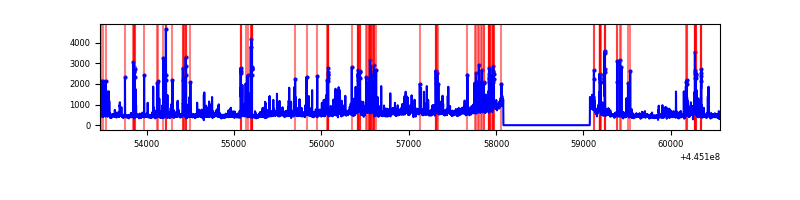 |
Top three noisy pixels from each quadrant. If the there are fewer than three noisy pixels in the level2.evt file, extra rows are filled as -1
| Pixel properties | Quadrant properties | ||||||
|---|---|---|---|---|---|---|---|
| Quadrant | DetID | PixID | Counts | Sigma | Mean | Median | Sigma |
| A | 10 | 83 | 2155188 | 14627.82 | 706 | 689 | 147.3 |
| A | 13 | 248 | 139675 | 943.64 | 706 | 689 | 147.3 |
| A | 0 | 243 | 8139 | 50.58 | 706 | 689 | 147.3 |
| B | 5 | 32 | 817111 | 5891.47 | 691 | 668 | 138.6 |
| B | 10 | 3 | 52546 | 374.35 | 691 | 668 | 138.6 |
| B | 5 | 172 | 42468 | 301.63 | 691 | 668 | 138.6 |
| C | 2 | 14 | 87153 | 517.76 | 706 | 710 | 167.0 |
| C | 1 | 3 | 44885 | 264.59 | 706 | 710 | 167.0 |
| C | 12 | 249 | 30585 | 178.94 | 706 | 710 | 167.0 |
| D | 13 | 249 | 333530 | 1888.94 | 697 | 678 | 176.2 |
| D | 11 | 241 | 321707 | 1821.84 | 697 | 678 | 176.2 |
| D | 12 | 17 | 243198 | 1376.3 | 697 | 678 | 176.2 |
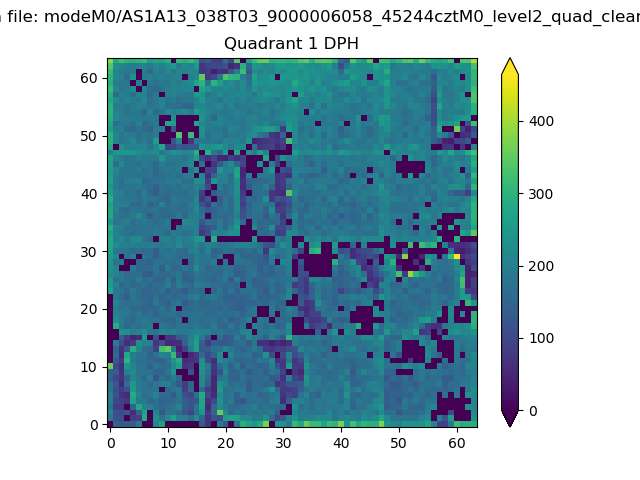
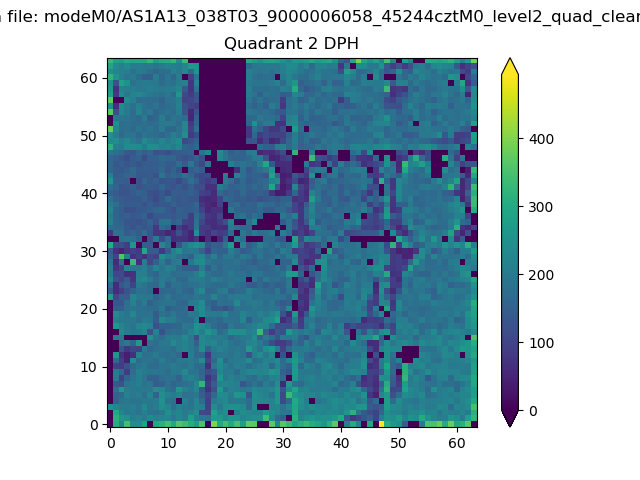
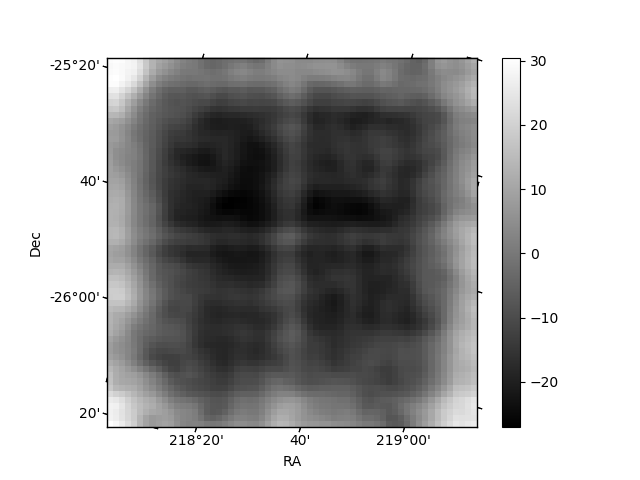
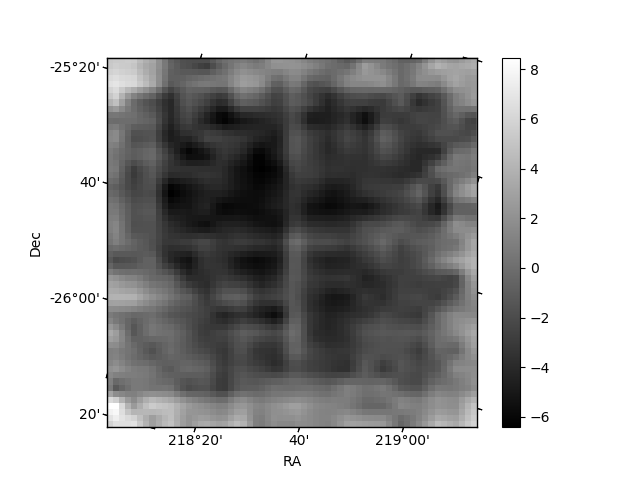
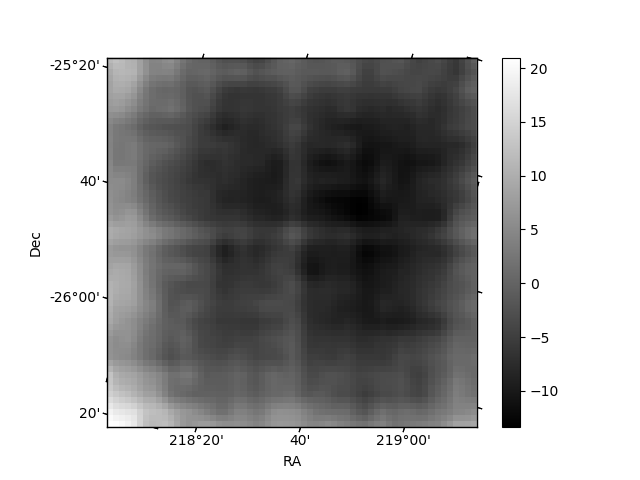
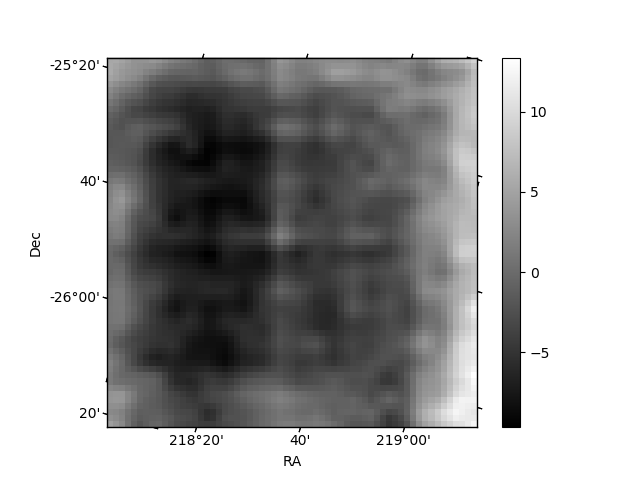
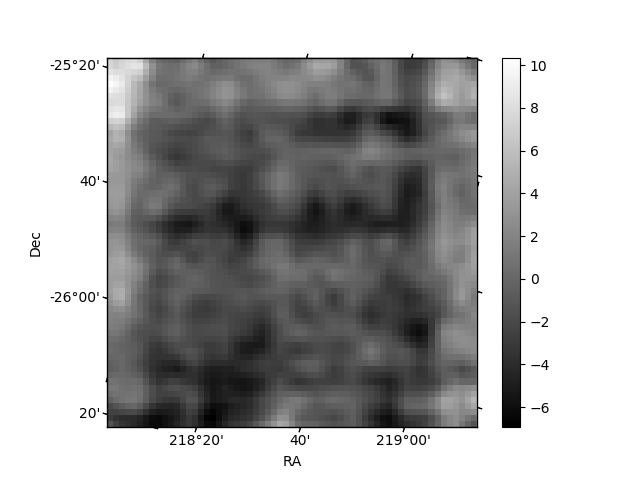
Histogram calculated using DETX and DETY for each event in the final _common_clean file
| Quadrant A | 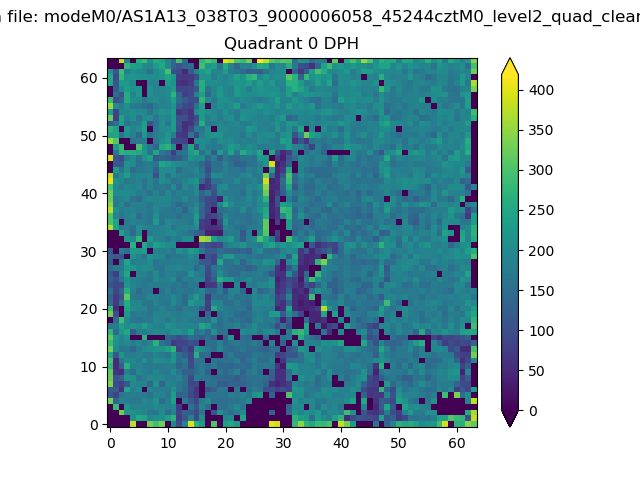 |
 |
Quadrant B |
|---|---|---|---|
| Quadrant D | 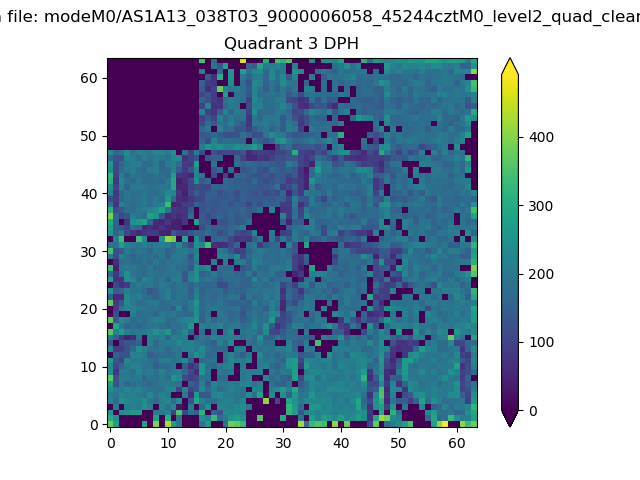 |
 |
Quadrant C |
| Plot type | Count rate plots | Images |
|---|---|---|
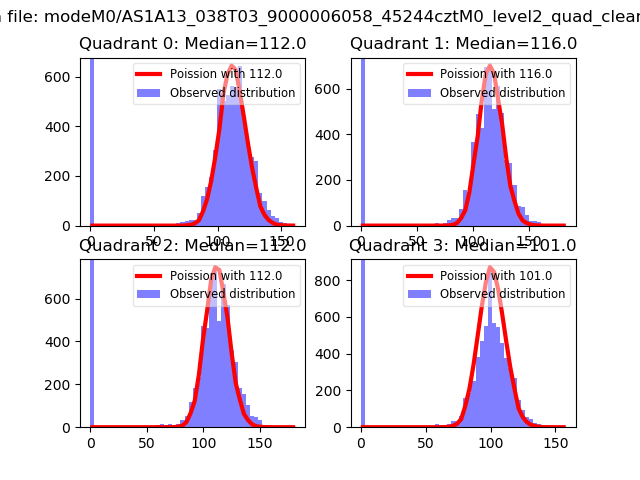
| Comparison with Poisson distribution Blue bars denote a histogram of data divided into 1 sec bins. Red curve is a Poisson curve with rate = median count rate of data. |
 |
 |
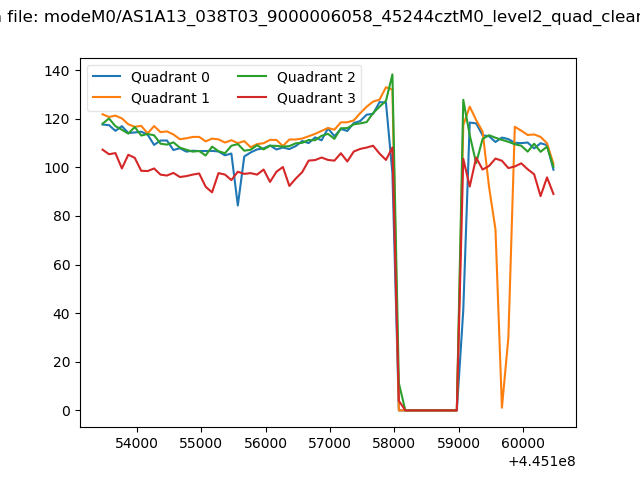
| Quadrant-wise count rates Data is divided into 100 sec bins |
 |
|
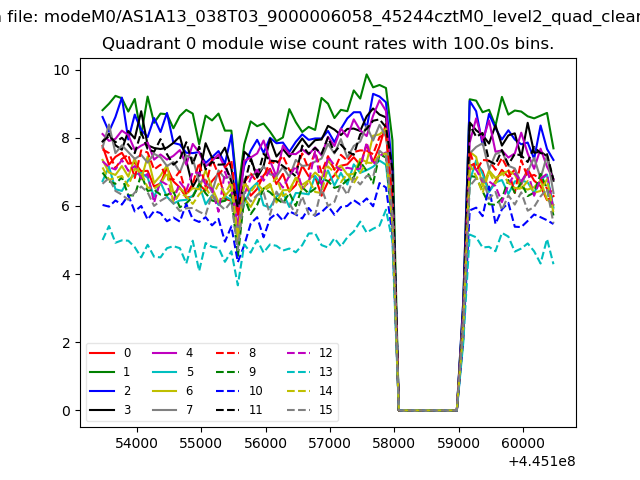
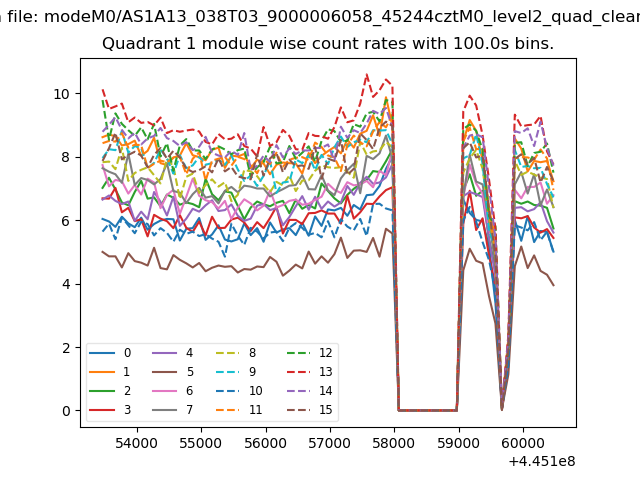
| Module-wise count rates for Quadrant A Data is divided into 100 sec bins |
 |
 |
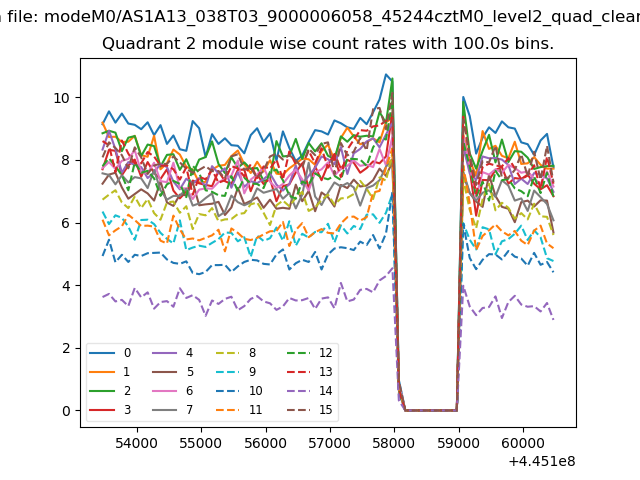
| Module-wise count rates for Quadrant B Data is divided into 100 sec bins |
 |
 |
| Module-wise count rates for Quadrant C Data is divided into 100 sec bins |
 |
 |
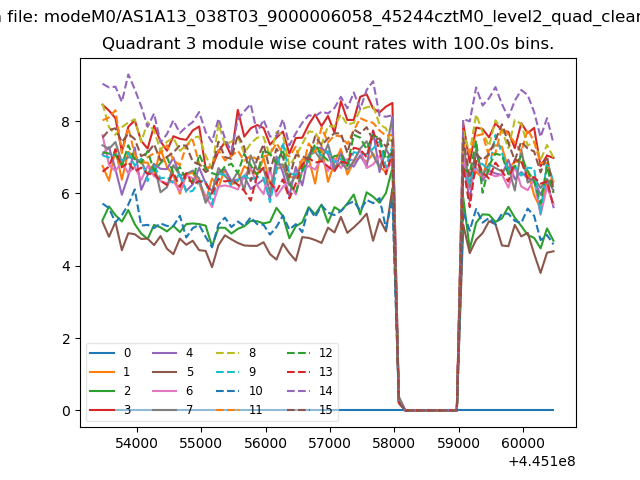
| Module-wise count rates for Quadrant D Data is divided into 100 sec bins |
 |
 |
| Parameter | Plot |
|---|---|
| CZT HV Monitor | 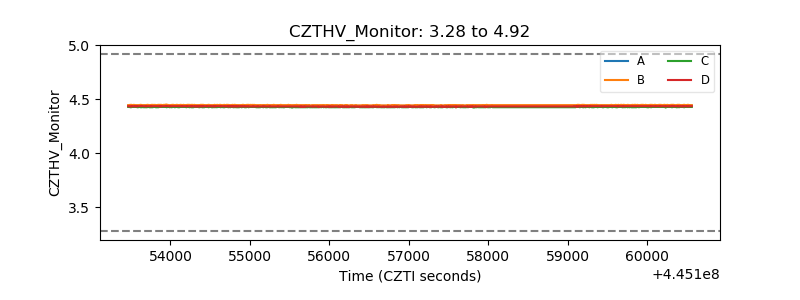 |
| D_VDD | 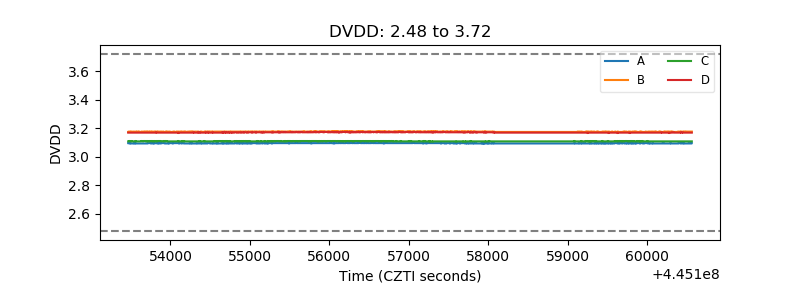 |
| Temperature 1 | 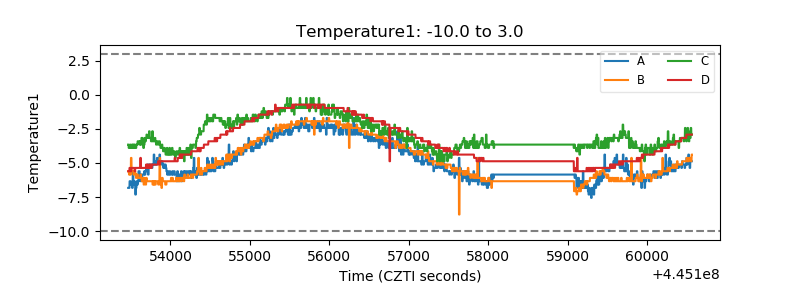 |
| Veto HV Monitor | 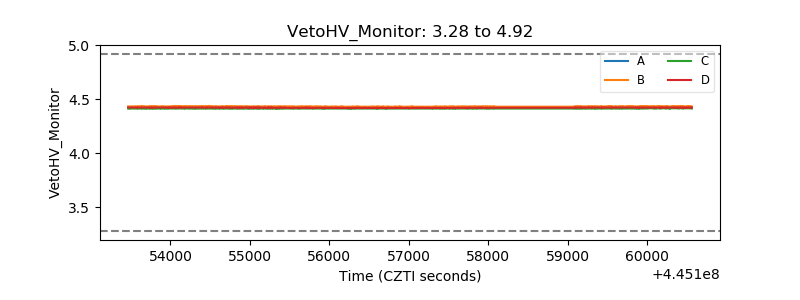 |
| Veto LLD | 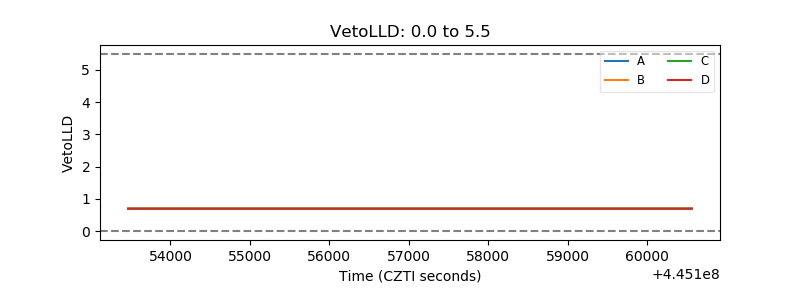 |
| Alpha Counter | 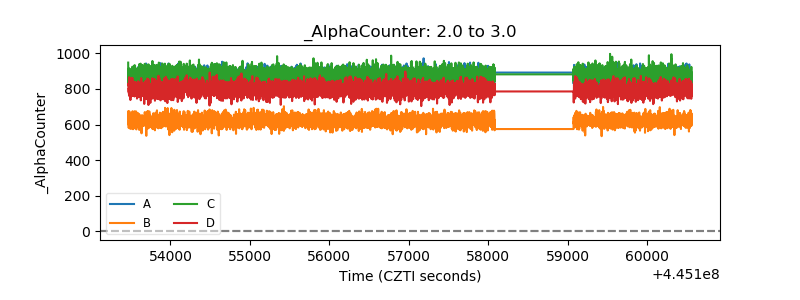 |
| _CPM_Rate | 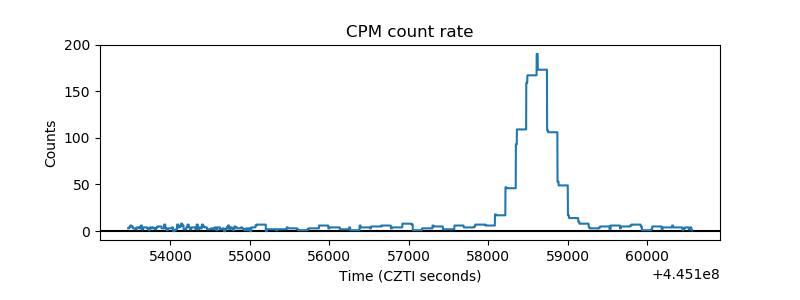 |
| CZT Counter | 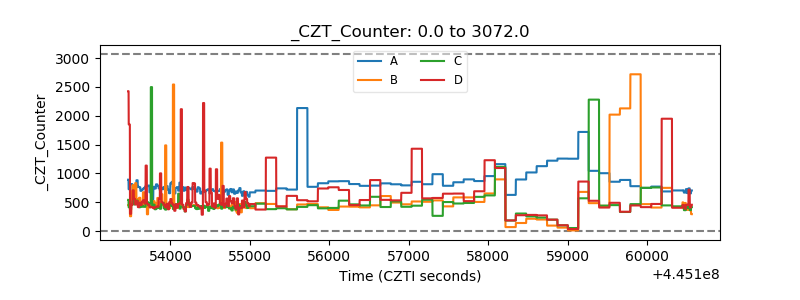 |
| +2.5 Volts monitor | 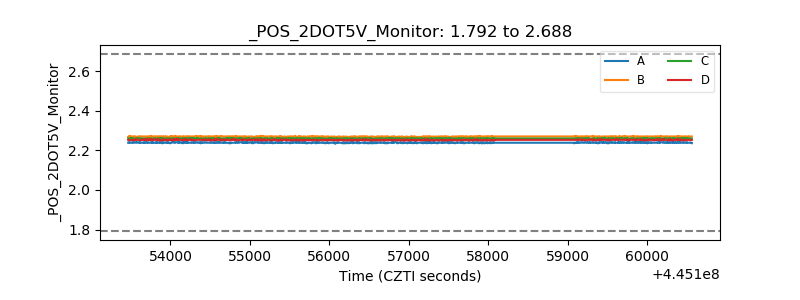 |
| +5 Volts monitor | 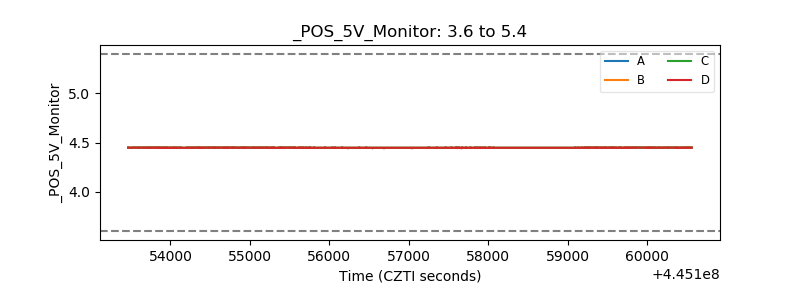 |
| _ROLL_ROT | 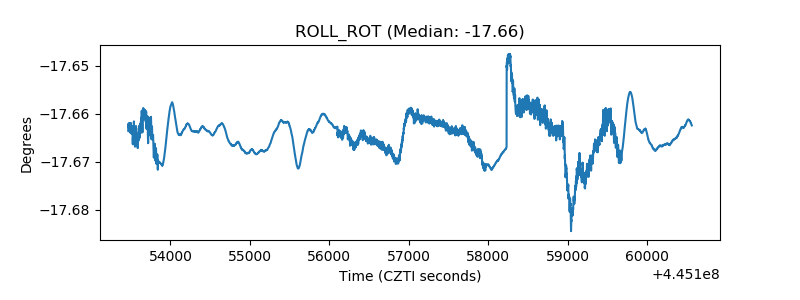 |
| _Roll_DEC | 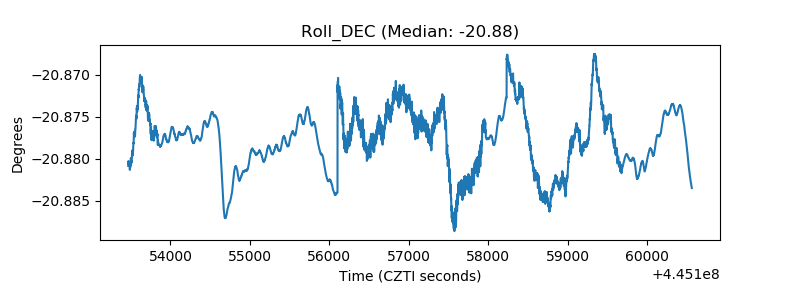 |
| _Roll_RA | 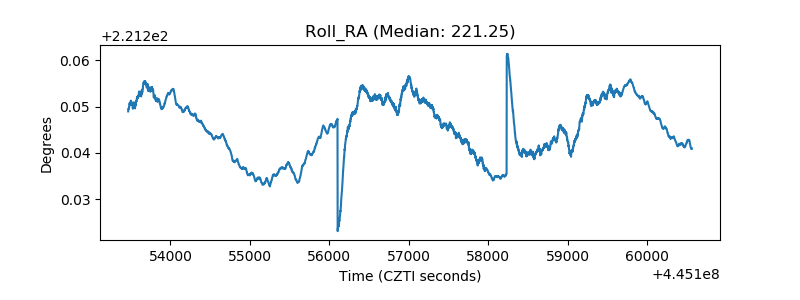 |
| Veto Counter | 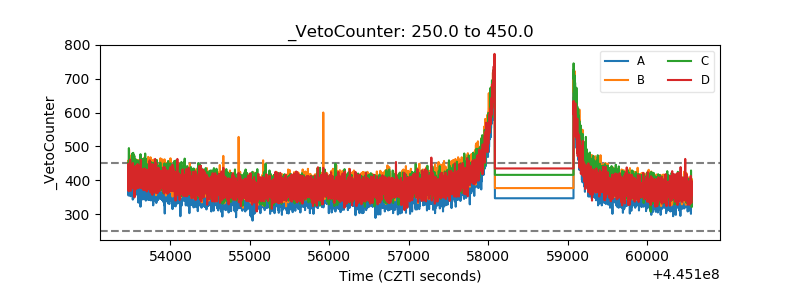 |