| Param | Original file | Final file |
|---|---|---|
| Filename | modeM0/AS1A13_038T03_9000006058_45245cztM0_level2.fits | modeM0/AS1A13_038T03_9000006058_45245cztM0_level2_quad_clean.evt |
| Size (bytes) | 495,178,560 | 106,404,480 |
| Size | 472.2 MB | 101.5 MB |
| Events in quadrant A | 5,452,945 | 708,439 |
| Events in quadrant B | 4,135,834 | 703,164 |
| Events in quadrant C | 3,817,760 | 702,077 |
| Events in quadrant D | 4,402,505 | 640,541 |
| Mode M0 | |||
|---|---|---|---|
| Quadrant | BADHDUFLAG | Total packets | Discarded packets |
| A | 0 | 21055 | 4 |
| B | 0 | 16913 | 2 |
| C | 0 | 15926 | 2 |
| D | 0 | 17530 | 2 |
| Mode M9 | |||
|---|---|---|---|
| Quadrant | BADHDUFLAG | Total packets | Discarded packets |
| A | 0 | 6 | 0 |
| B | 0 | 6 | 0 |
| C | 0 | 6 | 0 |
| D | 0 | 6 | 0 |
| Mode SS | |||
|---|---|---|---|
| Quadrant | BADHDUFLAG | Total packets | Discarded packets |
| A | 0 | 138 | 0 |
| B | 0 | 138 | 0 |
| C | 0 | 138 | 0 |
| D | 0 | 138 | 0 |
| Quadrant | Total seconds | Saturated seconds | Saturation percentage |
|---|---|---|---|
| A | 6707 | 231 | 3.444163% |
| B | 6708 | 468 | 6.976744% |
| C | 6708 | 327 | 4.874776% |
| D | 6708 | 260 | 3.875969% |
Noise dominated data is calculated using 1-second bins in cleaned event files. If a bin has >2000 counts, and if more than 50% of those come from <1% of pixels, then it is considered to be noise-dominated and hence unusable.
| Quadrant | # 1 sec bins | Bins with >0 counts | Bins with >2000 counts | High rate bins dominated by noise | Noise dominated (total time) | Noise dominated (detector-on time) | Marked lightcurve |
|---|---|---|---|---|---|---|---|
| A | 7277 | 6709 | 35 | 35 | 0.48% | 0.52% | 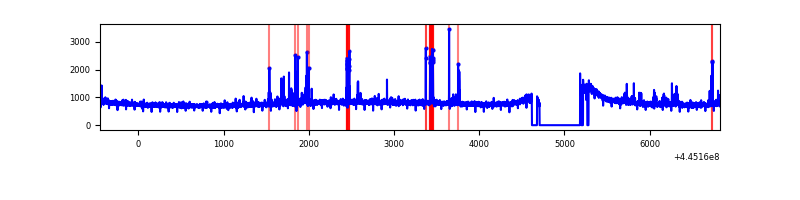 |
| B | 7278 | 6710 | 323 | 323 | 4.44% | 4.81% | 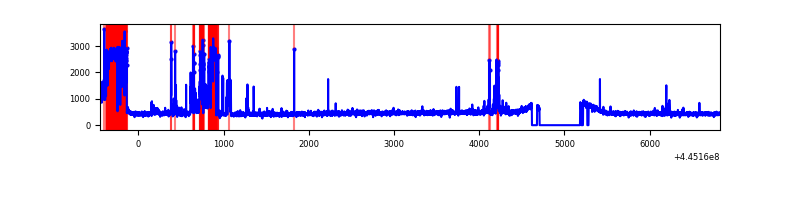 |
| C | 7278 | 6710 | 162 | 162 | 2.23% | 2.41% | 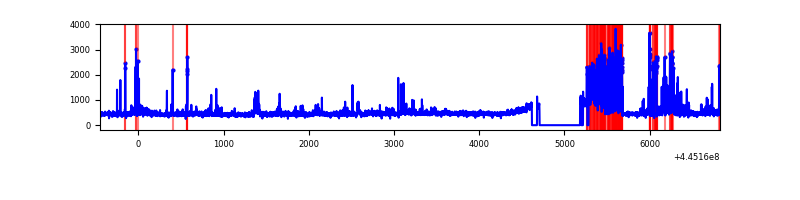 |
| D | 7278 | 6711 | 128 | 128 | 1.76% | 1.91% | 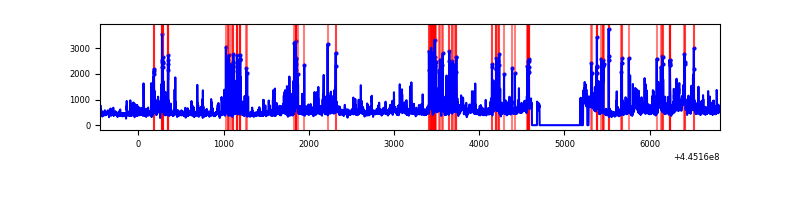 |
Top three noisy pixels from each quadrant. If the there are fewer than three noisy pixels in the level2.evt file, extra rows are filled as -1
| Pixel properties | Quadrant properties | ||||||
|---|---|---|---|---|---|---|---|
| Quadrant | DetID | PixID | Counts | Sigma | Mean | Median | Sigma |
| A | 10 | 83 | 2272952 | 14286.31 | 761 | 746 | 159.0 |
| A | 13 | 248 | 96931 | 604.76 | 761 | 746 | 159.0 |
| A | 12 | 227 | 76160 | 474.16 | 761 | 746 | 159.0 |
| B | 5 | 32 | 1089966 | 7354.94 | 743 | 720 | 148.1 |
| B | 12 | 3 | 61971 | 413.58 | 743 | 720 | 148.1 |
| B | 5 | 172 | 36773 | 243.44 | 743 | 720 | 148.1 |
| C | 14 | 254 | 606731 | 3436.02 | 752 | 754 | 176.4 |
| C | 12 | 250 | 172153 | 971.87 | 752 | 754 | 176.4 |
| C | 3 | 233 | 37377 | 207.66 | 752 | 754 | 176.4 |
| D | 13 | 249 | 360449 | 1888.68 | 753 | 730 | 190.5 |
| D | 12 | 17 | 289576 | 1516.56 | 753 | 730 | 190.5 |
| D | 11 | 241 | 153044 | 799.71 | 753 | 730 | 190.5 |
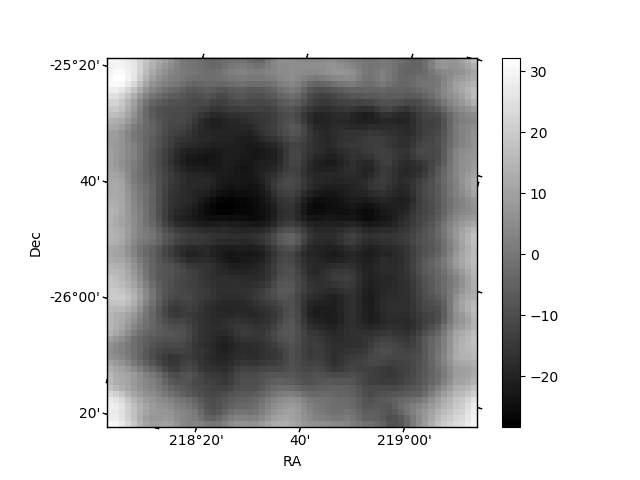
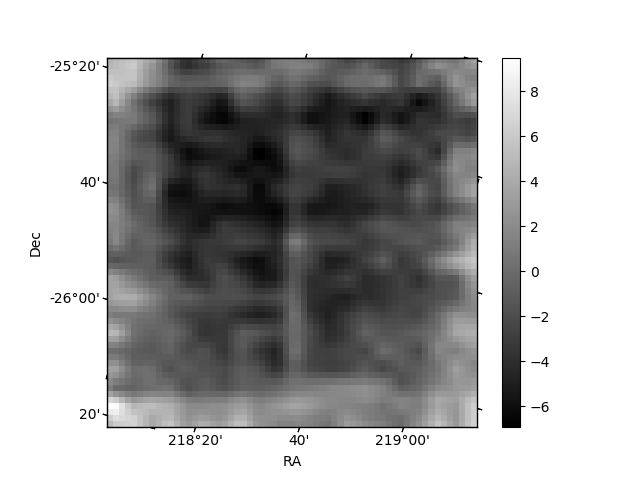
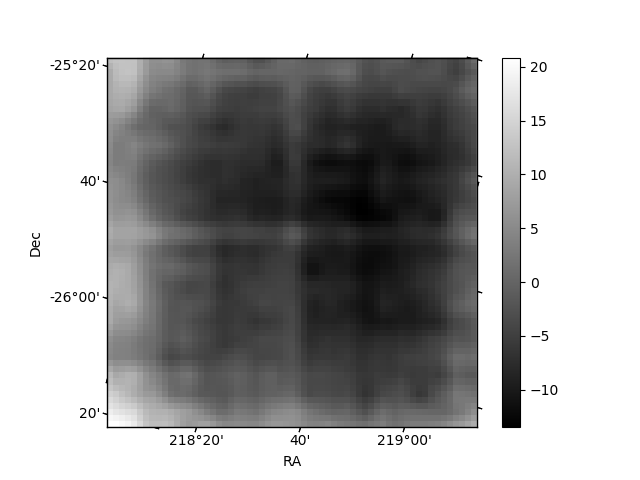
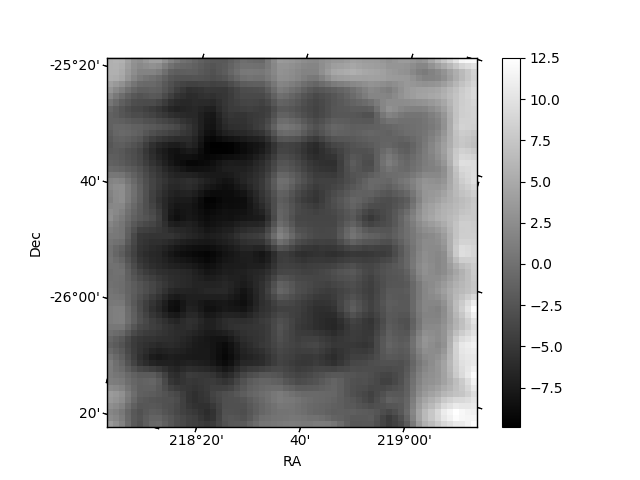
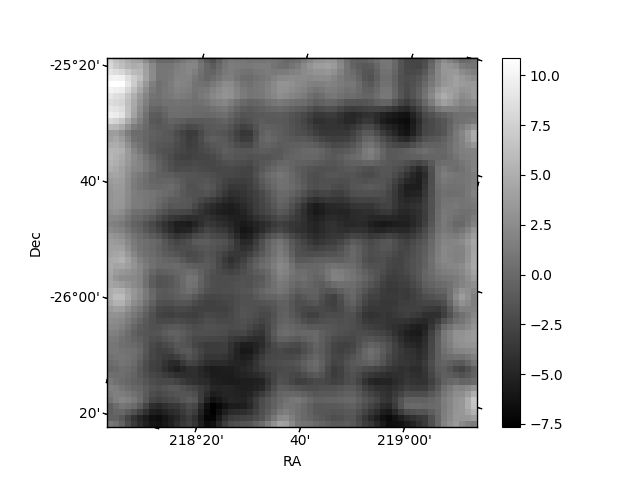
Histogram calculated using DETX and DETY for each event in the final _common_clean file
| Quadrant A | 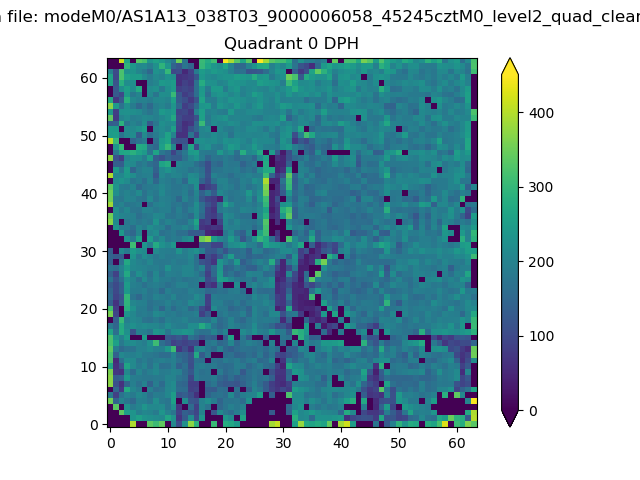 |
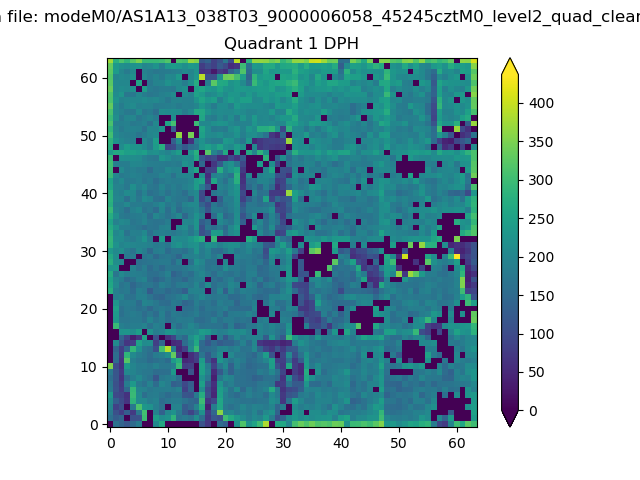 |
Quadrant B |
|---|---|---|---|
| Quadrant D | 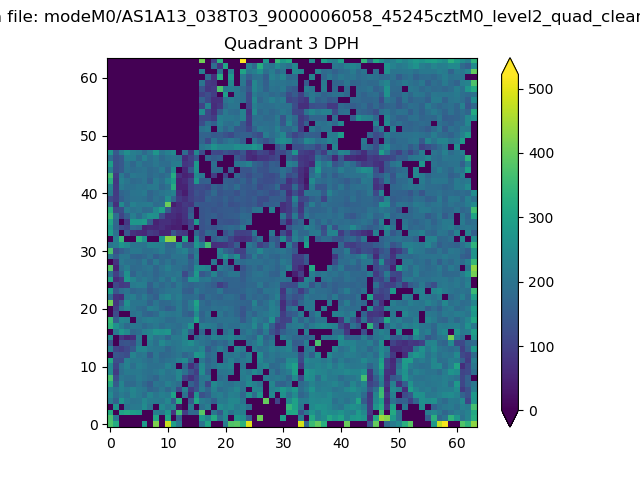 |
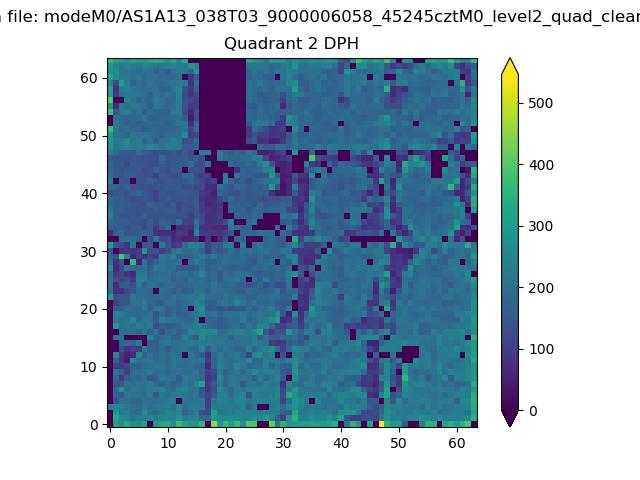 |
Quadrant C |
| Plot type | Count rate plots | Images |
|---|---|---|
| Comparison with Poisson distribution Blue bars denote a histogram of data divided into 1 sec bins. Red curve is a Poisson curve with rate = median count rate of data. |
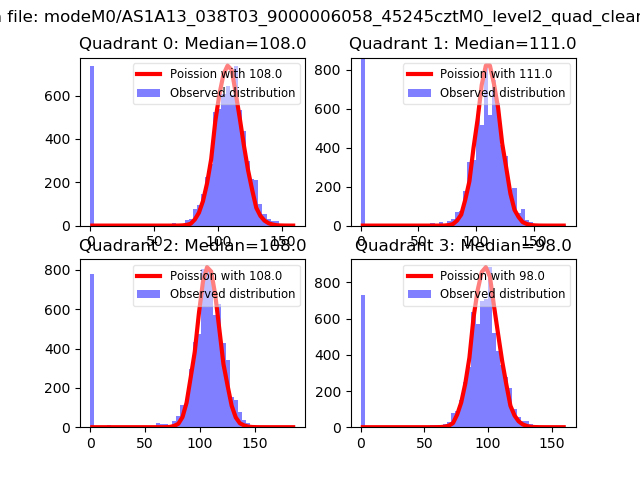 |
 |
| Quadrant-wise count rates Data is divided into 100 sec bins |
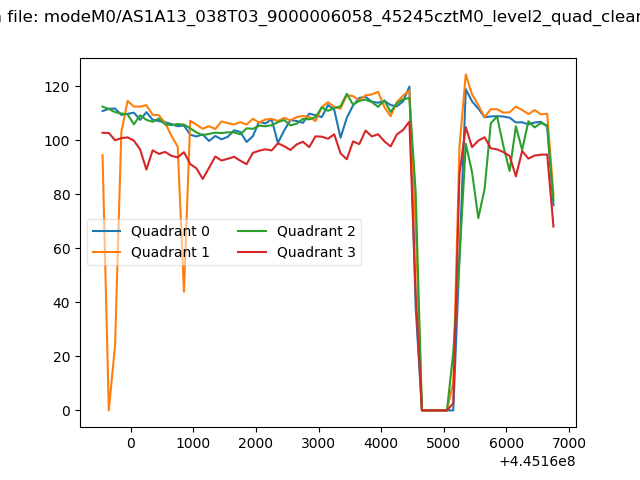 |
|
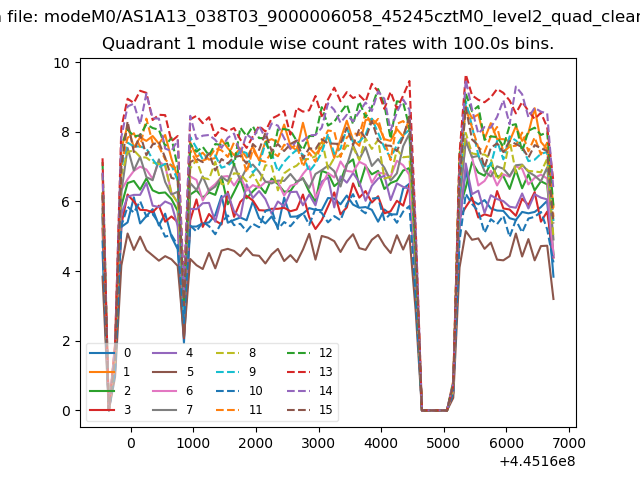
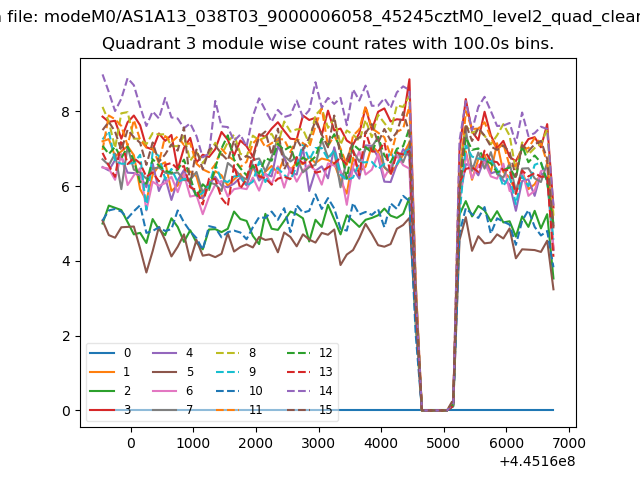
| Module-wise count rates for Quadrant A Data is divided into 100 sec bins |
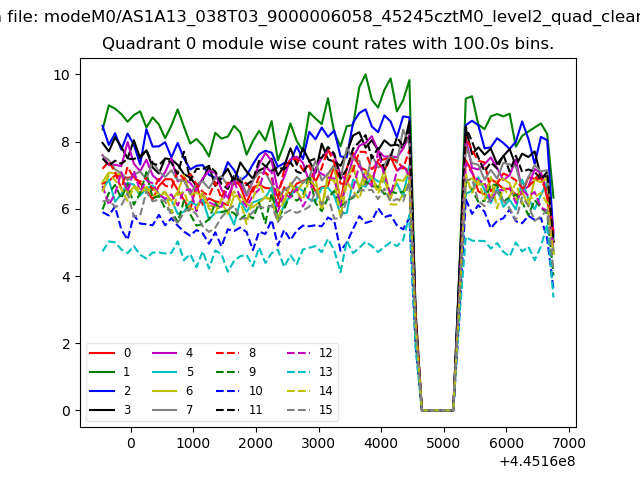 |
 |
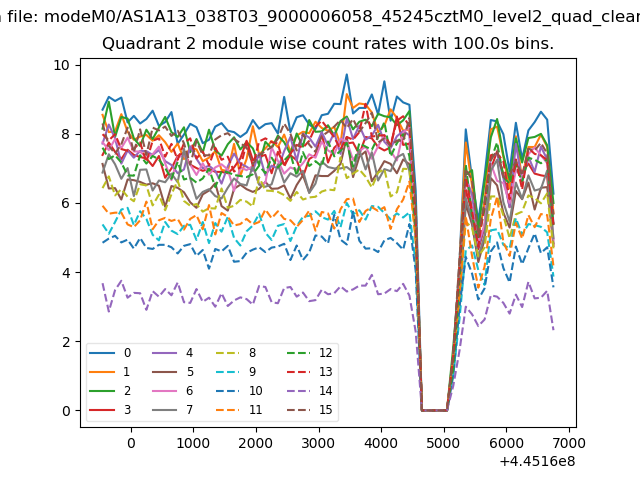
| Module-wise count rates for Quadrant B Data is divided into 100 sec bins |
 |
 |
| Module-wise count rates for Quadrant C Data is divided into 100 sec bins |
 |
 |
| Module-wise count rates for Quadrant D Data is divided into 100 sec bins |
 |
 |
| Parameter | Plot |
|---|---|
| CZT HV Monitor | 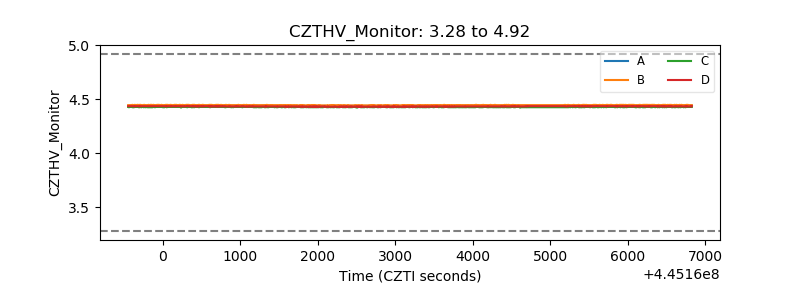 |
| D_VDD | 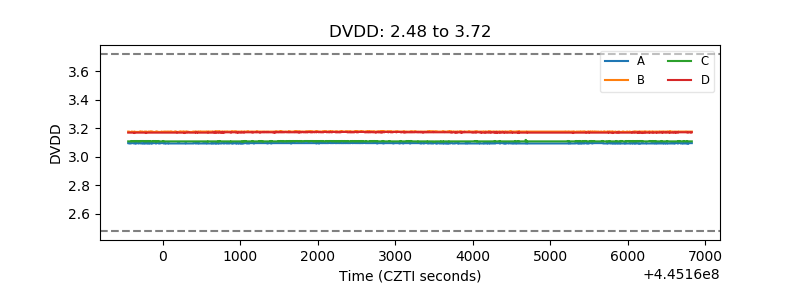 |
| Temperature 1 | 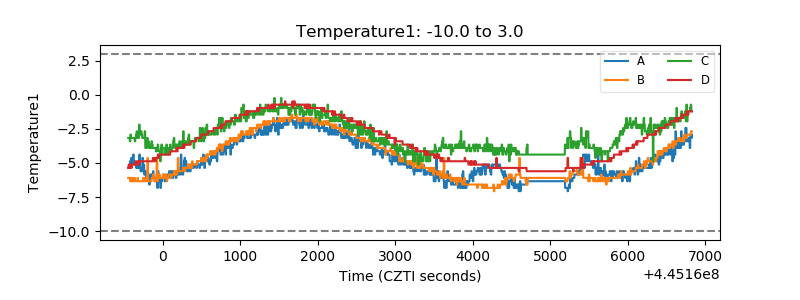 |
| Veto HV Monitor |  |
| Veto LLD | 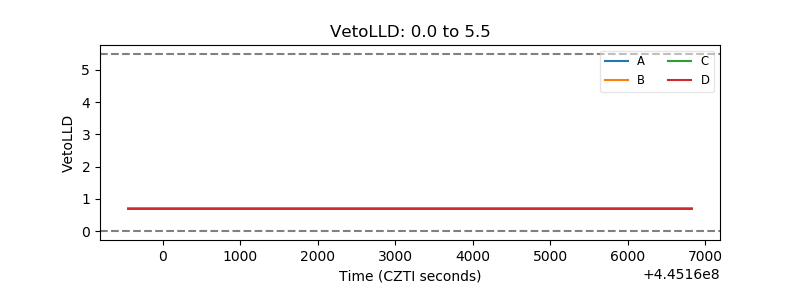 |
| Alpha Counter | 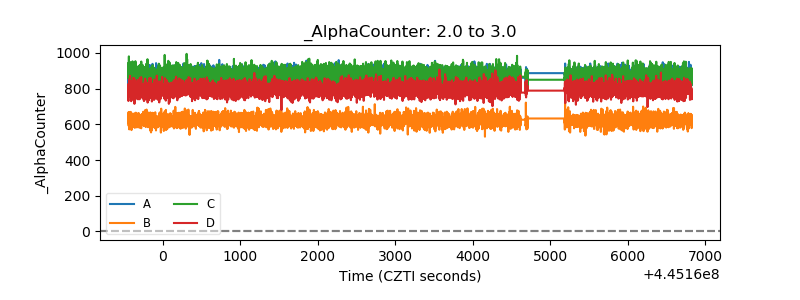 |
| _CPM_Rate | 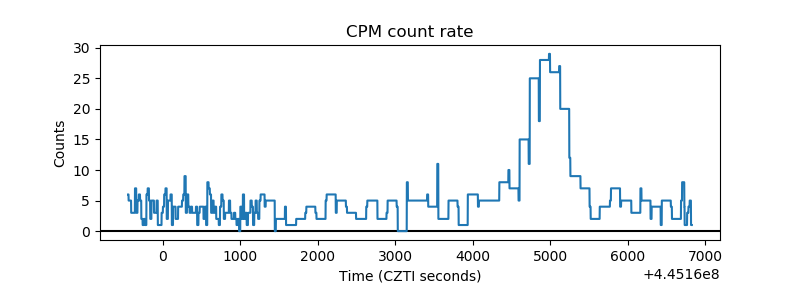 |
| CZT Counter | 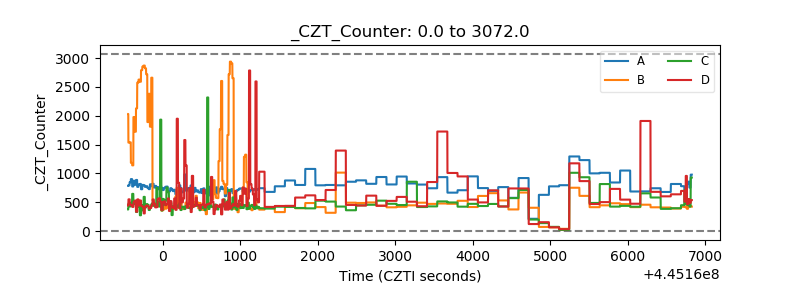 |
| +2.5 Volts monitor | 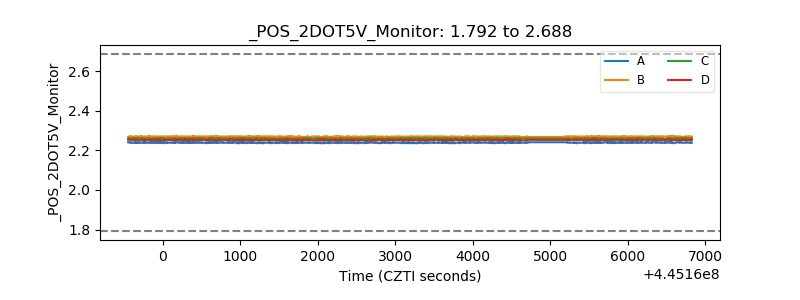 |
| +5 Volts monitor | 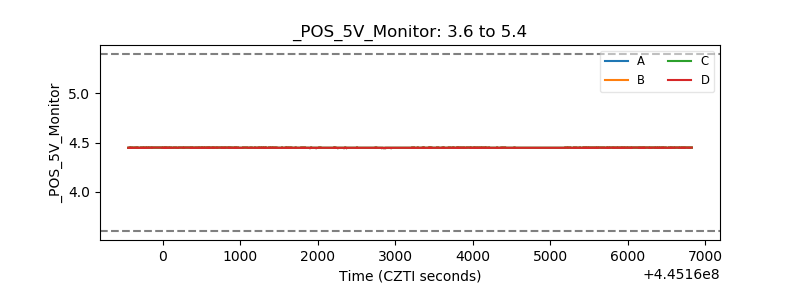 |
| _ROLL_ROT | 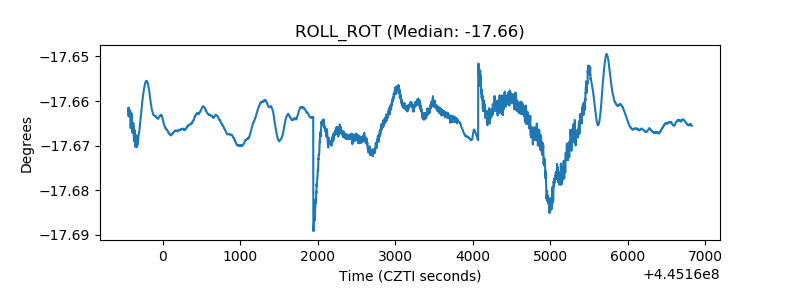 |
| _Roll_DEC | 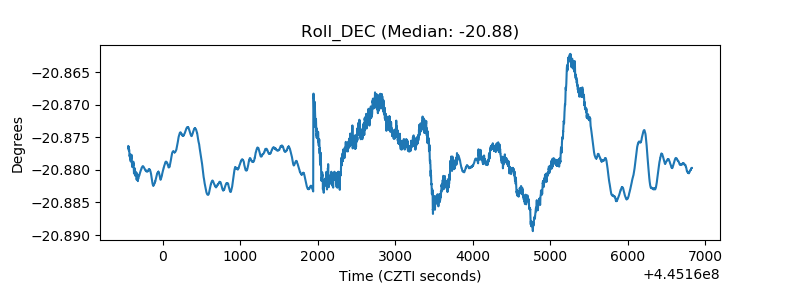 |
| _Roll_RA | 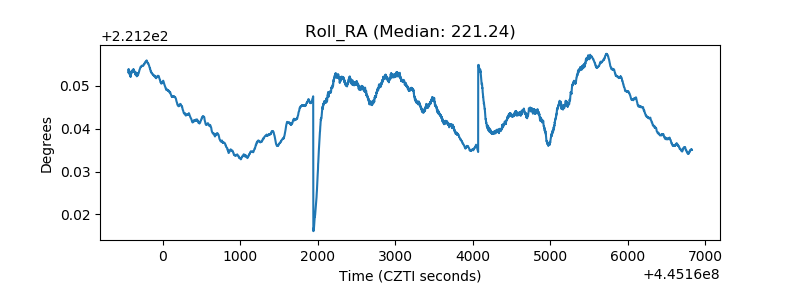 |
| Veto Counter | 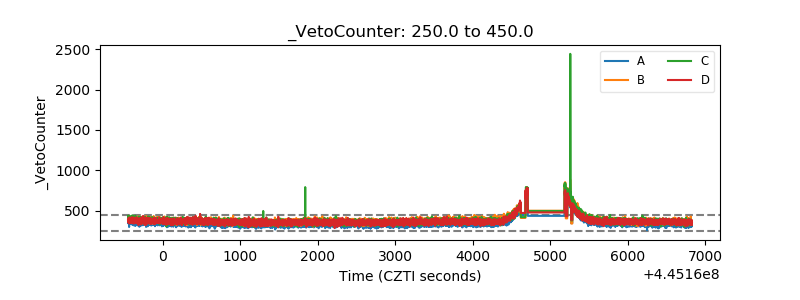 |