| Param | Original file | Final file |
|---|---|---|
| Filename | modeM0/AS1A13_038T03_9000006058_45246cztM0_level2.fits | modeM0/AS1A13_038T03_9000006058_45246cztM0_level2_quad_clean.evt |
| Size (bytes) | 352,131,840 | 71,778,240 |
| Size | 335.8 MB | 68.5 MB |
| Events in quadrant A | 3,726,916 | 479,129 |
| Events in quadrant B | 2,043,368 | 493,314 |
| Events in quadrant C | 3,366,779 | 454,612 |
| Events in quadrant D | 3,544,879 | 426,771 |
| Mode M0 | |||
|---|---|---|---|
| Quadrant | BADHDUFLAG | Total packets | Discarded packets |
| A | 0 | 14094 | 0 |
| B | 0 | 9252 | 0 |
| C | 0 | 13127 | 0 |
| D | 0 | 13622 | 0 |
| Mode SS | |||
|---|---|---|---|
| Quadrant | BADHDUFLAG | Total packets | Discarded packets |
| A | 0 | 92 | 0 |
| B | 0 | 92 | 0 |
| C | 0 | 92 | 0 |
| D | 0 | 92 | 0 |
| Quadrant | Total seconds | Saturated seconds | Saturation percentage |
|---|---|---|---|
| A | 4537 | 11 | 0.242451% |
| B | 4537 | 16 | 0.352656% |
| C | 4538 | 302 | 6.654914% |
| D | 4538 | 145 | 3.195240% |
Noise dominated data is calculated using 1-second bins in cleaned event files. If a bin has >2000 counts, and if more than 50% of those come from <1% of pixels, then it is considered to be noise-dominated and hence unusable.
| Quadrant | # 1 sec bins | Bins with >0 counts | Bins with >2000 counts | High rate bins dominated by noise | Noise dominated (total time) | Noise dominated (detector-on time) | Marked lightcurve |
|---|---|---|---|---|---|---|---|
| A | 4537 | 4537 | 6 | 6 | 0.13% | 0.13% | 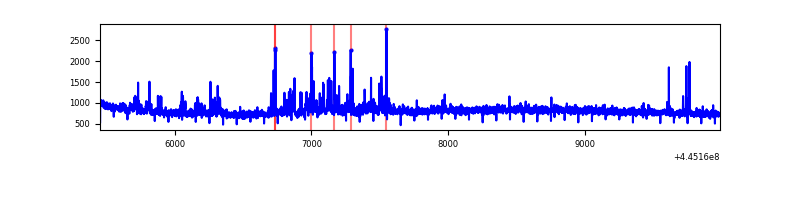 |
| B | 4537 | 4537 | 10 | 10 | 0.22% | 0.22% | 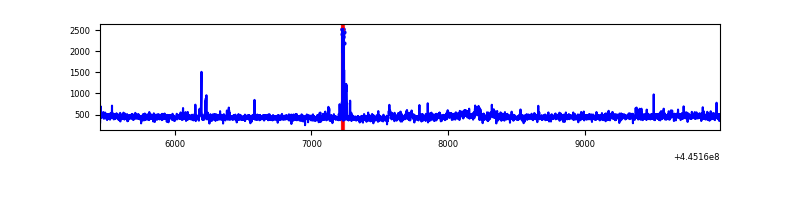 |
| C | 4538 | 4538 | 269 | 269 | 5.93% | 5.93% | 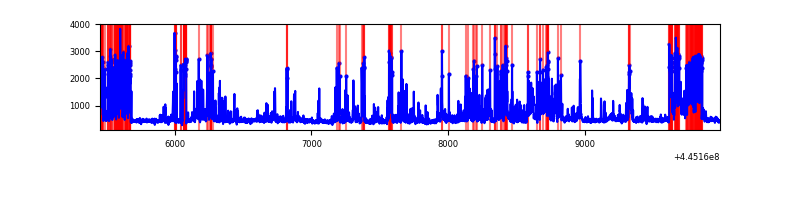 |
| D | 4538 | 4538 | 143 | 143 | 3.15% | 3.15% | 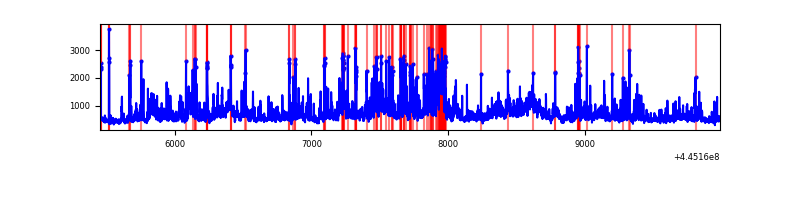 |
Top three noisy pixels from each quadrant. If the there are fewer than three noisy pixels in the level2.evt file, extra rows are filled as -1
| Pixel properties | Quadrant properties | ||||||
|---|---|---|---|---|---|---|---|
| Quadrant | DetID | PixID | Counts | Sigma | Mean | Median | Sigma |
| A | 10 | 83 | 1587929 | 15325.28 | 496 | 486 | 103.6 |
| A | 12 | 227 | 173237 | 1667.75 | 496 | 486 | 103.6 |
| A | 13 | 248 | 26012 | 246.43 | 496 | 486 | 103.6 |
| B | 0 | 168 | 35143 | 349.63 | 495 | 480 | 99.1 |
| B | 0 | 183 | 20308 | 200.0 | 495 | 480 | 99.1 |
| B | 0 | 245 | 12670 | 122.96 | 495 | 480 | 99.1 |
| C | 14 | 254 | 1021398 | 9046.89 | 477 | 481 | 112.8 |
| C | 12 | 250 | 413727 | 3661.99 | 477 | 481 | 112.8 |
| C | 1 | 3 | 27992 | 243.79 | 477 | 481 | 112.8 |
| D | 11 | 241 | 591996 | 4765.95 | 485 | 470 | 124.1 |
| D | 13 | 249 | 402201 | 3236.76 | 485 | 470 | 124.1 |
| D | 12 | 17 | 212804 | 1710.78 | 485 | 470 | 124.1 |
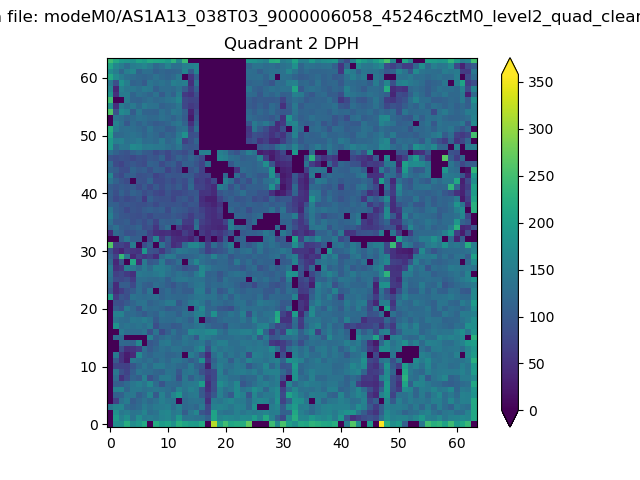
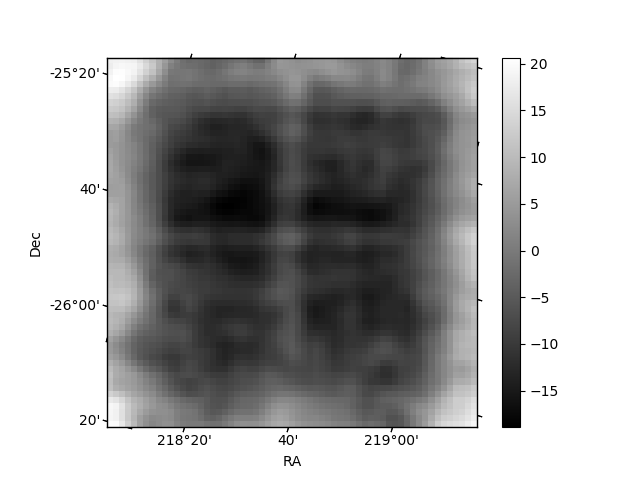
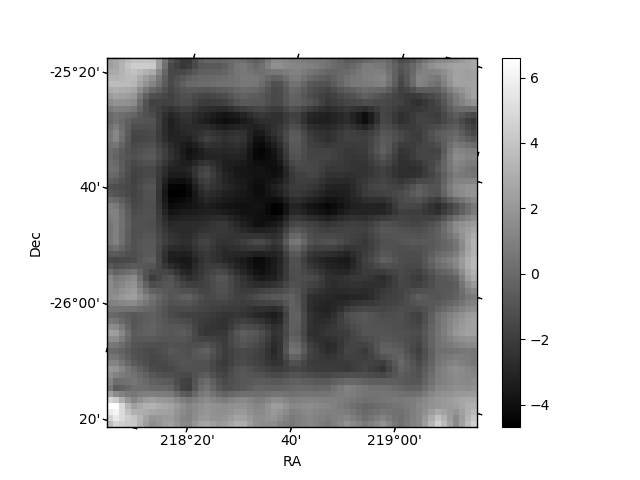
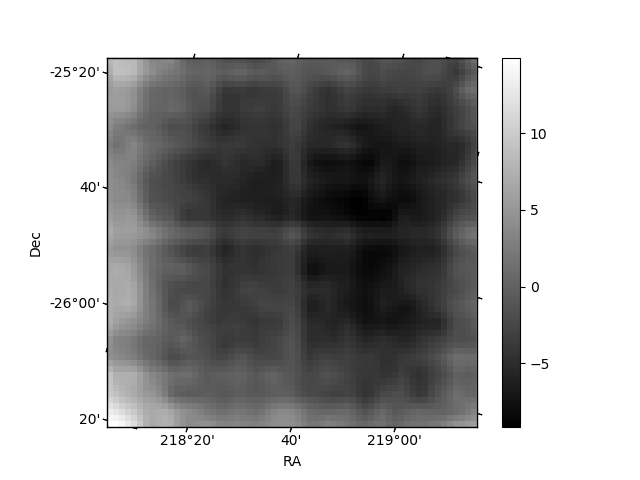
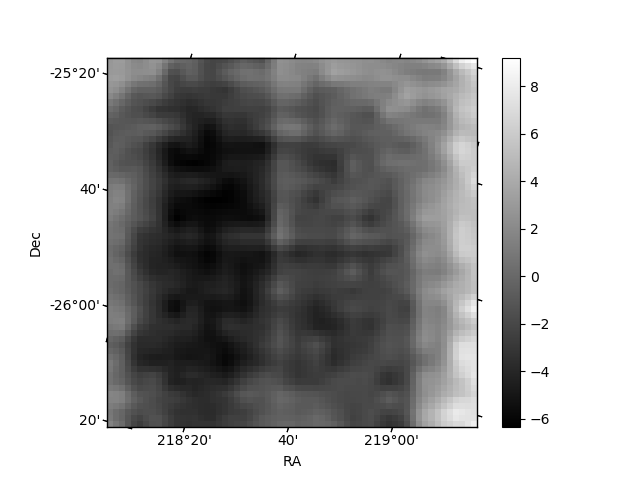
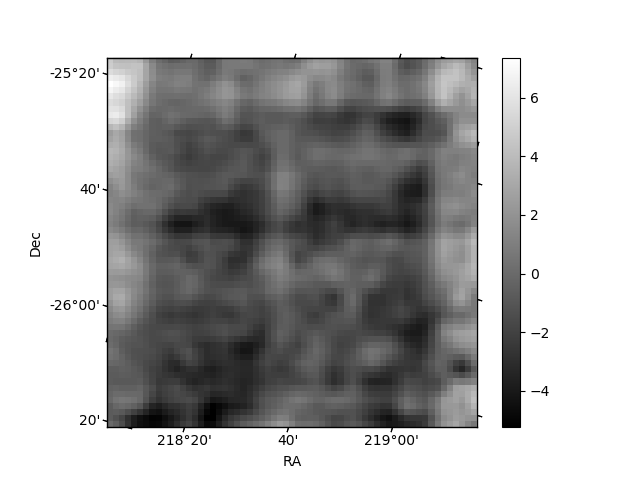
Histogram calculated using DETX and DETY for each event in the final _common_clean file
| Quadrant A | 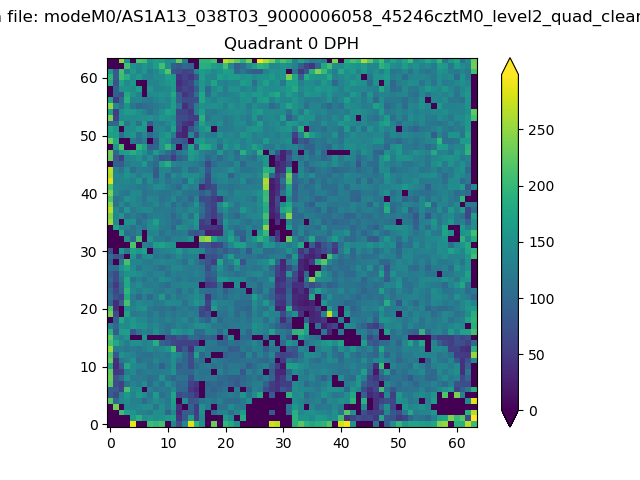 |
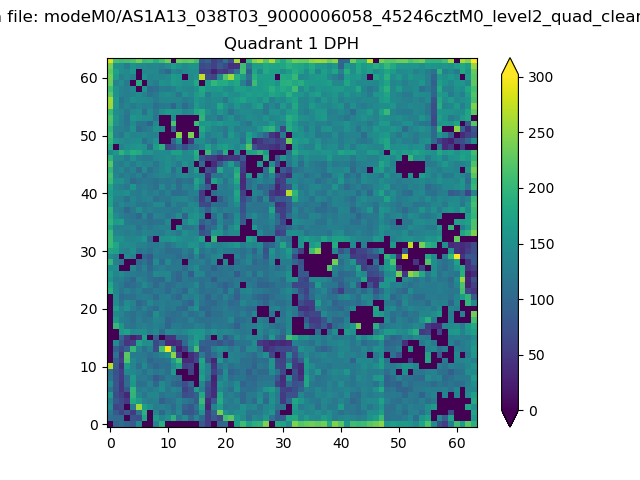 |
Quadrant B |
|---|---|---|---|
| Quadrant D | 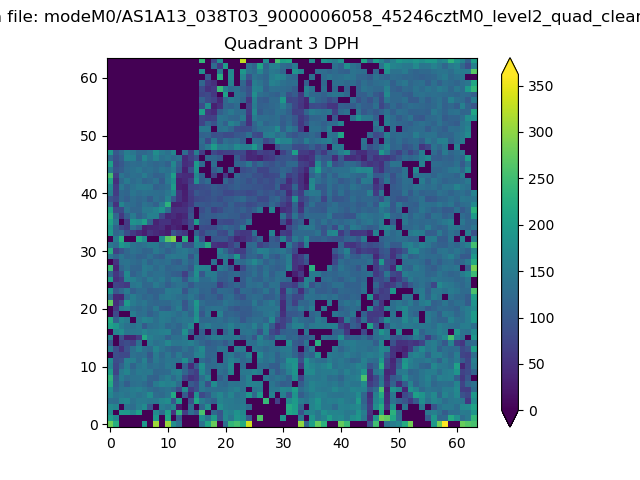 |
 |
Quadrant C |
| Plot type | Count rate plots | Images |
|---|---|---|
| Comparison with Poisson distribution Blue bars denote a histogram of data divided into 1 sec bins. Red curve is a Poisson curve with rate = median count rate of data. |
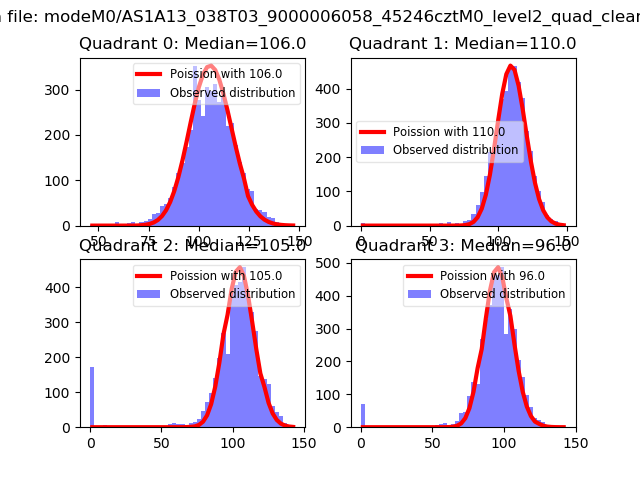 |
 |
| Quadrant-wise count rates Data is divided into 100 sec bins |
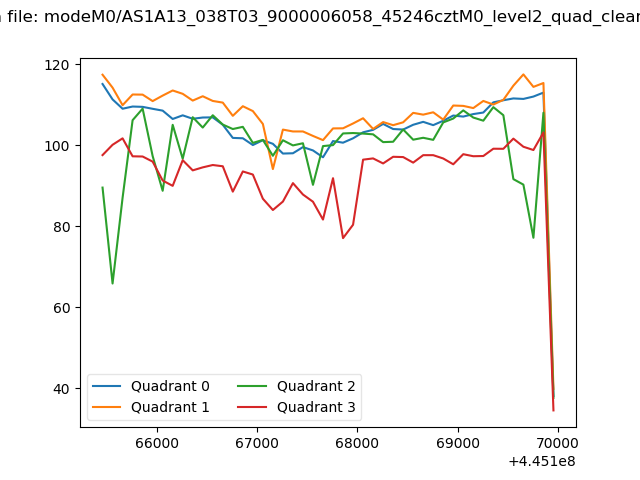 |
|
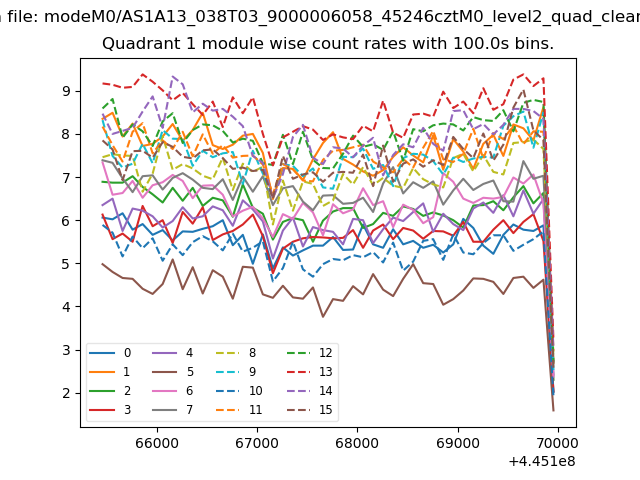
| Module-wise count rates for Quadrant A Data is divided into 100 sec bins |
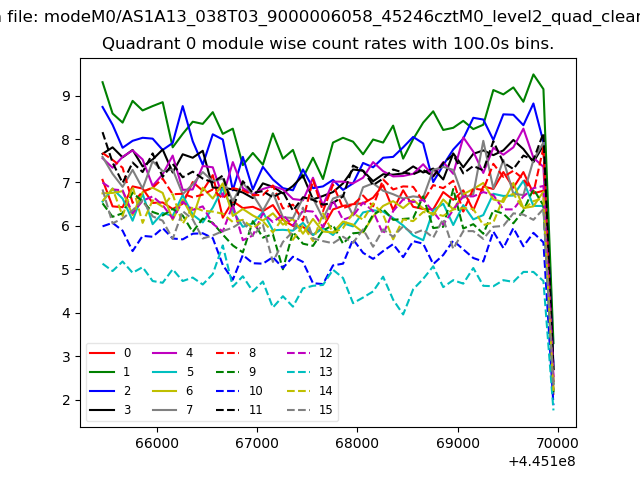 |
 |
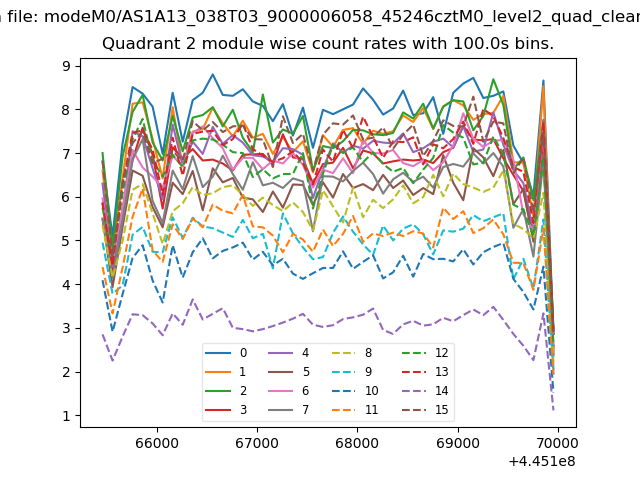
| Module-wise count rates for Quadrant B Data is divided into 100 sec bins |
 |
 |
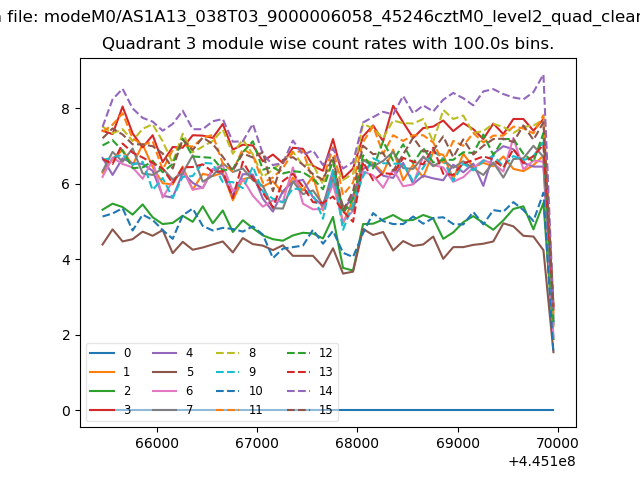
| Module-wise count rates for Quadrant C Data is divided into 100 sec bins |
 |
 |
| Module-wise count rates for Quadrant D Data is divided into 100 sec bins |
 |
 |
| Parameter | Plot |
|---|---|
| CZT HV Monitor | 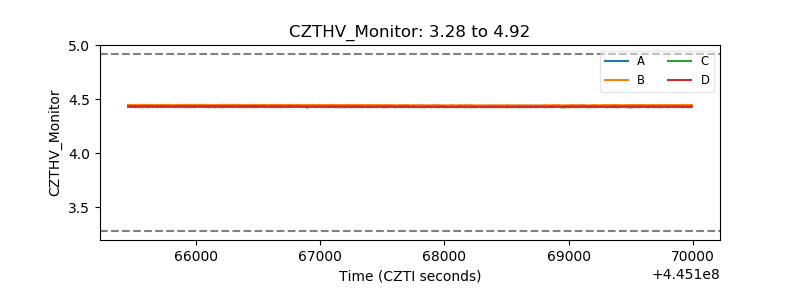 |
| D_VDD | 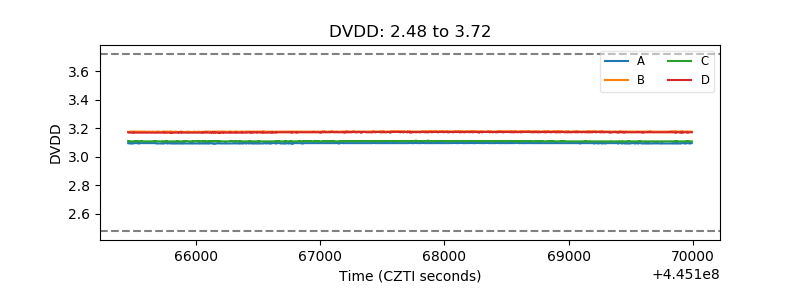 |
| Temperature 1 | 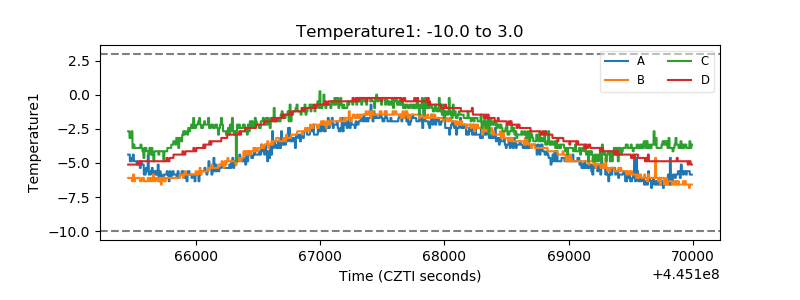 |
| Veto HV Monitor | 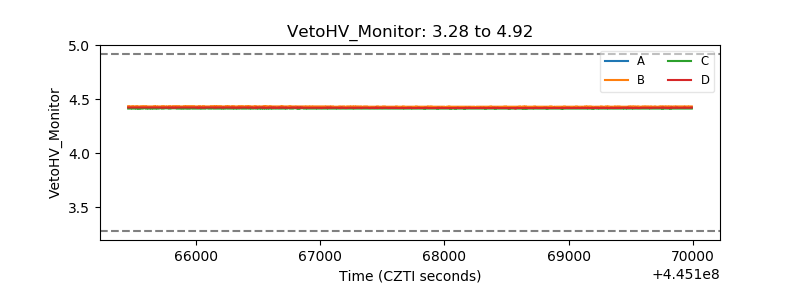 |
| Veto LLD | 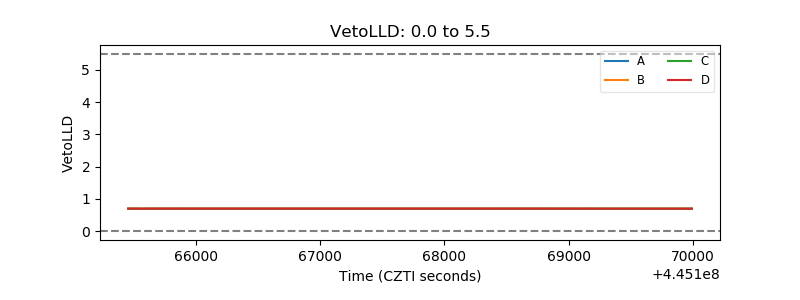 |
| Alpha Counter | 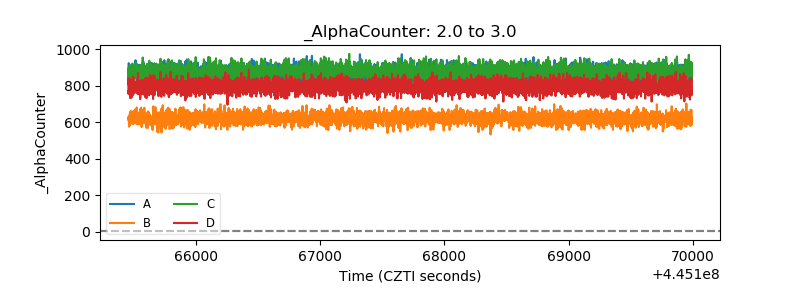 |
| _CPM_Rate | 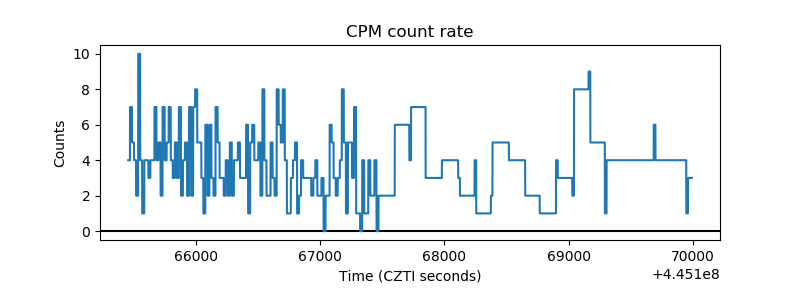 |
| CZT Counter | 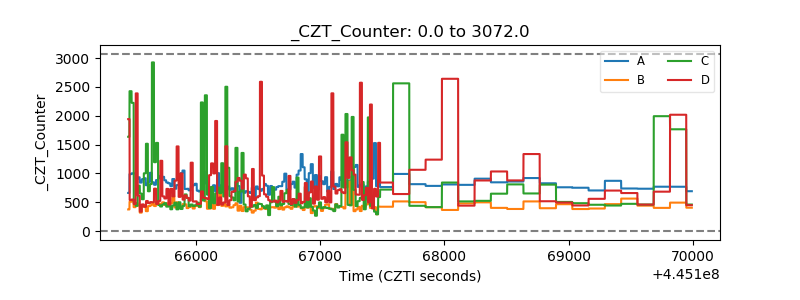 |
| +2.5 Volts monitor | 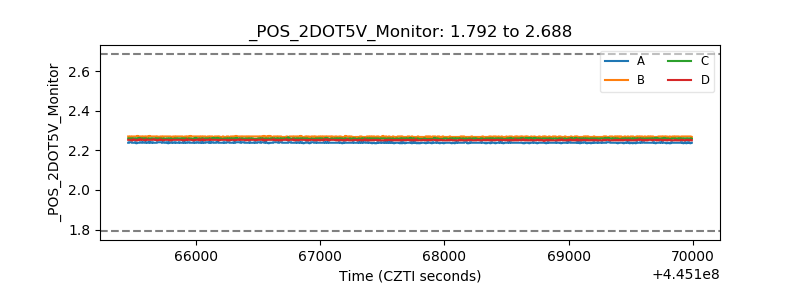 |
| +5 Volts monitor | 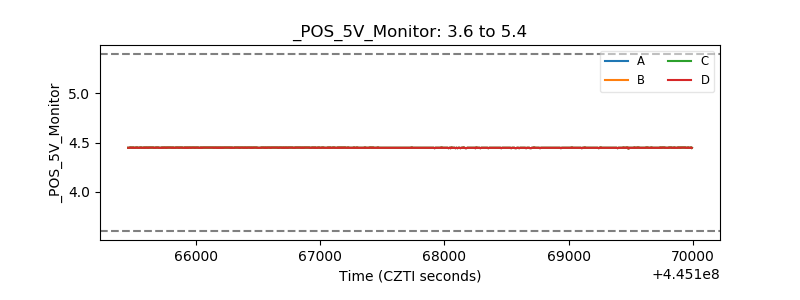 |
| _ROLL_ROT | 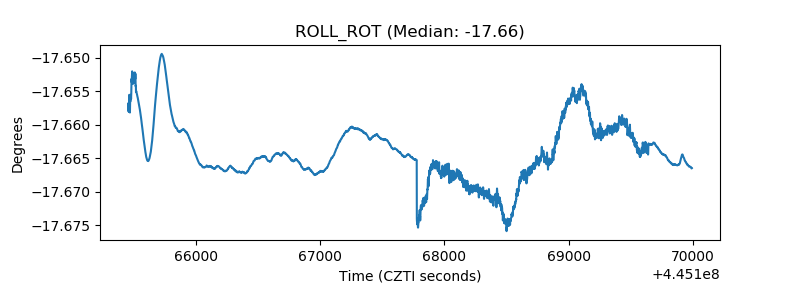 |
| _Roll_DEC | 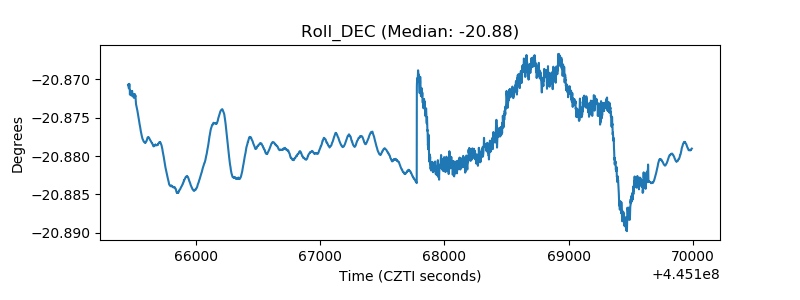 |
| _Roll_RA | 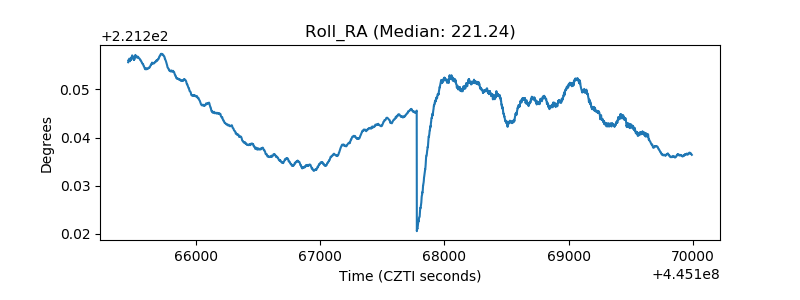 |
| Veto Counter | 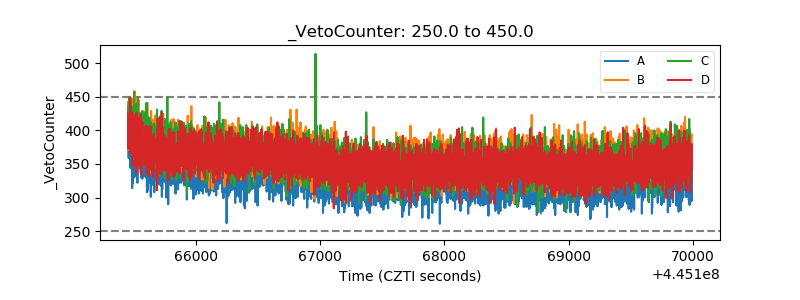 |