| Param | Original file | Final file |
|---|---|---|
| Filename | modeM0/AS1A13_038T03_9000006058_45414cztM0_level2.fits | modeM0/AS1A13_038T03_9000006058_45414cztM0_level2_quad_clean.evt |
| Size (bytes) | 438,272,640 | 89,732,160 |
| Size | 418.0 MB | 85.6 MB |
| Events in quadrant A | 4,744,516 | 606,635 |
| Events in quadrant B | 3,665,726 | 608,555 |
| Events in quadrant C | 2,630,783 | 609,396 |
| Events in quadrant D | 4,760,095 | 511,671 |
| Mode M0 | |||
|---|---|---|---|
| Quadrant | BADHDUFLAG | Total packets | Discarded packets |
| A | 0 | 18055 | 1 |
| B | 0 | 14590 | 1 |
| C | 0 | 11679 | 1 |
| D | 0 | 17810 | 1 |
| Mode M9 | |||
|---|---|---|---|
| Quadrant | BADHDUFLAG | Total packets | Discarded packets |
| A | 0 | 11 | 0 |
| B | 0 | 11 | 0 |
| C | 0 | 11 | 0 |
| D | 0 | 11 | 0 |
| Mode SS | |||
|---|---|---|---|
| Quadrant | BADHDUFLAG | Total packets | Discarded packets |
| A | 0 | 112 | 0 |
| B | 0 | 112 | 0 |
| C | 0 | 112 | 0 |
| D | 0 | 112 | 0 |
| Quadrant | Total seconds | Saturated seconds | Saturation percentage |
|---|---|---|---|
| A | 5435 | 209 | 3.845446% |
| B | 5435 | 400 | 7.359706% |
| C | 5435 | 66 | 1.214351% |
| D | 5435 | 585 | 10.763569% |
Noise dominated data is calculated using 1-second bins in cleaned event files. If a bin has >2000 counts, and if more than 50% of those come from <1% of pixels, then it is considered to be noise-dominated and hence unusable.
| Quadrant | # 1 sec bins | Bins with >0 counts | Bins with >2000 counts | High rate bins dominated by noise | Noise dominated (total time) | Noise dominated (detector-on time) | Marked lightcurve |
|---|---|---|---|---|---|---|---|
| A | 6560 | 5435 | 65 | 65 | 0.99% | 1.20% | 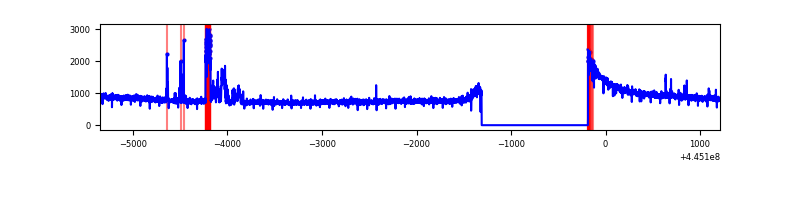 |
| B | 6560 | 5435 | 225 | 225 | 3.43% | 4.14% | 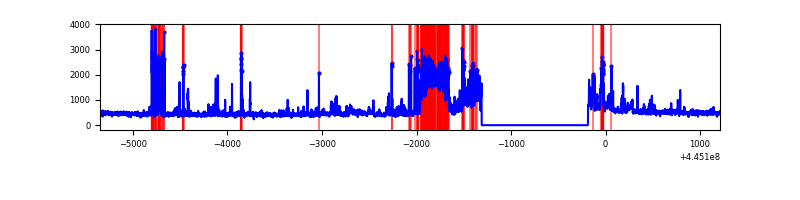 |
| C | 6560 | 5435 | 22 | 22 | 0.34% | 0.40% | 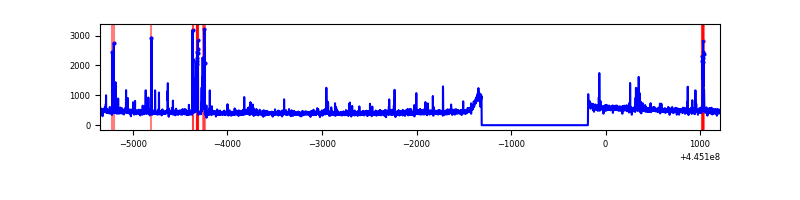 |
| D | 6560 | 5435 | 551 | 551 | 8.40% | 10.14% | 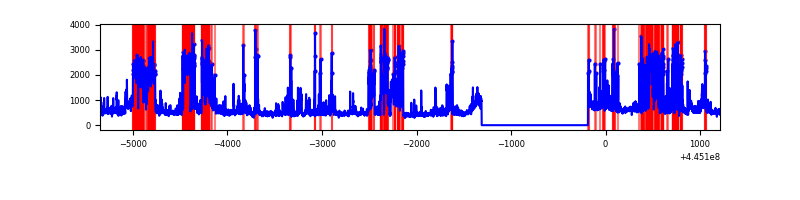 |
Top three noisy pixels from each quadrant. If the there are fewer than three noisy pixels in the level2.evt file, extra rows are filled as -1
| Pixel properties | Quadrant properties | ||||||
|---|---|---|---|---|---|---|---|
| Quadrant | DetID | PixID | Counts | Sigma | Mean | Median | Sigma |
| A | 10 | 83 | 2100123 | 16218.48 | 622 | 609 | 129.5 |
| A | 9 | 191 | 218140 | 1680.4 | 622 | 609 | 129.5 |
| A | 13 | 248 | 10448 | 76.01 | 622 | 609 | 129.5 |
| B | 4 | 170 | 605784 | 5019.88 | 615 | 598 | 120.6 |
| B | 15 | 201 | 496083 | 4109.94 | 615 | 598 | 120.6 |
| B | 0 | 171 | 56837 | 466.49 | 615 | 598 | 120.6 |
| C | 14 | 254 | 123290 | 836.62 | 620 | 625 | 146.6 |
| C | 0 | 239 | 43228 | 290.57 | 620 | 625 | 146.6 |
| C | 11 | 16 | 19143 | 126.3 | 620 | 625 | 146.6 |
| D | 11 | 176 | 1207991 | 8086.34 | 597 | 580 | 149.3 |
| D | 13 | 249 | 535598 | 3583.15 | 597 | 580 | 149.3 |
| D | 11 | 241 | 247922 | 1656.51 | 597 | 580 | 149.3 |
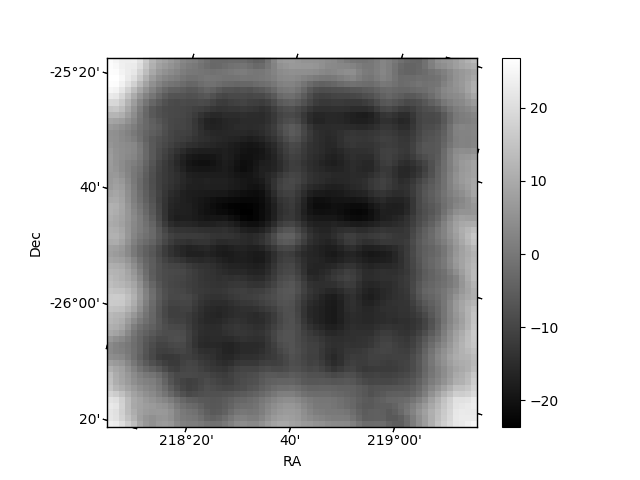
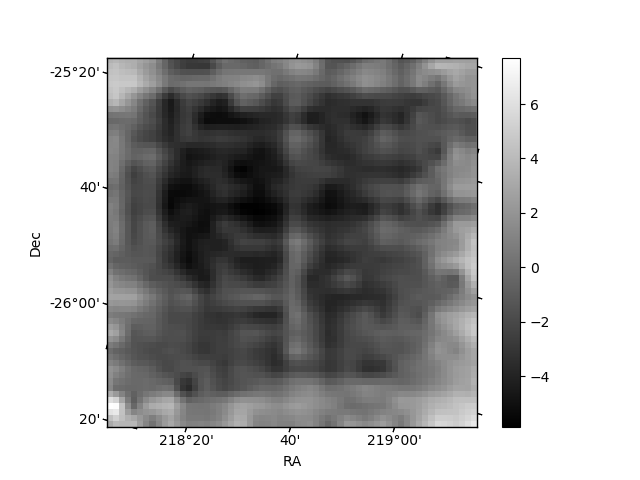
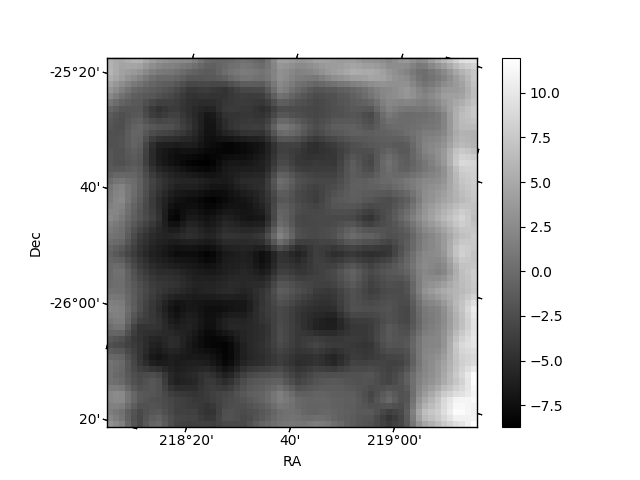
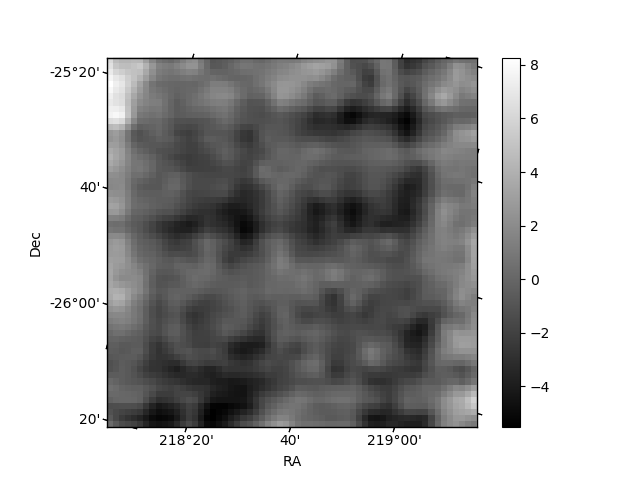
Histogram calculated using DETX and DETY for each event in the final _common_clean file
| Quadrant A | 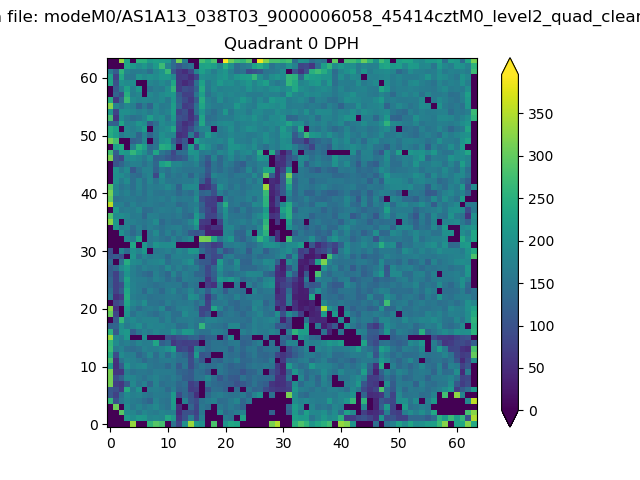 |
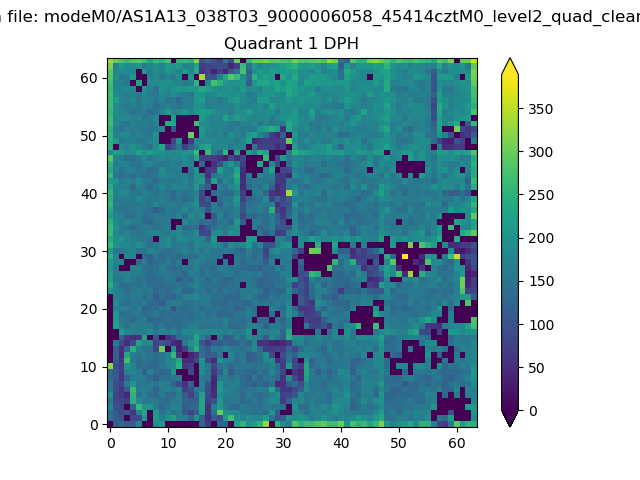 |
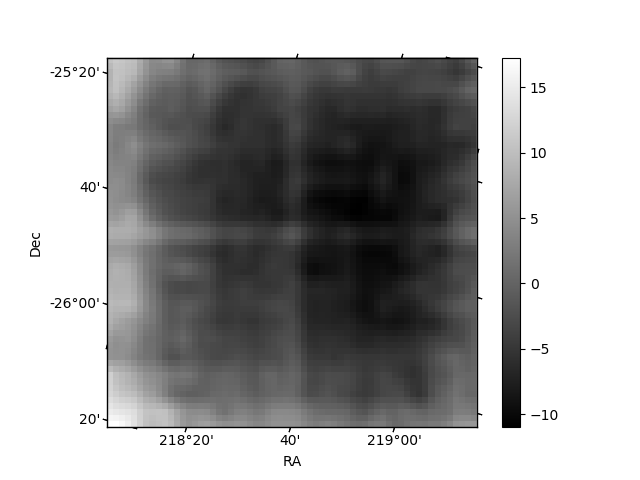
Quadrant B |
|---|---|---|---|
| Quadrant D | 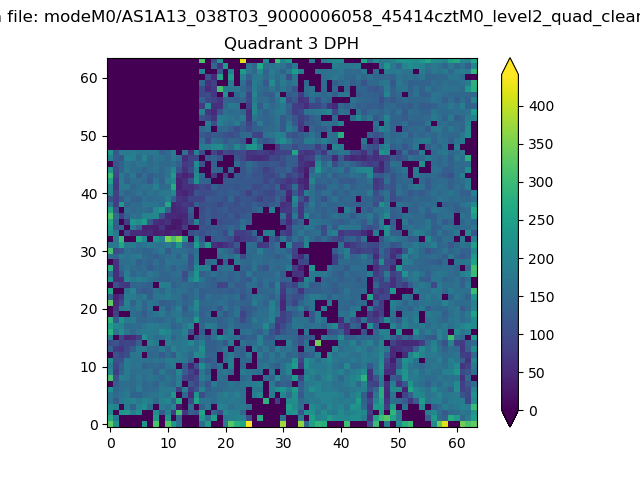 |
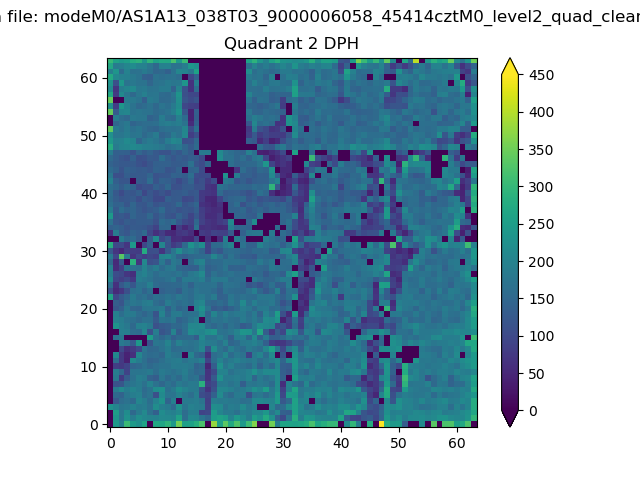 |
Quadrant C |
| Plot type | Count rate plots | Images |
|---|---|---|
| Comparison with Poisson distribution Blue bars denote a histogram of data divided into 1 sec bins. Red curve is a Poisson curve with rate = median count rate of data. |
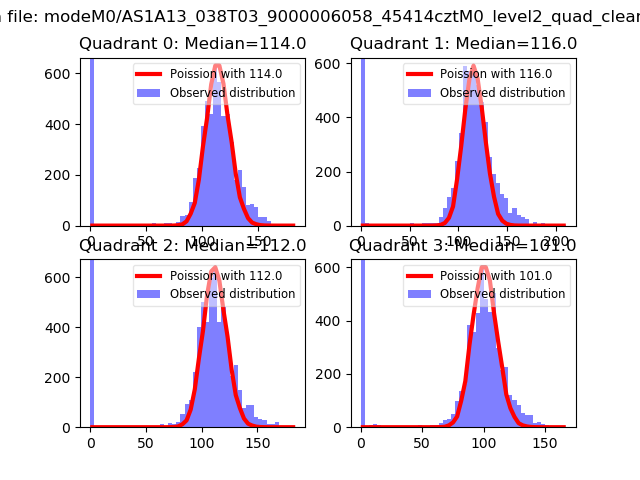 |
 |
| Quadrant-wise count rates Data is divided into 100 sec bins |
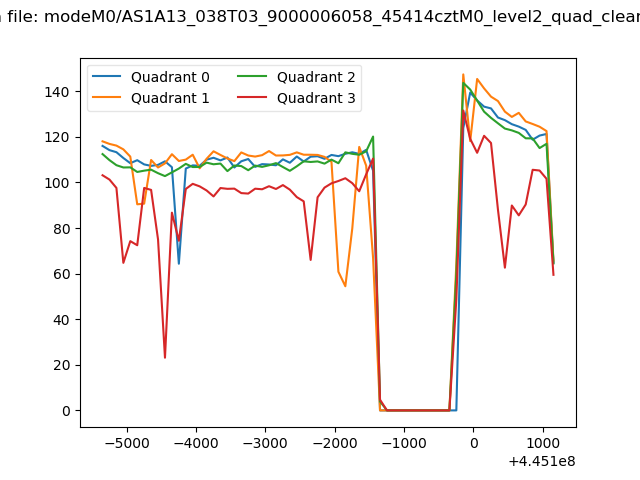 |
|
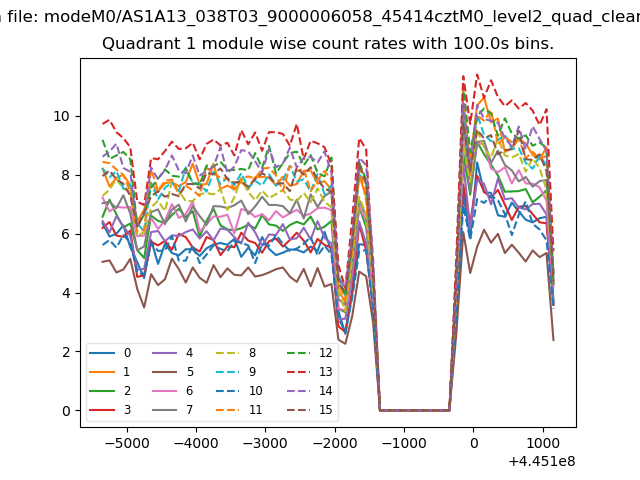
| Module-wise count rates for Quadrant A Data is divided into 100 sec bins |
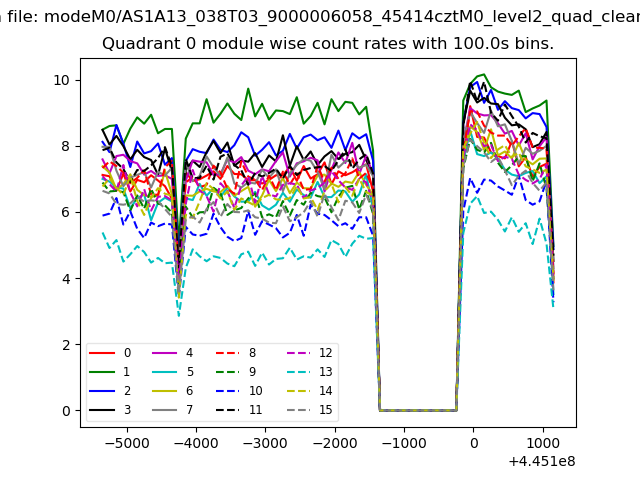 |
 |
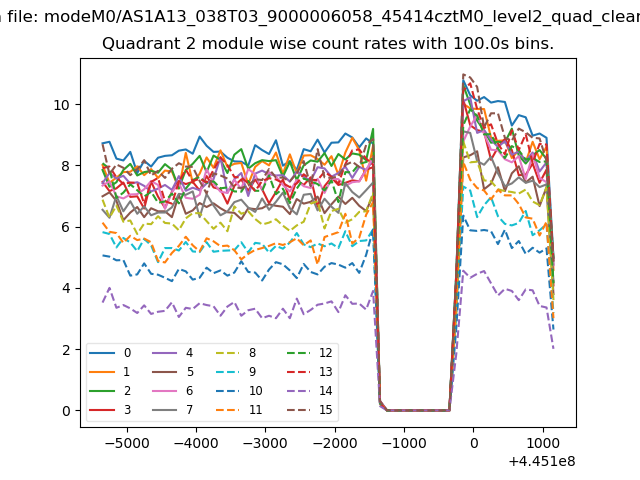
| Module-wise count rates for Quadrant B Data is divided into 100 sec bins |
 |
 |
| Module-wise count rates for Quadrant C Data is divided into 100 sec bins |
 |
 |
| Module-wise count rates for Quadrant D Data is divided into 100 sec bins |
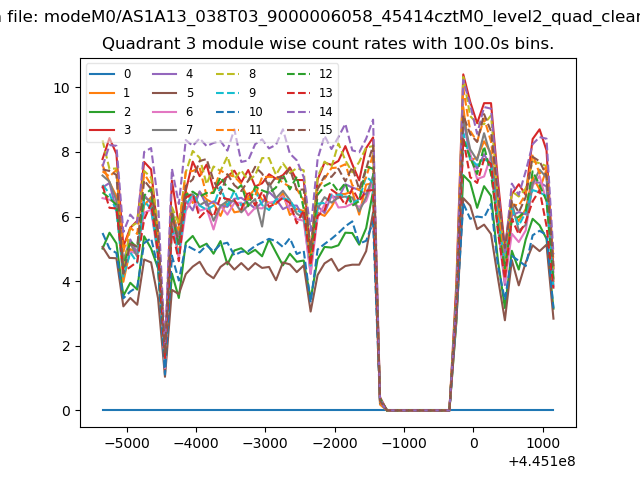 |
 |
| Parameter | Plot |
|---|---|
| CZT HV Monitor | 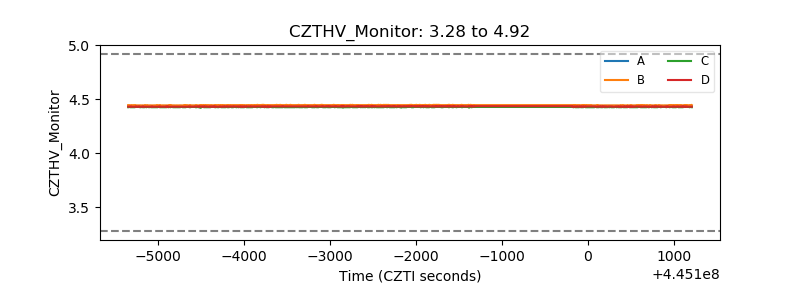 |
| D_VDD | 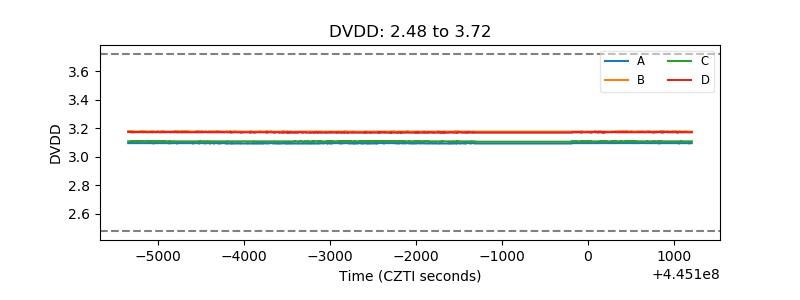 |
| Temperature 1 | 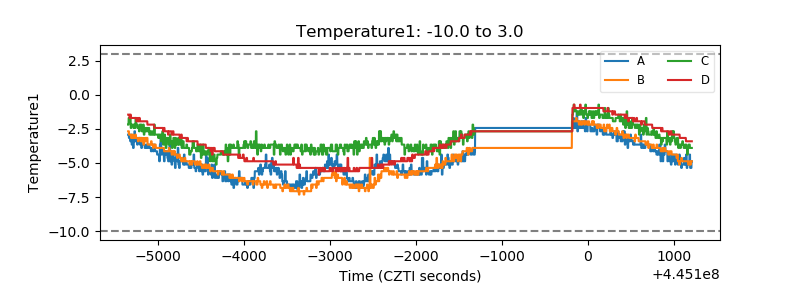 |
| Veto HV Monitor |  |
| Veto LLD | 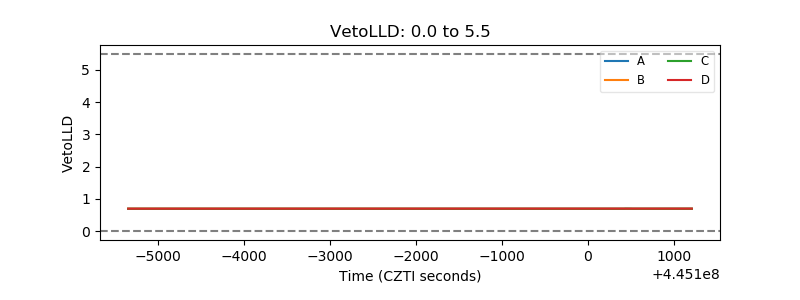 |
| Alpha Counter | 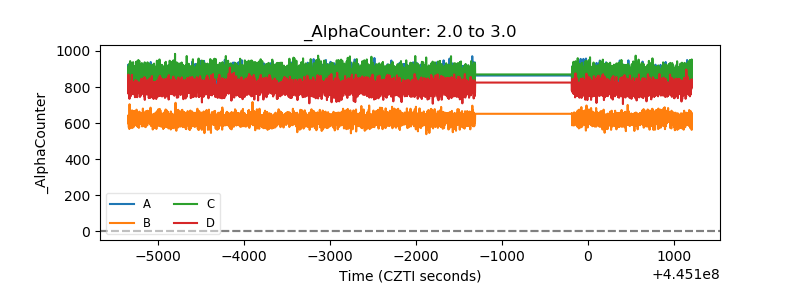 |
| _CPM_Rate | 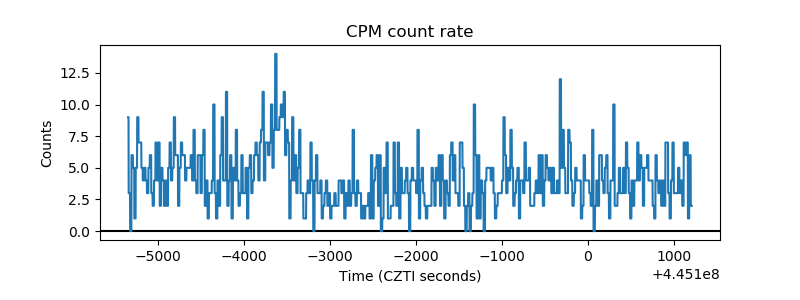 |
| CZT Counter | 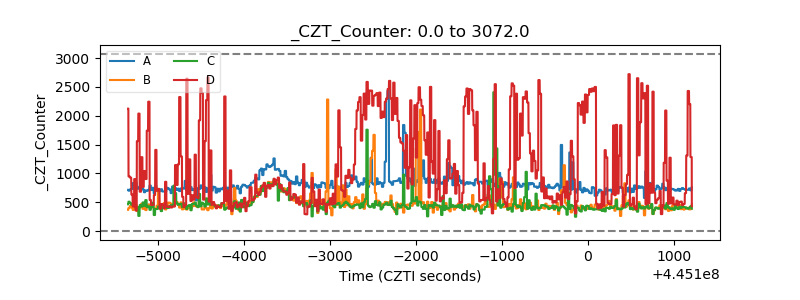 |
| +2.5 Volts monitor | 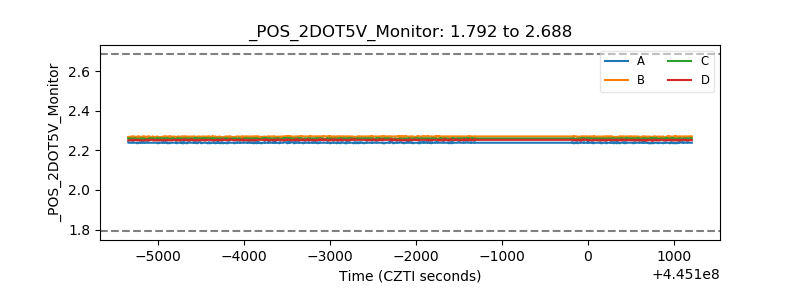 |
| +5 Volts monitor | 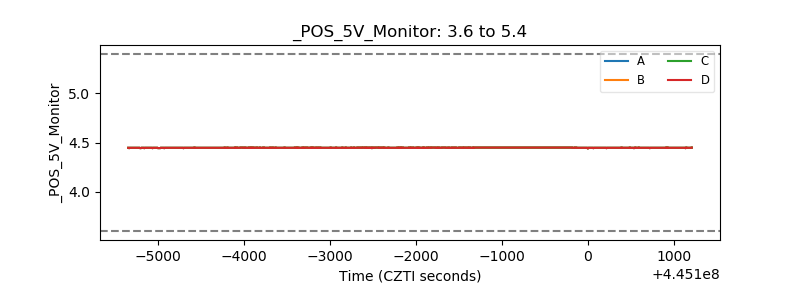 |
| _ROLL_ROT | 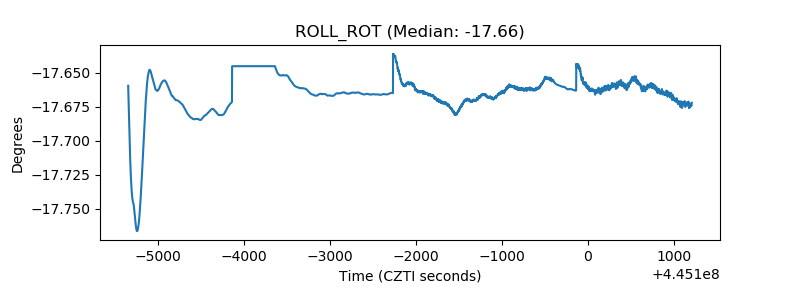 |
| _Roll_DEC | 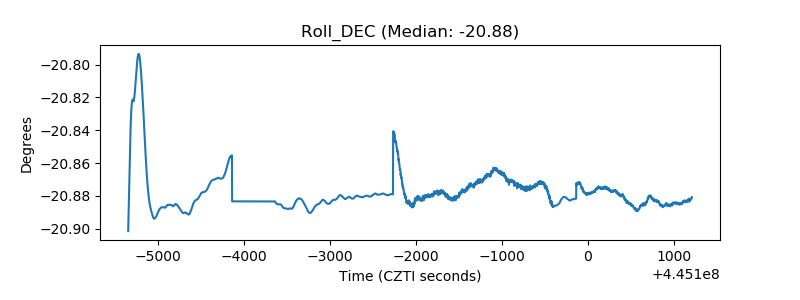 |
| _Roll_RA | 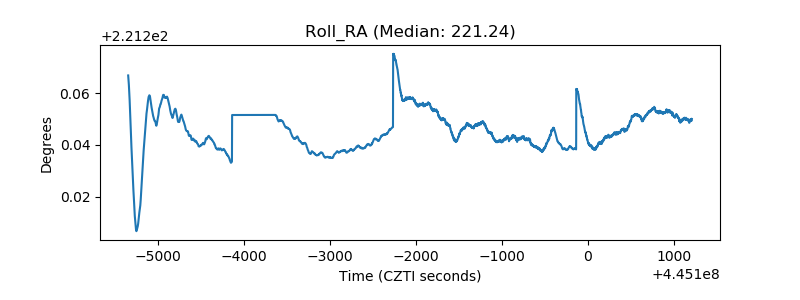 |
| Veto Counter | 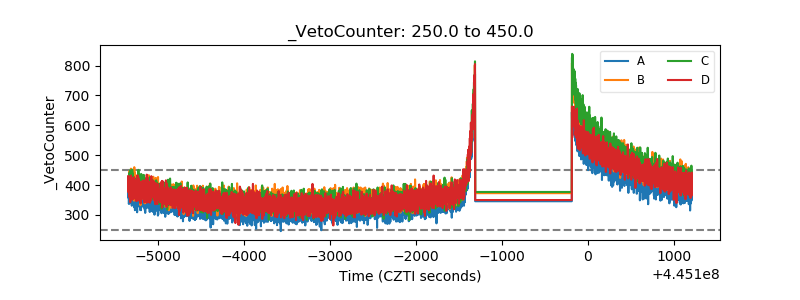 |