| Param | Original file | Final file |
|---|---|---|
| Filename | modeM0/AS1A13_038T03_9000006058_45415cztM0_level2.fits | modeM0/AS1A13_038T03_9000006058_45415cztM0_level2_quad_clean.evt |
| Size (bytes) | 497,897,280 | 110,805,120 |
| Size | 474.8 MB | 105.7 MB |
| Events in quadrant A | 6,531,118 | 683,847 |
| Events in quadrant B | 3,789,393 | 788,378 |
| Events in quadrant C | 3,101,097 | 762,975 |
| Events in quadrant D | 4,513,364 | 674,540 |
| Mode M0 | |||
|---|---|---|---|
| Quadrant | BADHDUFLAG | Total packets | Discarded packets |
| A | 0 | 24127 | 2 |
| B | 0 | 15432 | 2 |
| C | 0 | 13570 | 2 |
| D | 0 | 17847 | 2 |
| Mode M9 | |||
|---|---|---|---|
| Quadrant | BADHDUFLAG | Total packets | Discarded packets |
| A | 0 | 19 | 0 |
| B | 0 | 20 | 0 |
| C | 0 | 20 | 0 |
| D | 0 | 20 | 0 |
| Mode SS | |||
|---|---|---|---|
| Quadrant | BADHDUFLAG | Total packets | Discarded packets |
| A | 0 | 130 | 0 |
| B | 0 | 130 | 0 |
| C | 0 | 130 | 0 |
| D | 0 | 130 | 0 |
| Quadrant | Total seconds | Saturated seconds | Saturation percentage |
|---|---|---|---|
| A | 6385 | 747 | 11.699295% |
| B | 6385 | 185 | 2.897416% |
| C | 6385 | 29 | 0.454190% |
| D | 6385 | 285 | 4.463587% |
Noise dominated data is calculated using 1-second bins in cleaned event files. If a bin has >2000 counts, and if more than 50% of those come from <1% of pixels, then it is considered to be noise-dominated and hence unusable.
| Quadrant | # 1 sec bins | Bins with >0 counts | Bins with >2000 counts | High rate bins dominated by noise | Noise dominated (total time) | Noise dominated (detector-on time) | Marked lightcurve |
|---|---|---|---|---|---|---|---|
| A | 7600 | 6386 | 553 | 553 | 7.28% | 8.66% | 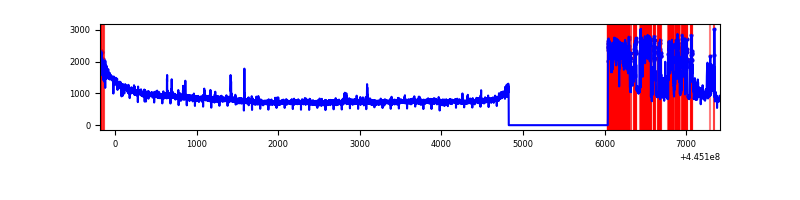 |
| B | 7600 | 6386 | 103 | 103 | 1.36% | 1.61% | 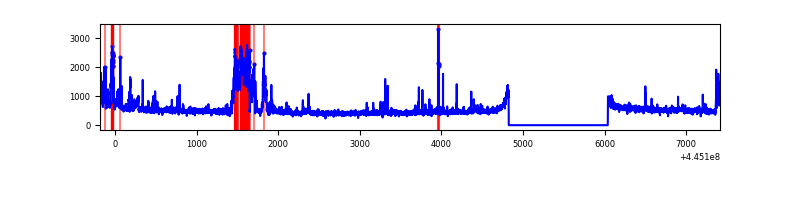 |
| C | 7600 | 6386 | 9 | 9 | 0.12% | 0.14% | 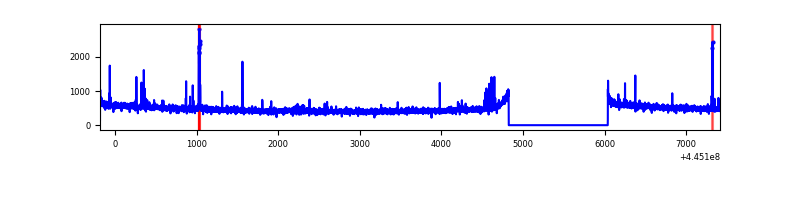 |
| D | 7600 | 6386 | 225 | 225 | 2.96% | 3.52% | 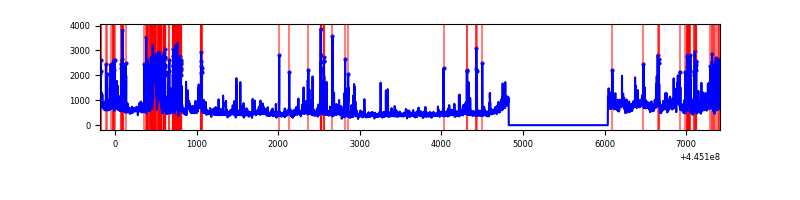 |
Top three noisy pixels from each quadrant. If the there are fewer than three noisy pixels in the level2.evt file, extra rows are filled as -1
| Pixel properties | Quadrant properties | ||||||
|---|---|---|---|---|---|---|---|
| Quadrant | DetID | PixID | Counts | Sigma | Mean | Median | Sigma |
| A | 10 | 83 | 2472295 | 16517.8 | 726 | 710 | 149.6 |
| A | 9 | 191 | 1216036 | 8122.12 | 726 | 710 | 149.6 |
| A | 2 | 79 | 25412 | 165.09 | 726 | 710 | 149.6 |
| B | 15 | 201 | 625598 | 4180.3 | 765 | 743 | 149.5 |
| B | 0 | 171 | 50262 | 331.28 | 765 | 743 | 149.5 |
| B | 15 | 36 | 35445 | 232.16 | 765 | 743 | 149.5 |
| C | 14 | 254 | 46070 | 252.44 | 763 | 769 | 179.5 |
| C | 14 | 96 | 32942 | 179.28 | 763 | 769 | 179.5 |
| C | 3 | 233 | 22978 | 123.76 | 763 | 769 | 179.5 |
| D | 13 | 249 | 709517 | 3848.41 | 744 | 722 | 184.2 |
| D | 11 | 241 | 388826 | 2107.22 | 744 | 722 | 184.2 |
| D | 2 | 249 | 211124 | 1142.38 | 744 | 722 | 184.2 |
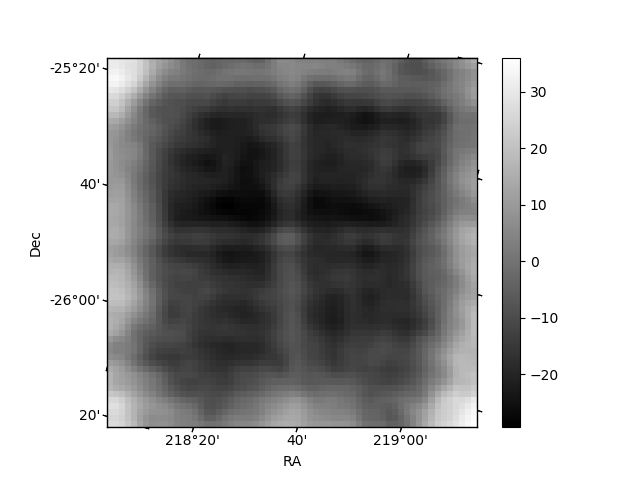
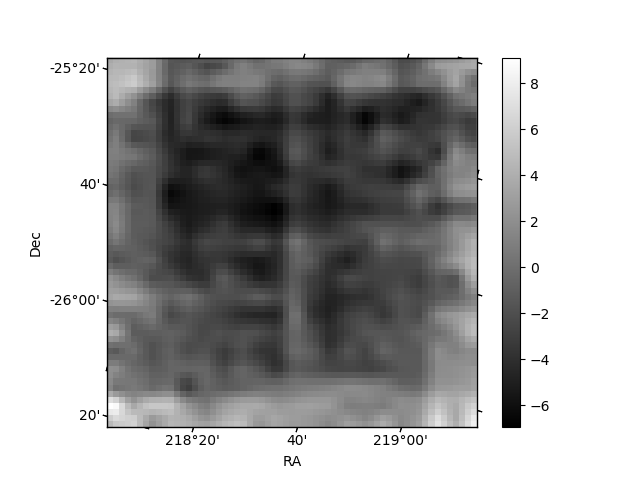
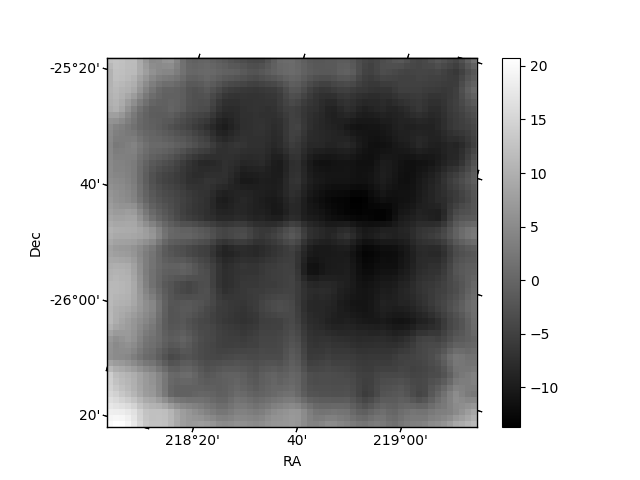
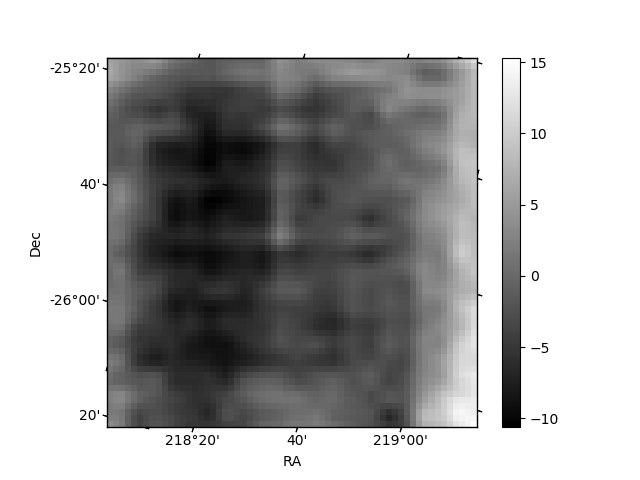
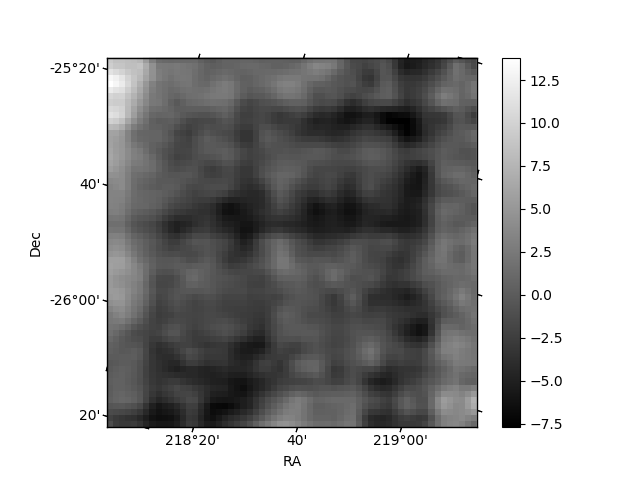
Histogram calculated using DETX and DETY for each event in the final _common_clean file
| Quadrant A | 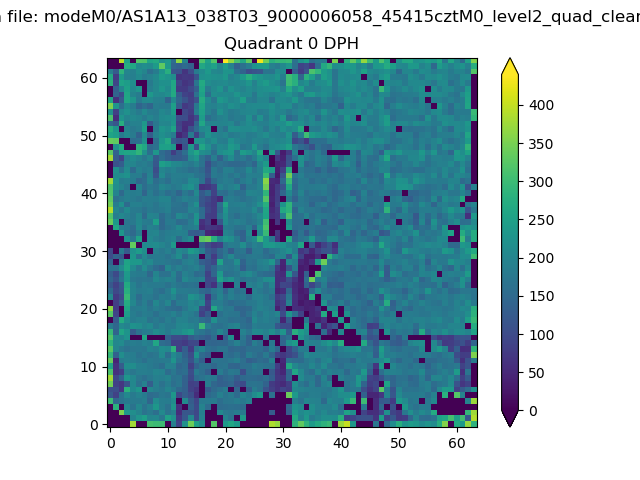 |
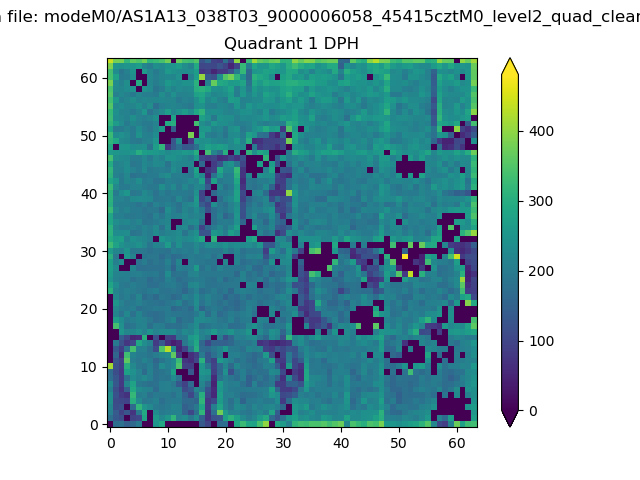 |
Quadrant B |
|---|---|---|---|
| Quadrant D | 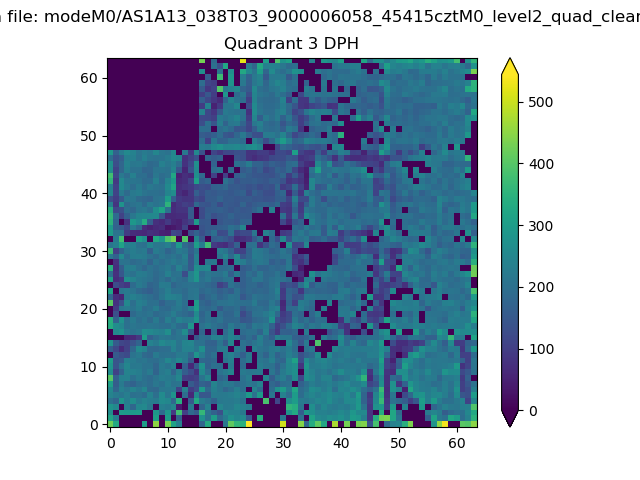 |
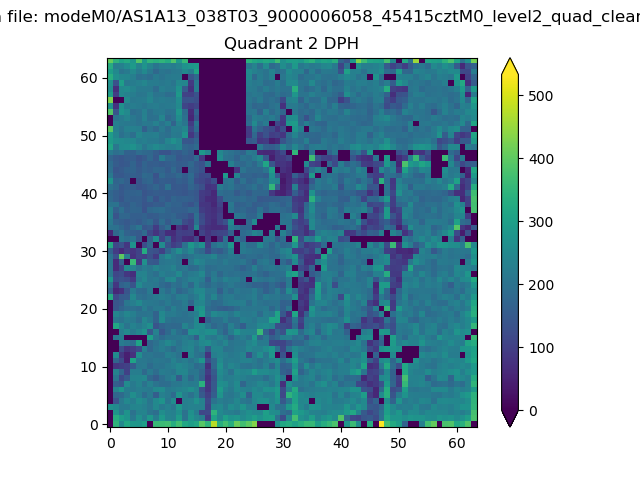 |
Quadrant C |
| Plot type | Count rate plots | Images |
|---|---|---|
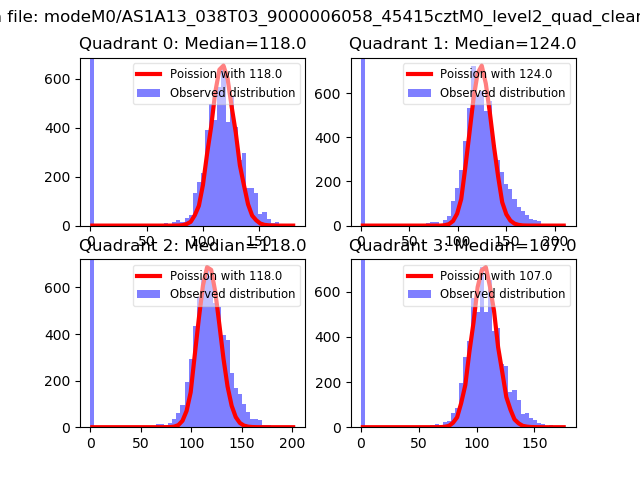
| Comparison with Poisson distribution Blue bars denote a histogram of data divided into 1 sec bins. Red curve is a Poisson curve with rate = median count rate of data. |
 |
 |
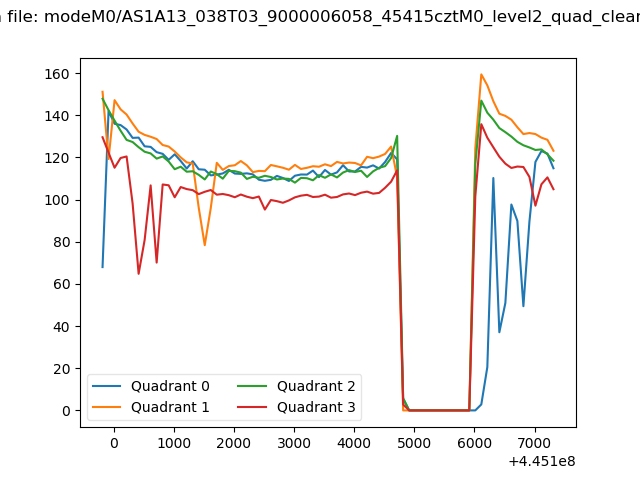
| Quadrant-wise count rates Data is divided into 100 sec bins |
 |
|
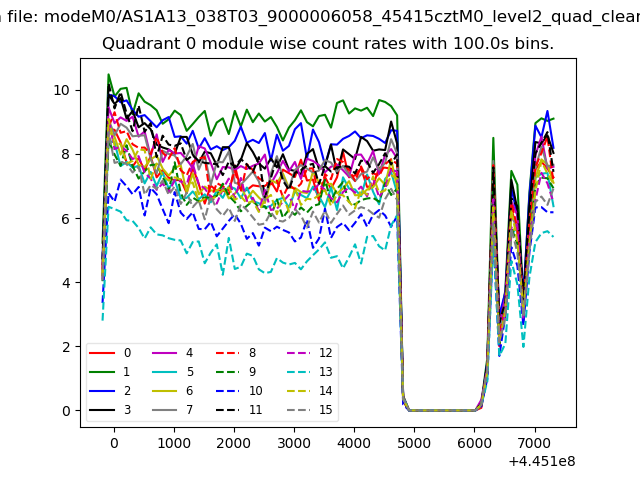
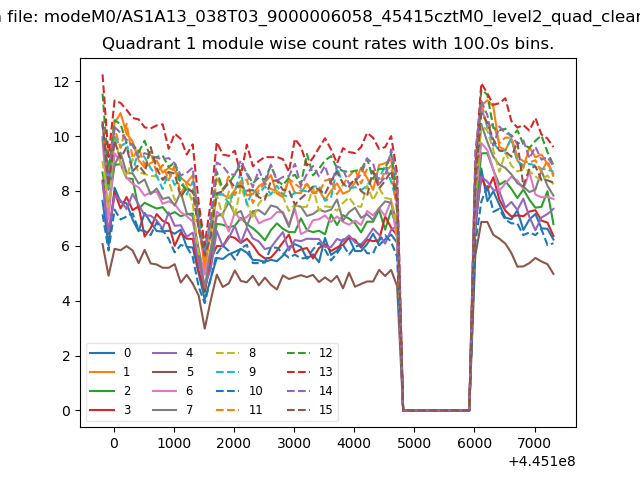
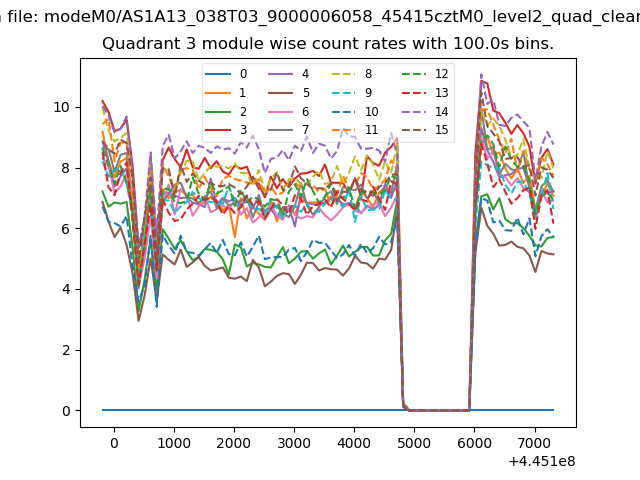
| Module-wise count rates for Quadrant A Data is divided into 100 sec bins |
 |
 |
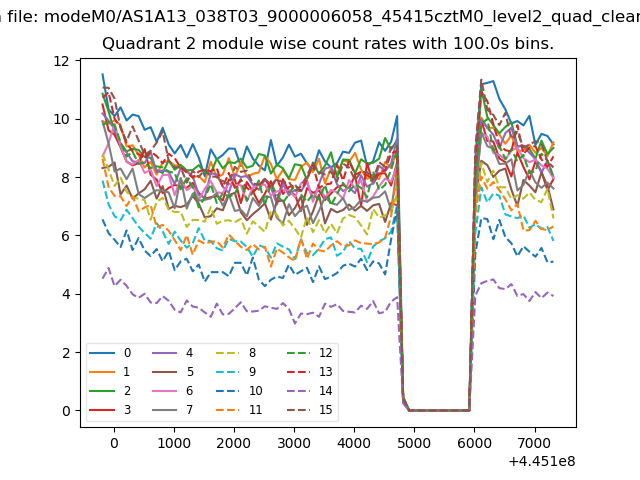
| Module-wise count rates for Quadrant B Data is divided into 100 sec bins |
 |
 |
| Module-wise count rates for Quadrant C Data is divided into 100 sec bins |
 |
 |
| Module-wise count rates for Quadrant D Data is divided into 100 sec bins |
 |
 |
| Parameter | Plot |
|---|---|
| CZT HV Monitor | 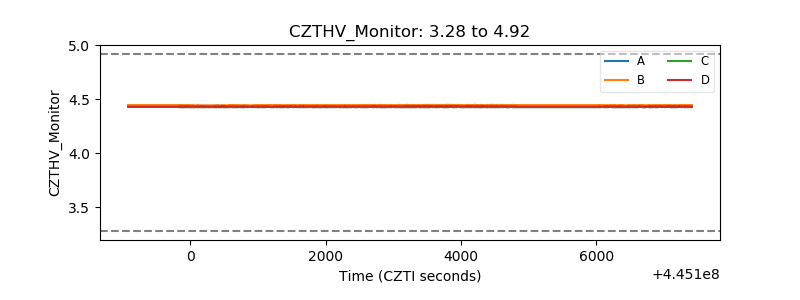 |
| D_VDD | 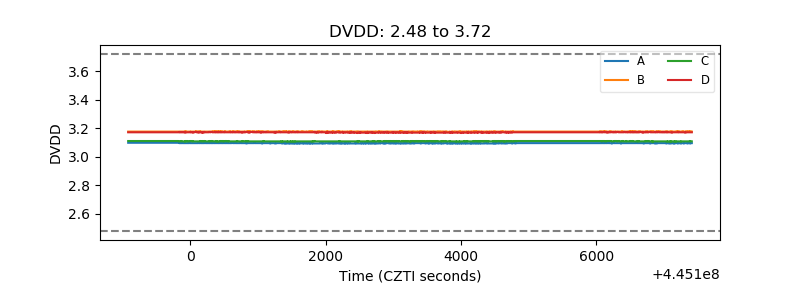 |
| Temperature 1 | 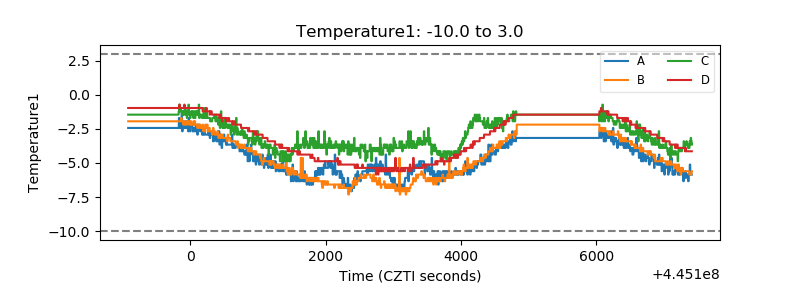 |
| Veto HV Monitor | 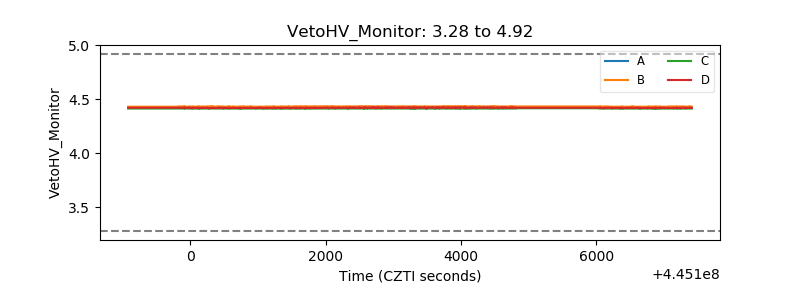 |
| Veto LLD | 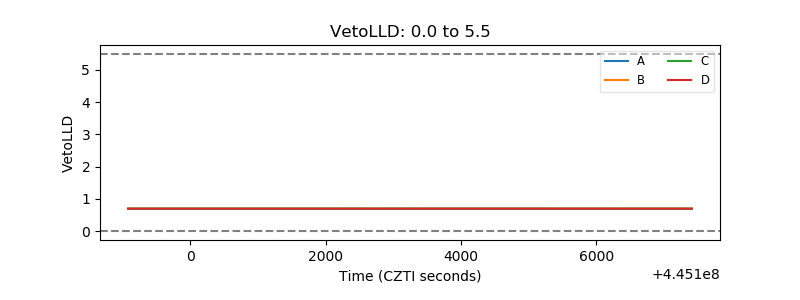 |
| Alpha Counter | 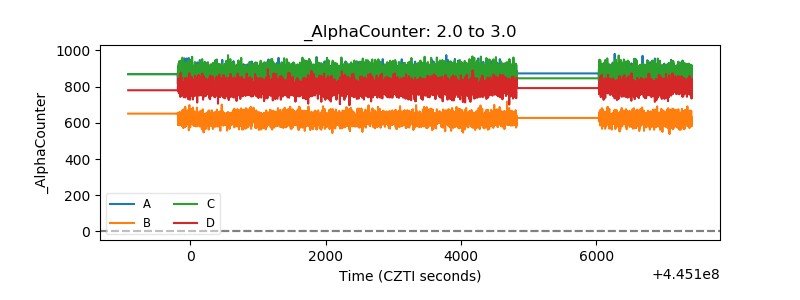 |
| _CPM_Rate | 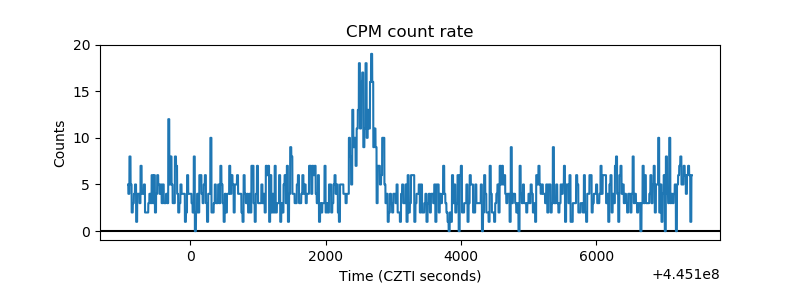 |
| CZT Counter | 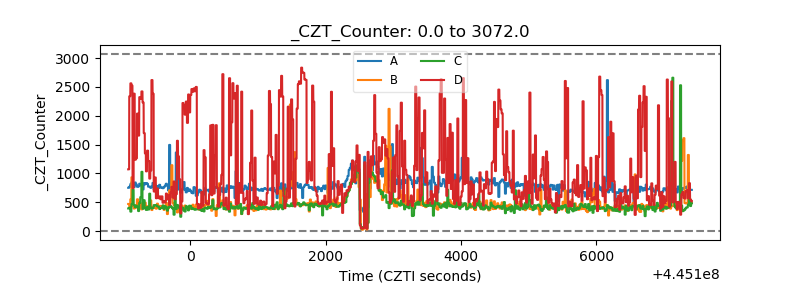 |
| +2.5 Volts monitor | 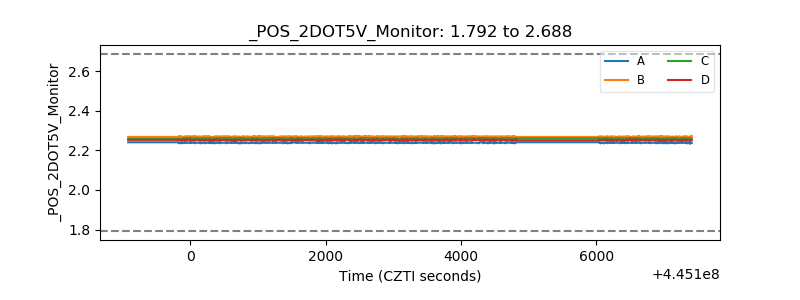 |
| +5 Volts monitor | 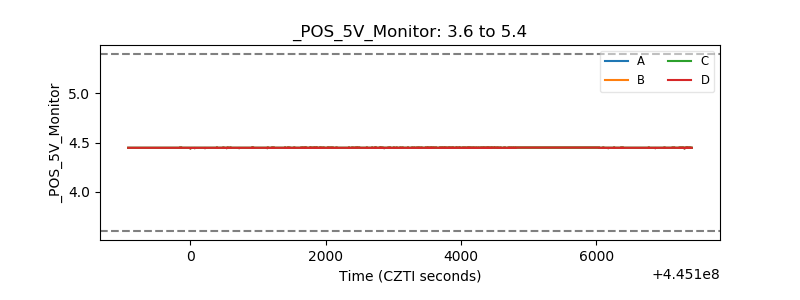 |
| _ROLL_ROT | 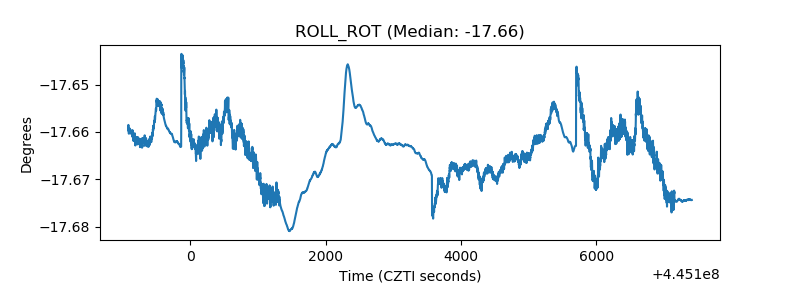 |
| _Roll_DEC | 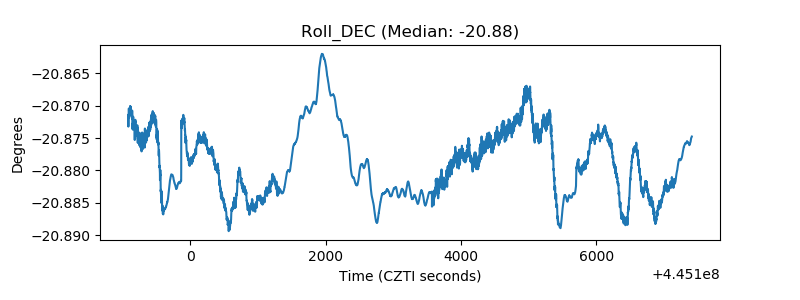 |
| _Roll_RA | 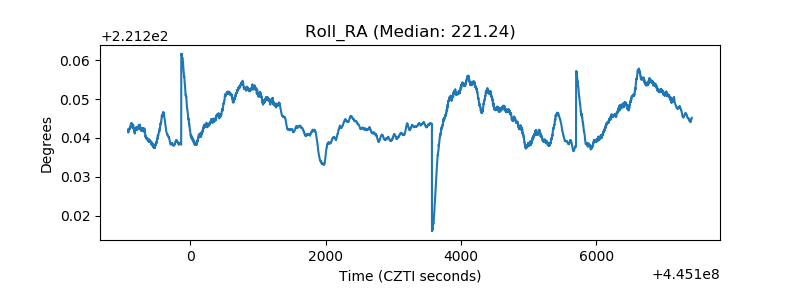 |
| Veto Counter | 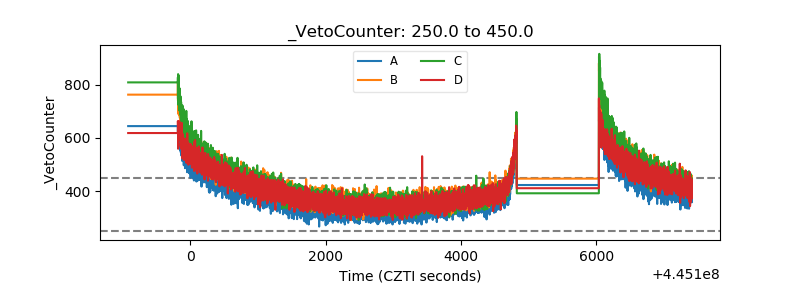 |