| Param | Original file | Final file |
|---|---|---|
| Filename | modeM0/AS1A13_038T03_9000006058_45417cztM0_level2.fits | modeM0/AS1A13_038T03_9000006058_45417cztM0_level2_quad_clean.evt |
| Size (bytes) | 500,866,560 | 108,829,440 |
| Size | 477.7 MB | 103.8 MB |
| Events in quadrant A | 7,546,030 | 644,629 |
| Events in quadrant B | 3,221,468 | 786,139 |
| Events in quadrant C | 3,115,731 | 752,762 |
| Events in quadrant D | 4,160,231 | 665,437 |
| Mode M0 | |||
|---|---|---|---|
| Quadrant | BADHDUFLAG | Total packets | Discarded packets |
| A | 0 | 27194 | 2 |
| B | 0 | 13902 | 2 |
| C | 0 | 13731 | 2 |
| D | 0 | 16859 | 2 |
| Mode M9 | |||
|---|---|---|---|
| Quadrant | BADHDUFLAG | Total packets | Discarded packets |
| A | 0 | 12 | 0 |
| B | 0 | 13 | 0 |
| C | 0 | 13 | 0 |
| D | 0 | 13 | 0 |
| Mode SS | |||
|---|---|---|---|
| Quadrant | BADHDUFLAG | Total packets | Discarded packets |
| A | 0 | 130 | 0 |
| B | 0 | 130 | 0 |
| C | 0 | 130 | 0 |
| D | 0 | 130 | 0 |
| Quadrant | Total seconds | Saturated seconds | Saturation percentage |
|---|---|---|---|
| A | 6400 | 1092 | 17.062500% |
| B | 6400 | 68 | 1.062500% |
| C | 6400 | 45 | 0.703125% |
| D | 6400 | 197 | 3.078125% |
Noise dominated data is calculated using 1-second bins in cleaned event files. If a bin has >2000 counts, and if more than 50% of those come from <1% of pixels, then it is considered to be noise-dominated and hence unusable.
| Quadrant | # 1 sec bins | Bins with >0 counts | Bins with >2000 counts | High rate bins dominated by noise | Noise dominated (total time) | Noise dominated (detector-on time) | Marked lightcurve |
|---|---|---|---|---|---|---|---|
| A | 7620 | 6400 | 931 | 931 | 12.22% | 14.55% | 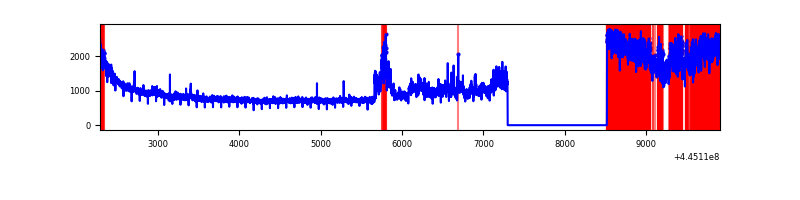 |
| B | 7620 | 6400 | 7 | 7 | 0.09% | 0.11% | 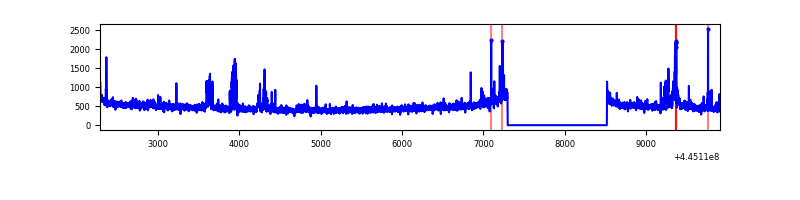 |
| C | 7620 | 6401 | 17 | 17 | 0.22% | 0.27% | 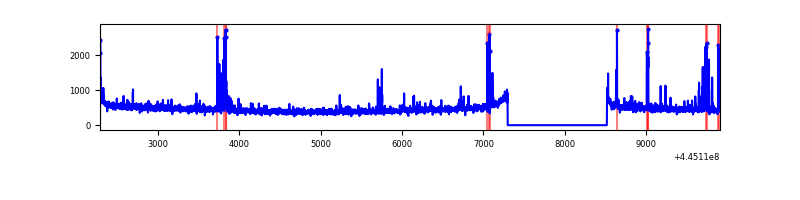 |
| D | 7620 | 6401 | 144 | 144 | 1.89% | 2.25% | 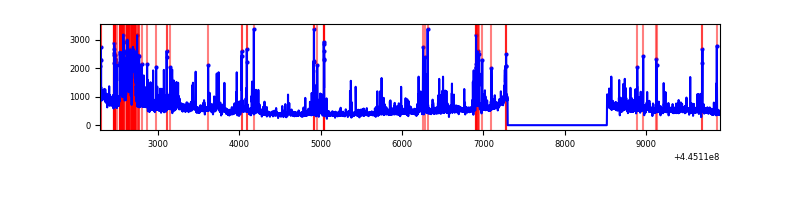 |
Top three noisy pixels from each quadrant. If the there are fewer than three noisy pixels in the level2.evt file, extra rows are filled as -1
| Pixel properties | Quadrant properties | ||||||
|---|---|---|---|---|---|---|---|
| Quadrant | DetID | PixID | Counts | Sigma | Mean | Median | Sigma |
| A | 9 | 191 | 2459140 | 17050.33 | 700 | 687 | 144.2 |
| A | 10 | 83 | 2374512 | 16463.4 | 700 | 687 | 144.2 |
| A | 3 | 137 | 7778 | 49.18 | 700 | 687 | 144.2 |
| B | 15 | 201 | 111915 | 755.2 | 752 | 730 | 147.2 |
| B | 0 | 171 | 54760 | 366.99 | 752 | 730 | 147.2 |
| B | 0 | 190 | 29564 | 195.85 | 752 | 730 | 147.2 |
| C | 14 | 254 | 114441 | 649.53 | 743 | 748 | 175.0 |
| C | 5 | 4 | 54578 | 307.53 | 743 | 748 | 175.0 |
| C | 0 | 207 | 14514 | 78.65 | 743 | 748 | 175.0 |
| D | 11 | 241 | 335662 | 1860.85 | 725 | 704 | 180.0 |
| D | 2 | 249 | 332628 | 1843.99 | 725 | 704 | 180.0 |
| D | 1 | 52 | 193455 | 1070.82 | 725 | 704 | 180.0 |
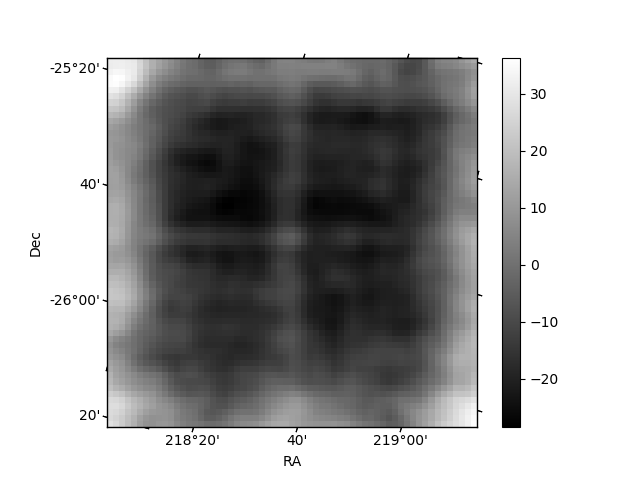
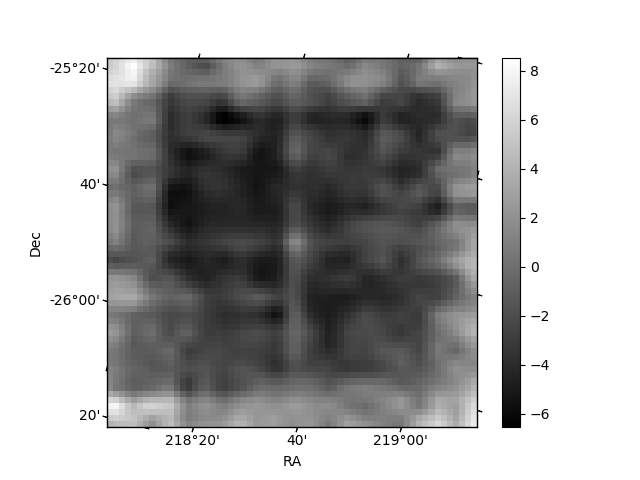
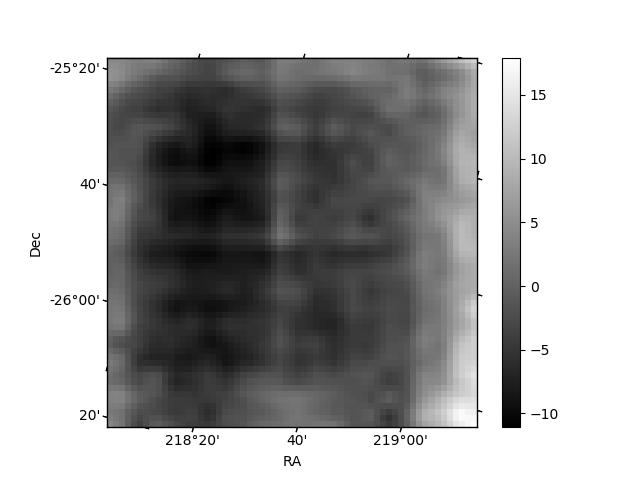
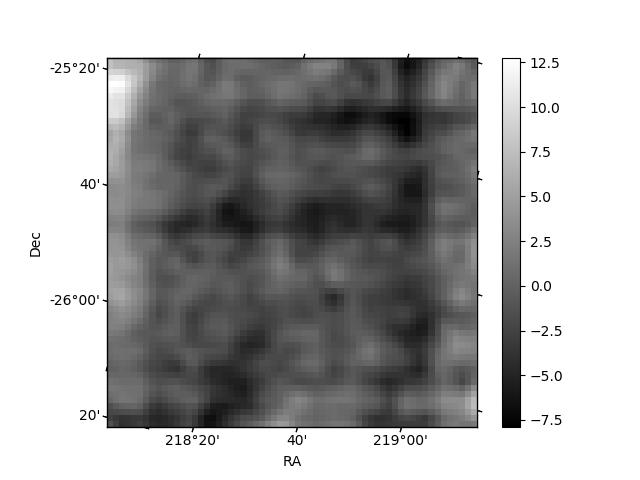
Histogram calculated using DETX and DETY for each event in the final _common_clean file
| Quadrant A | 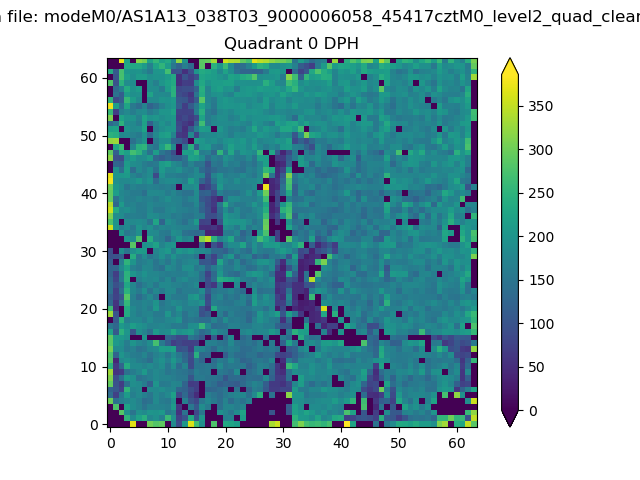 |
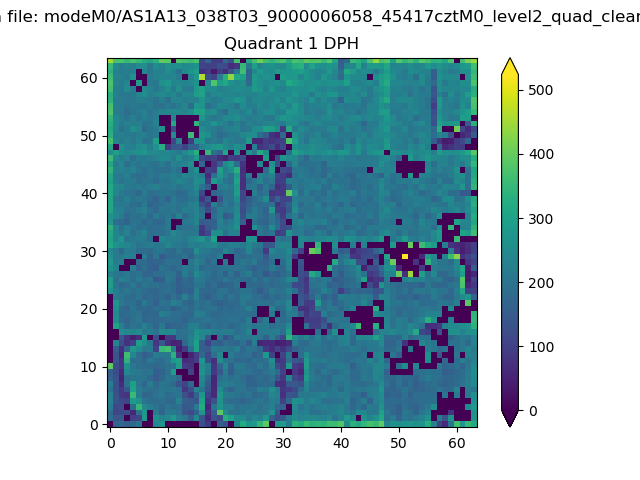 |
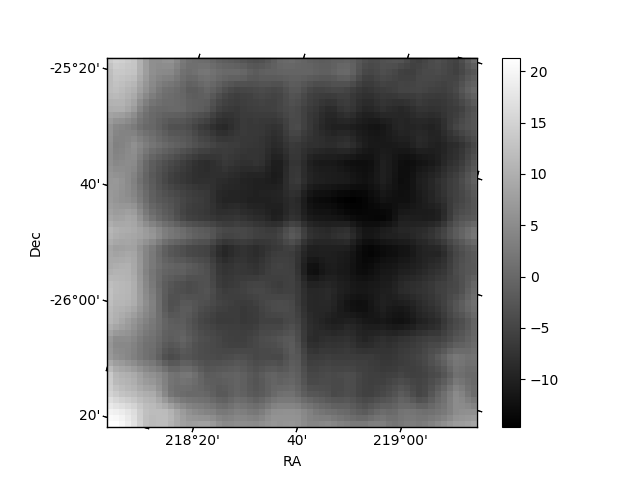
Quadrant B |
|---|---|---|---|
| Quadrant D | 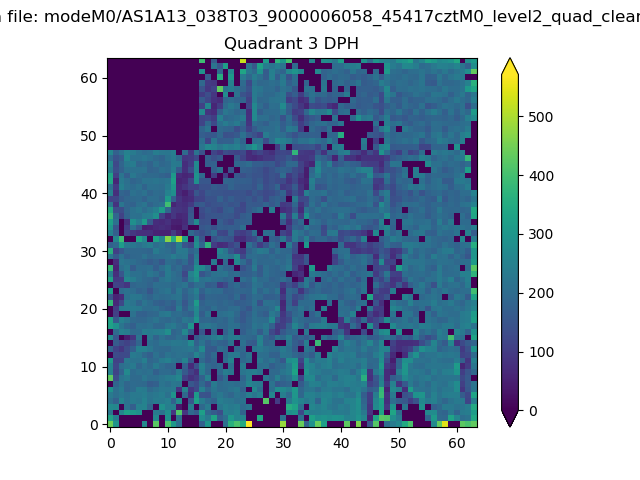 |
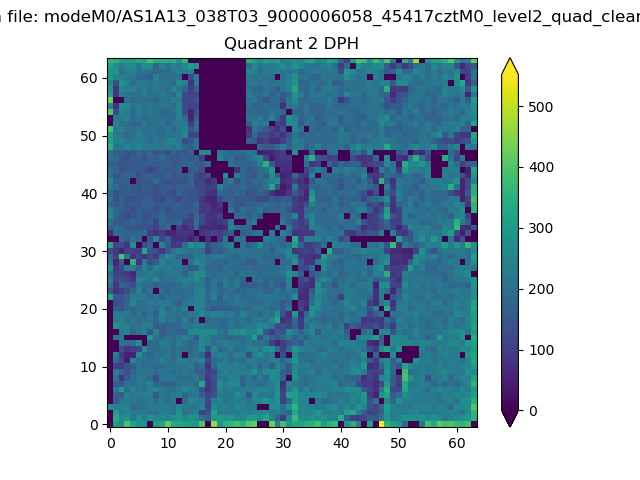 |
Quadrant C |
| Plot type | Count rate plots | Images |
|---|---|---|
| Comparison with Poisson distribution Blue bars denote a histogram of data divided into 1 sec bins. Red curve is a Poisson curve with rate = median count rate of data. |
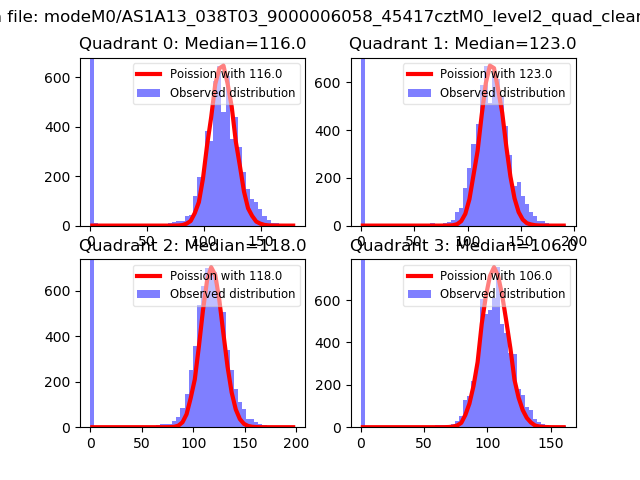 |
 |
| Quadrant-wise count rates Data is divided into 100 sec bins |
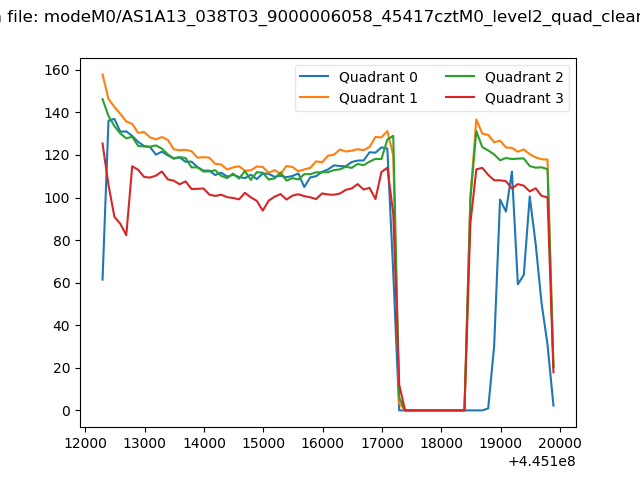 |
|
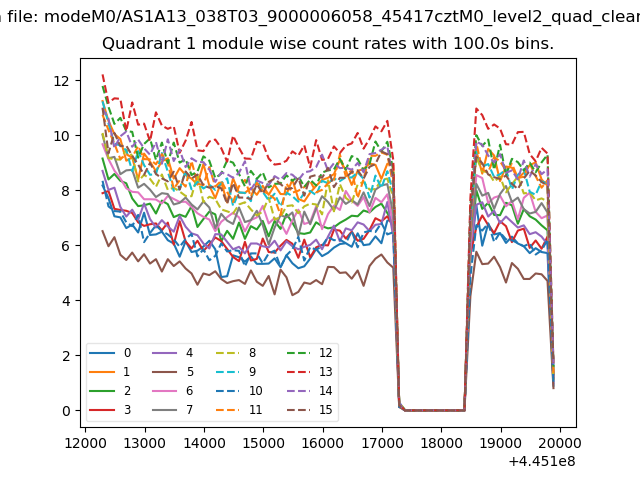
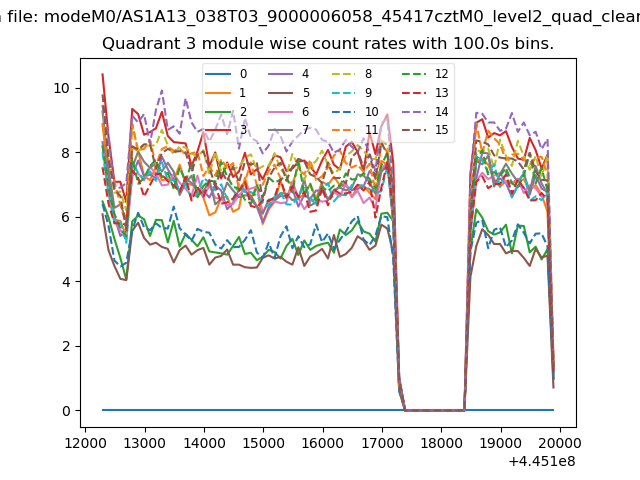
| Module-wise count rates for Quadrant A Data is divided into 100 sec bins |
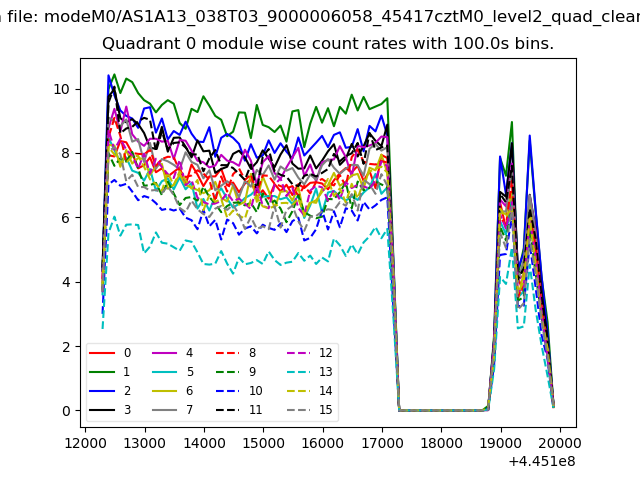 |
 |
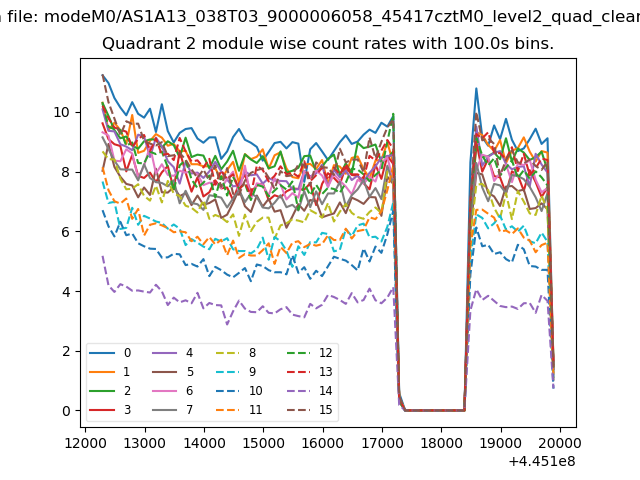
| Module-wise count rates for Quadrant B Data is divided into 100 sec bins |
 |
 |
| Module-wise count rates for Quadrant C Data is divided into 100 sec bins |
 |
 |
| Module-wise count rates for Quadrant D Data is divided into 100 sec bins |
 |
 |
| Parameter | Plot |
|---|---|
| CZT HV Monitor | 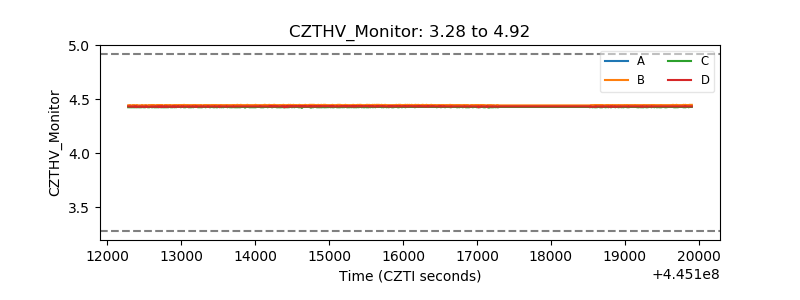 |
| D_VDD | 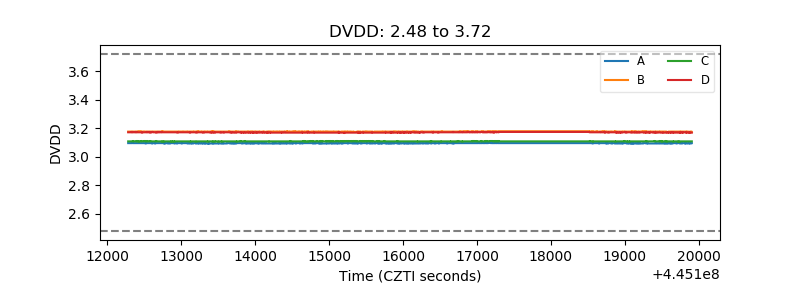 |
| Temperature 1 | 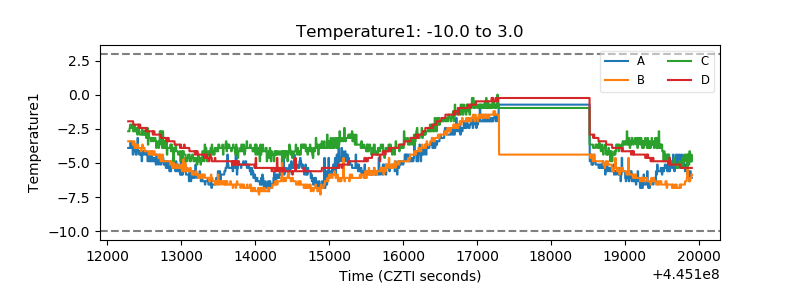 |
| Veto HV Monitor | 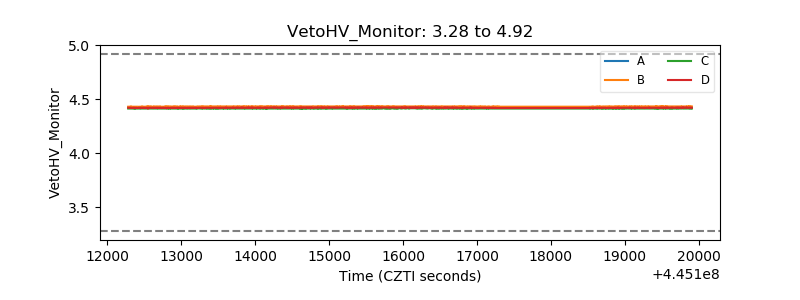 |
| Veto LLD | 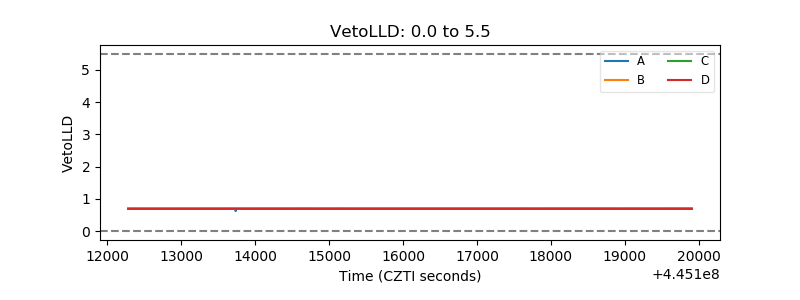 |
| Alpha Counter | 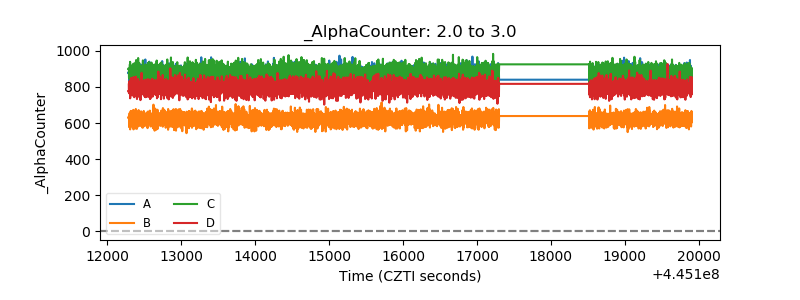 |
| _CPM_Rate | 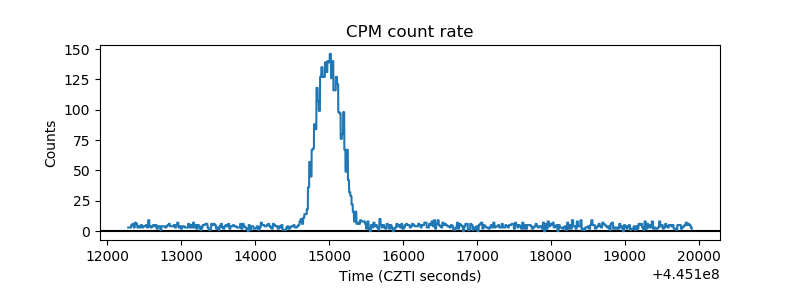 |
| CZT Counter | 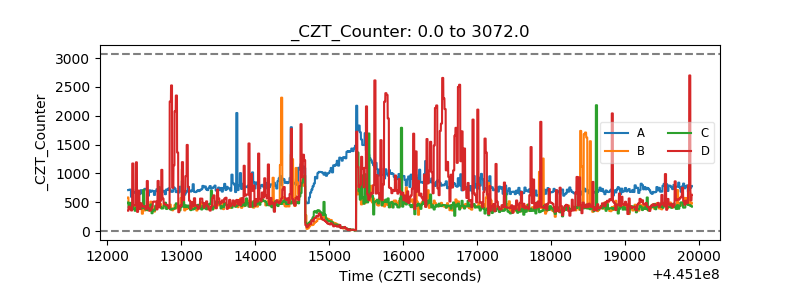 |
| +2.5 Volts monitor | 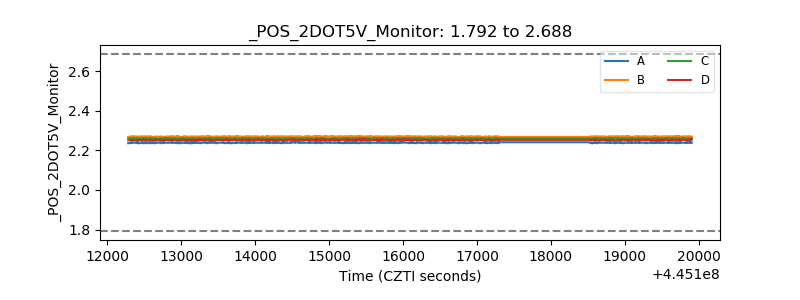 |
| +5 Volts monitor | 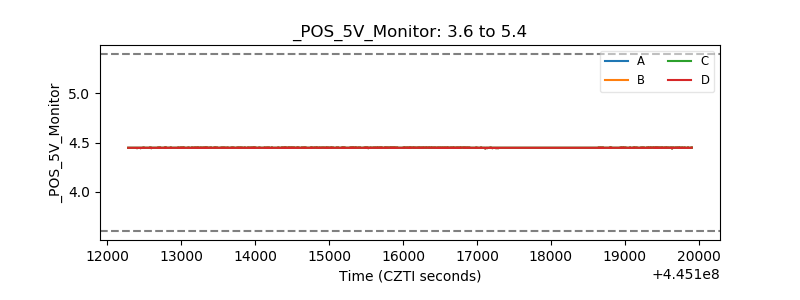 |
| _ROLL_ROT | 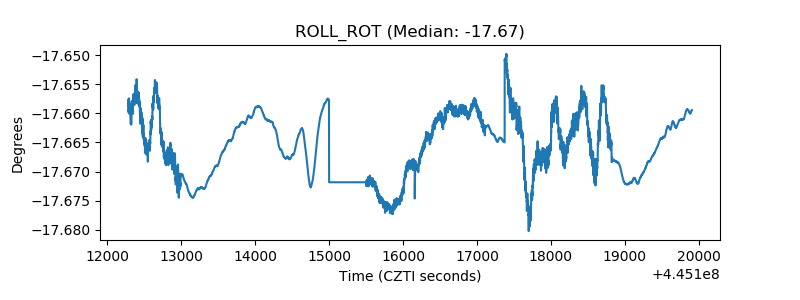 |
| _Roll_DEC | 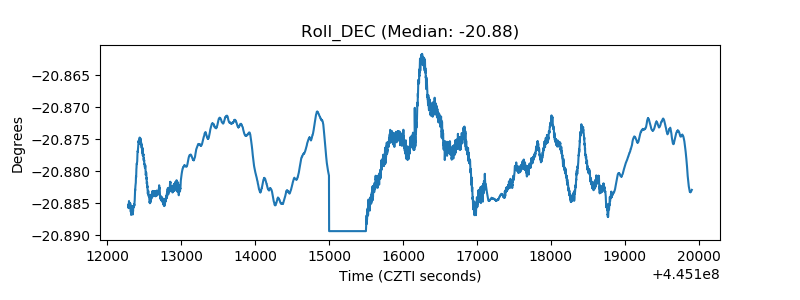 |
| _Roll_RA | 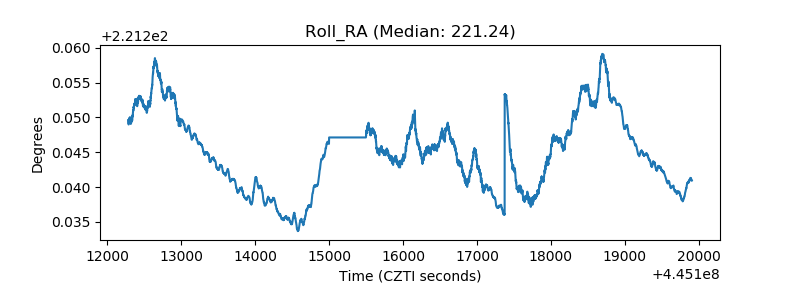 |
| Veto Counter | 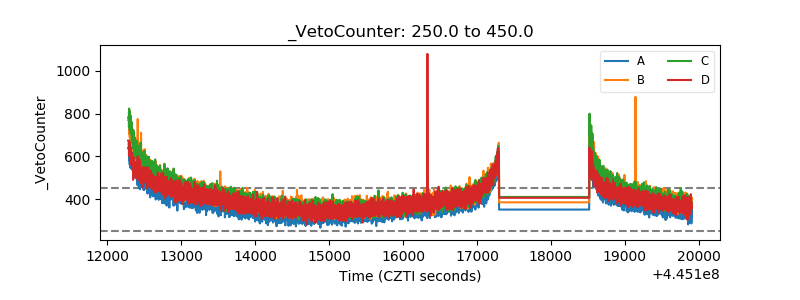 |