| Param | Original file | Final file |
|---|---|---|
| Filename | modeM0/AS1A13_038T03_9000006058_45420cztM0_level2.fits | modeM0/AS1A13_038T03_9000006058_45420cztM0_level2_quad_clean.evt |
| Size (bytes) | 568,428,480 | 120,214,080 |
| Size | 542.1 MB | 114.6 MB |
| Events in quadrant A | 6,380,266 | 802,730 |
| Events in quadrant B | 6,029,727 | 774,052 |
| Events in quadrant C | 3,612,507 | 807,843 |
| Events in quadrant D | 4,431,705 | 728,259 |
| Mode M0 | |||
|---|---|---|---|
| Quadrant | BADHDUFLAG | Total packets | Discarded packets |
| A | 0 | 24802 | 308 |
| B | 0 | 23307 | 262 |
| C | 0 | 16580 | 154 |
| D | 0 | 18960 | 250 |
| Mode SS | |||
|---|---|---|---|
| Quadrant | BADHDUFLAG | Total packets | Discarded packets |
| A | 0 | 154 | 0 |
| B | 0 | 154 | 0 |
| C | 0 | 154 | 0 |
| D | 0 | 154 | 0 |
| Quadrant | Total seconds | Saturated seconds | Saturation percentage |
|---|---|---|---|
| A | 7554 | 266 | 3.521313% |
| B | 7574 | 871 | 11.499868% |
| C | 7579 | 69 | 0.910410% |
| D | 7556 | 160 | 2.117522% |
Noise dominated data is calculated using 1-second bins in cleaned event files. If a bin has >2000 counts, and if more than 50% of those come from <1% of pixels, then it is considered to be noise-dominated and hence unusable.
| Quadrant | # 1 sec bins | Bins with >0 counts | Bins with >2000 counts | High rate bins dominated by noise | Noise dominated (total time) | Noise dominated (detector-on time) | Marked lightcurve |
|---|---|---|---|---|---|---|---|
| A | 7673 | 7638 | 112 | 112 | 1.46% | 1.47% | 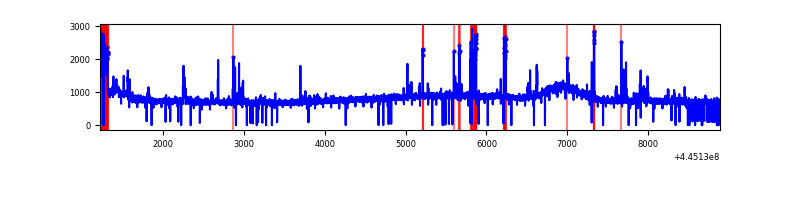 |
| B | 7673 | 7647 | 592 | 592 | 7.72% | 7.74% | 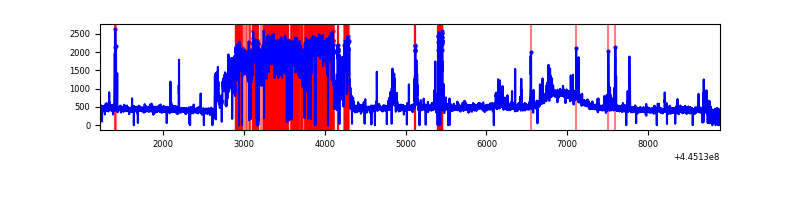 |
| C | 7673 | 7639 | 48 | 48 | 0.63% | 0.63% | 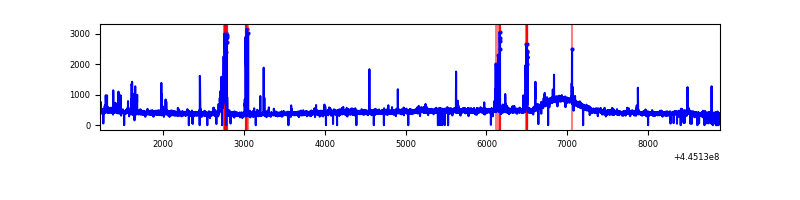 |
| D | 7673 | 7631 | 143 | 143 | 1.86% | 1.87% | 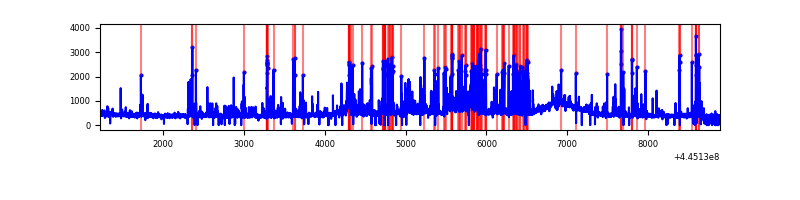 |
Top three noisy pixels from each quadrant. If the there are fewer than three noisy pixels in the level2.evt file, extra rows are filled as -1
| Pixel properties | Quadrant properties | ||||||
|---|---|---|---|---|---|---|---|
| Quadrant | DetID | PixID | Counts | Sigma | Mean | Median | Sigma |
| A | 10 | 83 | 2599460 | 14434.91 | 854 | 833 | 180.0 |
| A | 9 | 191 | 371728 | 2060.25 | 854 | 833 | 180.0 |
| A | 7 | 3 | 84797 | 466.4 | 854 | 833 | 180.0 |
| B | 15 | 201 | 2504799 | 14844.46 | 848 | 823 | 168.7 |
| B | 0 | 171 | 30864 | 178.09 | 848 | 823 | 168.7 |
| B | 0 | 189 | 29064 | 167.42 | 848 | 823 | 168.7 |
| C | 14 | 254 | 125608 | 623.35 | 845 | 848 | 200.1 |
| C | 1 | 3 | 112502 | 557.87 | 845 | 848 | 200.1 |
| C | 3 | 233 | 61248 | 301.78 | 845 | 848 | 200.1 |
| D | 1 | 52 | 689963 | 3246.39 | 834 | 808 | 212.3 |
| D | 5 | 222 | 140663 | 658.81 | 834 | 808 | 212.3 |
| D | 2 | 249 | 100792 | 470.99 | 834 | 808 | 212.3 |
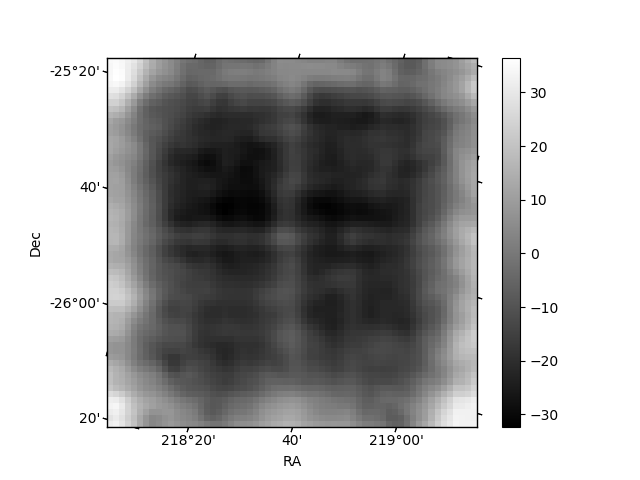
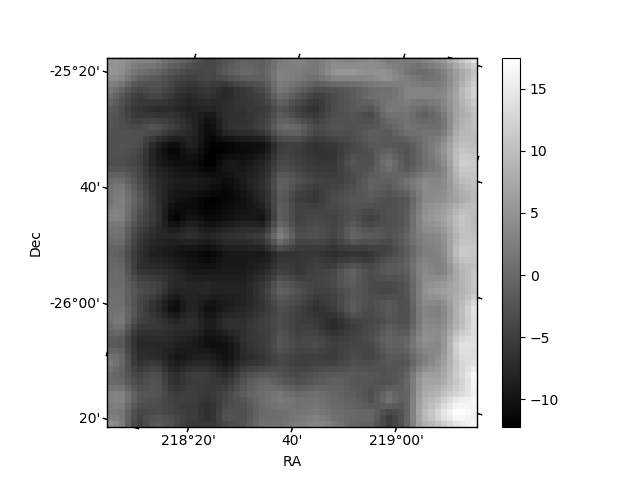
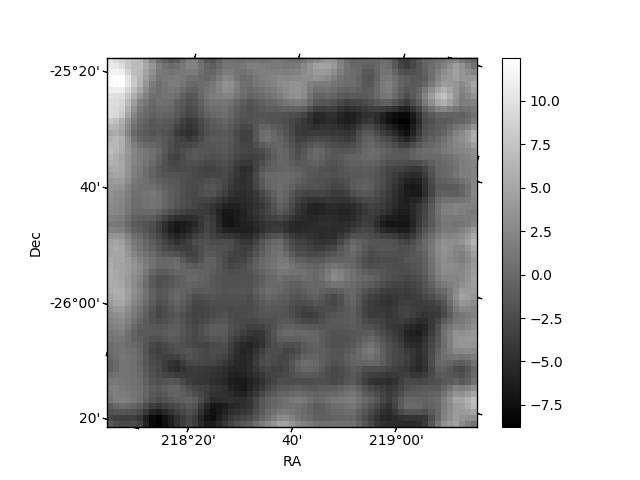
Histogram calculated using DETX and DETY for each event in the final _common_clean file
| Quadrant A | 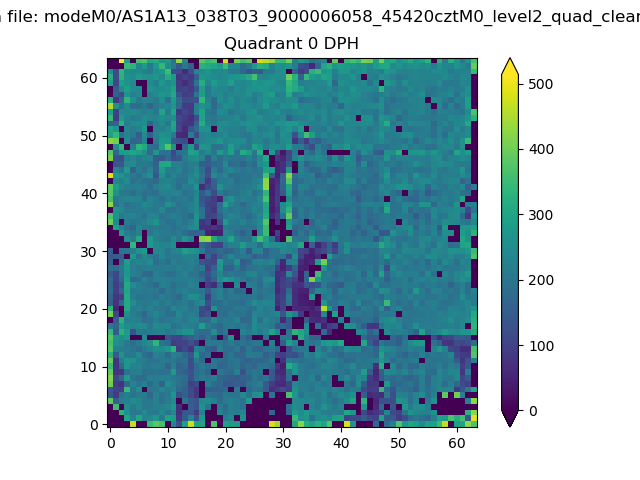 |
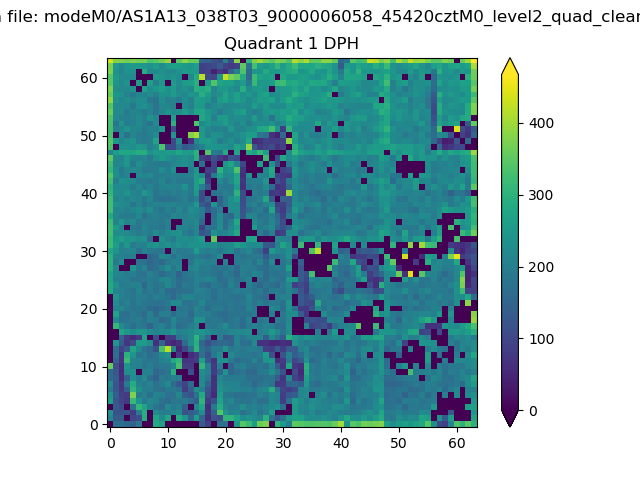 |
Quadrant B |
|---|---|---|---|
| Quadrant D | 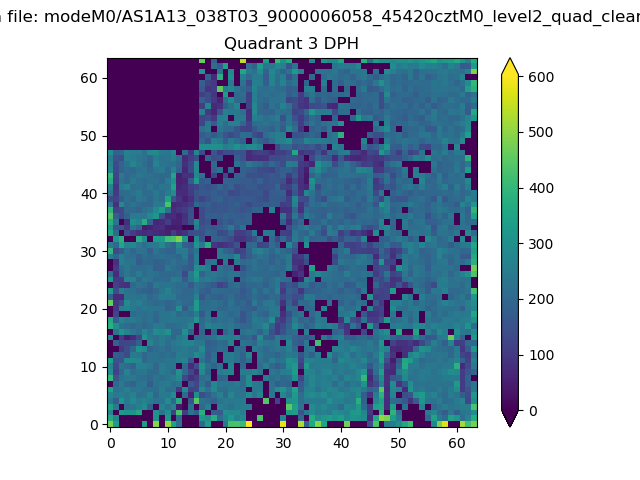 |
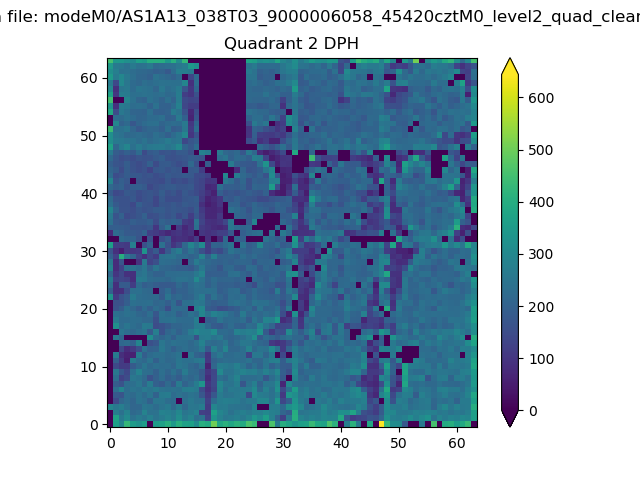 |
Quadrant C |
| Plot type | Count rate plots | Images |
|---|---|---|
| Comparison with Poisson distribution Blue bars denote a histogram of data divided into 1 sec bins. Red curve is a Poisson curve with rate = median count rate of data. |
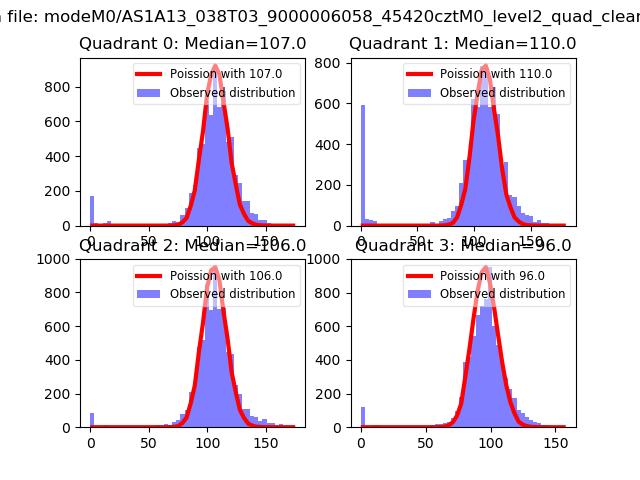 |
 |
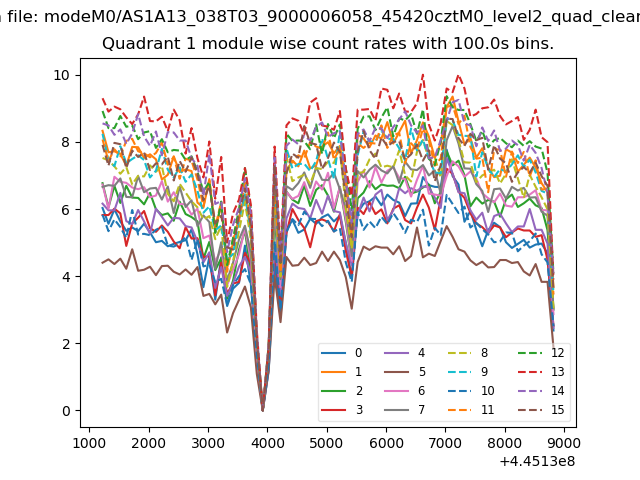
| Quadrant-wise count rates Data is divided into 100 sec bins |
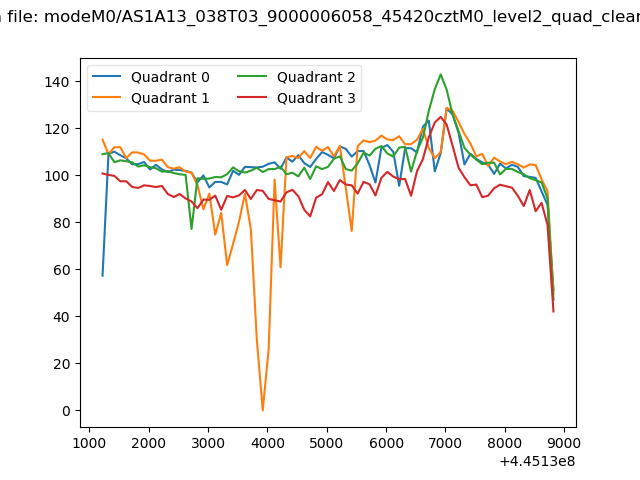 |
|
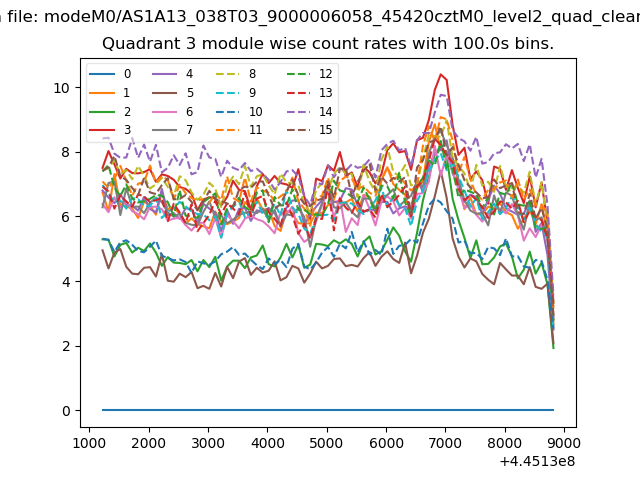
| Module-wise count rates for Quadrant A Data is divided into 100 sec bins |
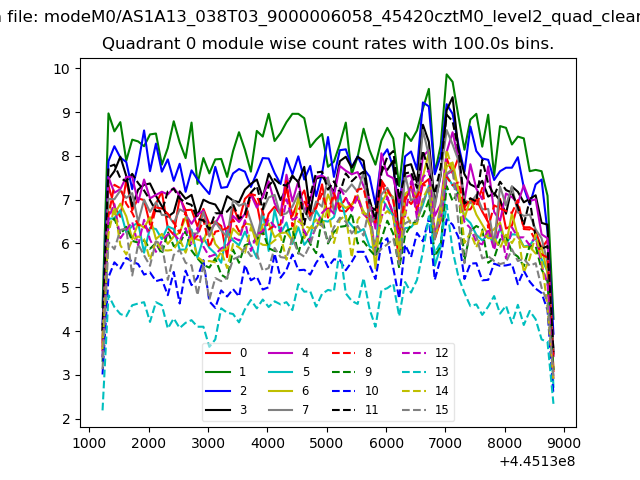 |
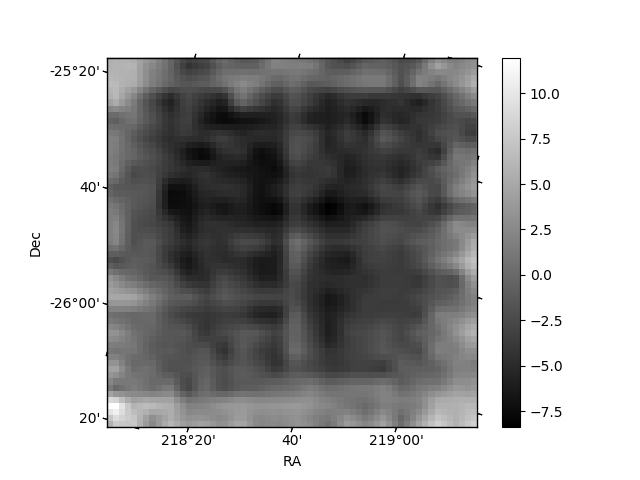 |
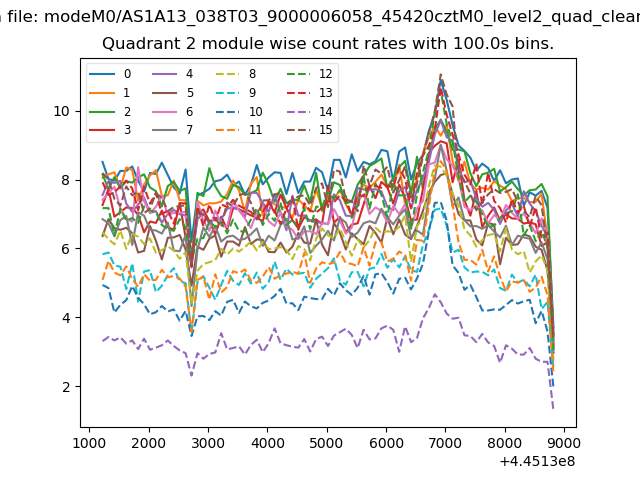
| Module-wise count rates for Quadrant B Data is divided into 100 sec bins |
 |
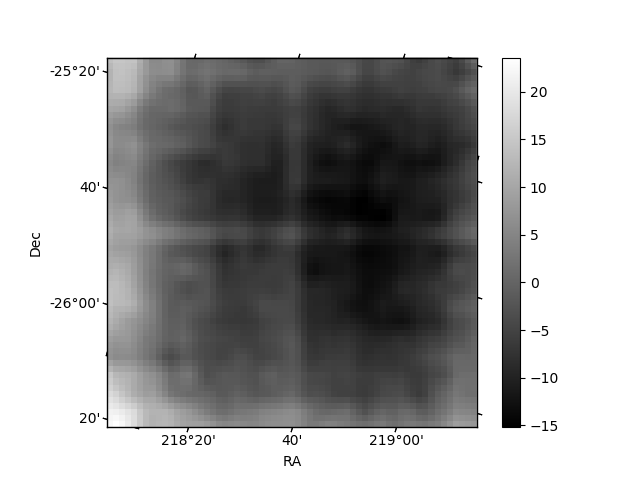 |
| Module-wise count rates for Quadrant C Data is divided into 100 sec bins |
 |
 |
| Module-wise count rates for Quadrant D Data is divided into 100 sec bins |
 |
 |
| Parameter | Plot |
|---|---|
| CZT HV Monitor | 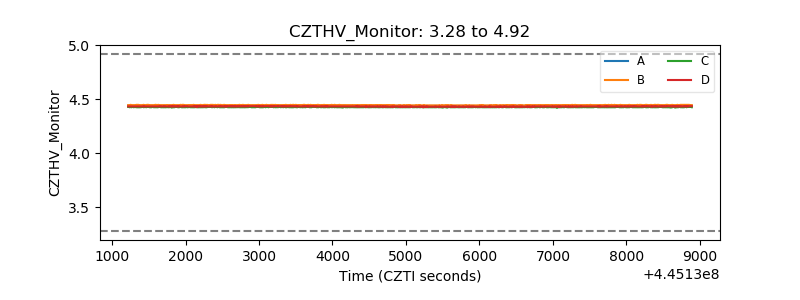 |
| D_VDD |  |
| Temperature 1 | 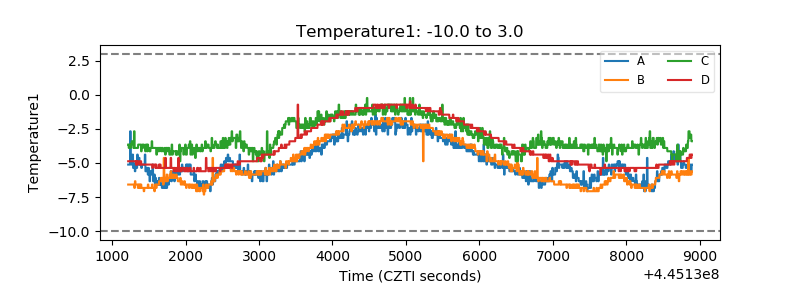 |
| Veto HV Monitor | 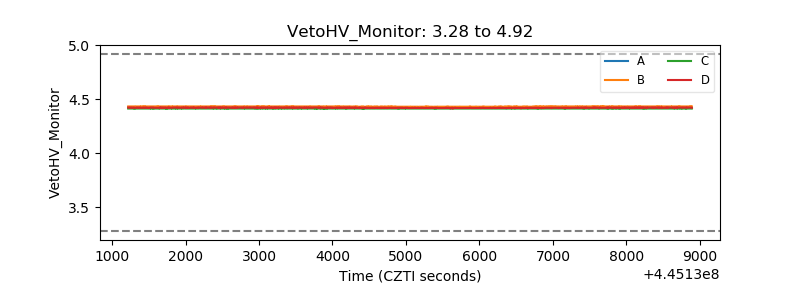 |
| Veto LLD | 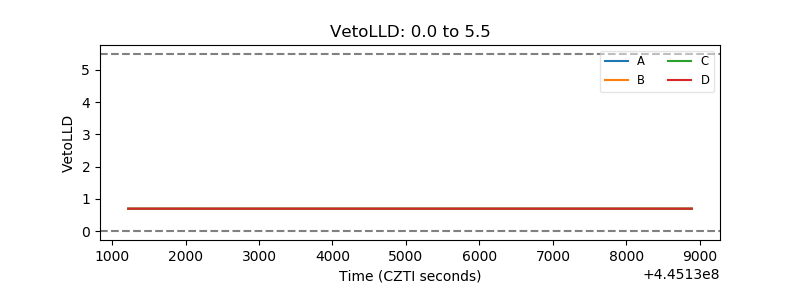 |
| Alpha Counter | 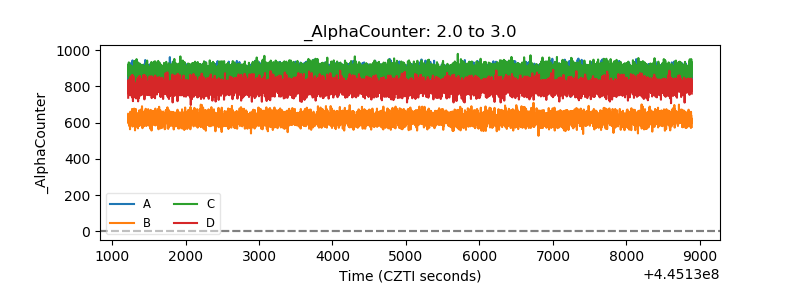 |
| _CPM_Rate | 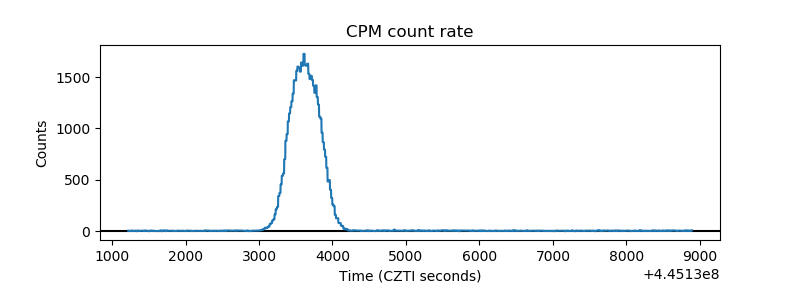 |
| CZT Counter | 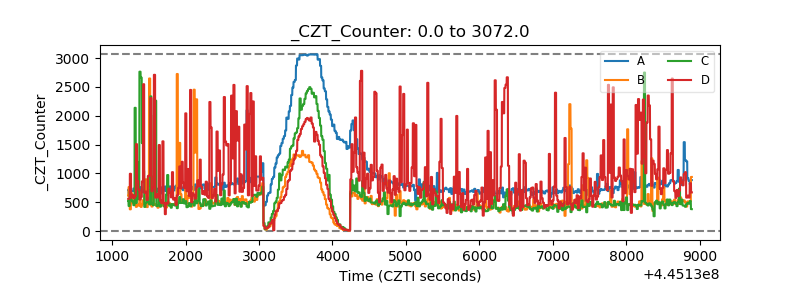 |
| +2.5 Volts monitor | 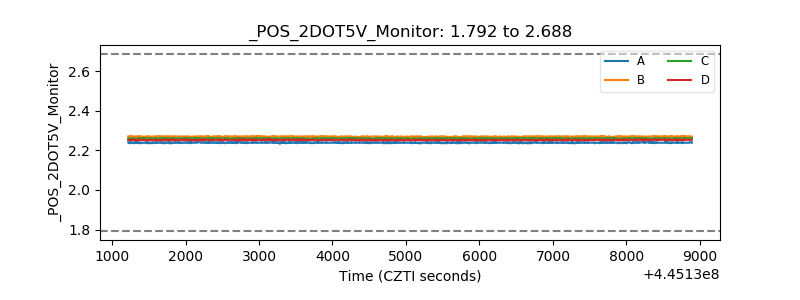 |
| +5 Volts monitor | 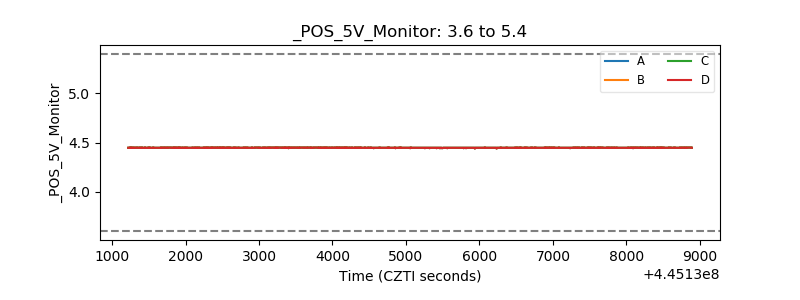 |
| _ROLL_ROT | 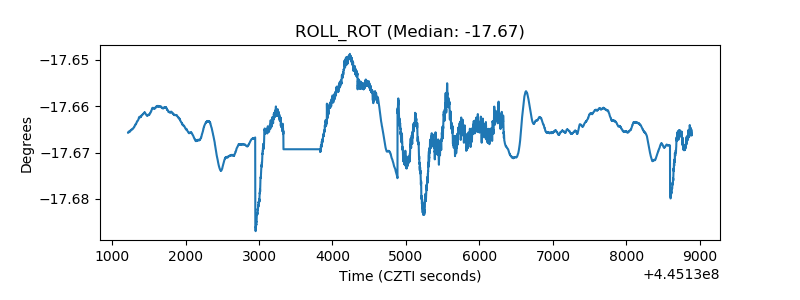 |
| _Roll_DEC | 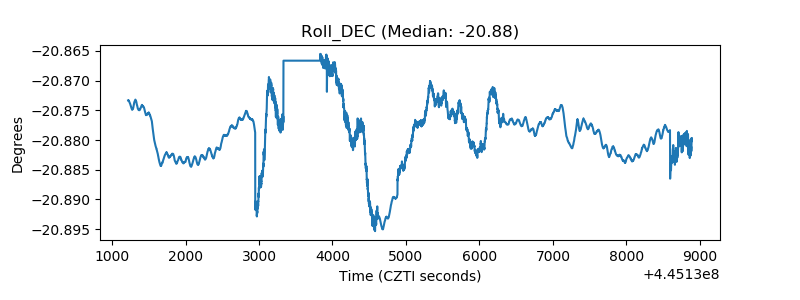 |
| _Roll_RA | 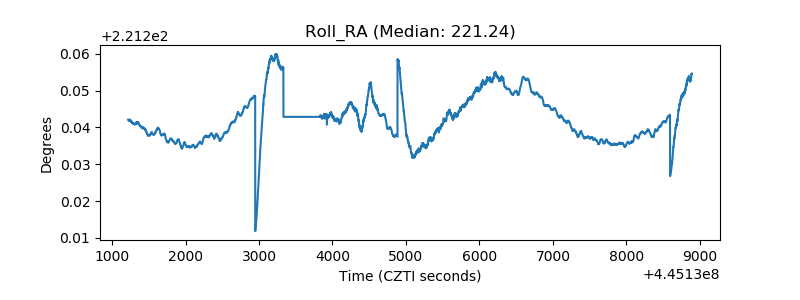 |
| Veto Counter | 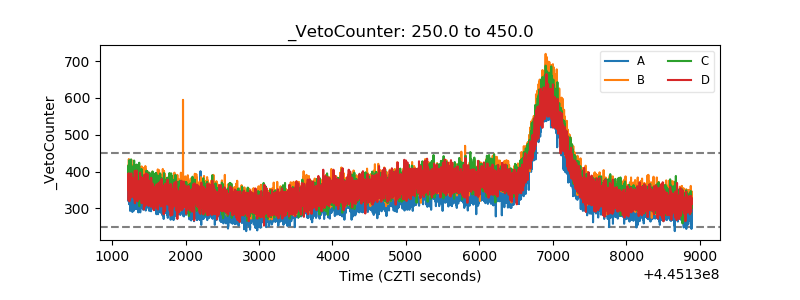 |