| Param | Original file | Final file |
|---|---|---|
| Filename | modeM0/AS1A13_038T03_9000006058_45421cztM0_level2.fits | modeM0/AS1A13_038T03_9000006058_45421cztM0_level2_quad_clean.evt |
| Size (bytes) | 566,225,280 | 128,004,480 |
| Size | 540.0 MB | 122.1 MB |
| Events in quadrant A | 7,528,686 | 804,088 |
| Events in quadrant B | 5,004,744 | 872,704 |
| Events in quadrant C | 3,607,889 | 857,339 |
| Events in quadrant D | 4,188,964 | 777,466 |
| Mode M0 | |||
|---|---|---|---|
| Quadrant | BADHDUFLAG | Total packets | Discarded packets |
| A | 0 | 28367 | 7 |
| B | 0 | 20715 | 0 |
| C | 0 | 16942 | 0 |
| D | 0 | 18423 | 0 |
| Mode SS | |||
|---|---|---|---|
| Quadrant | BADHDUFLAG | Total packets | Discarded packets |
| A | 0 | 164 | 0 |
| B | 0 | 164 | 0 |
| C | 0 | 164 | 0 |
| D | 0 | 164 | 0 |
| Quadrant | Total seconds | Saturated seconds | Saturation percentage |
|---|---|---|---|
| A | 8111 | 650 | 8.013808% |
| B | 8113 | 399 | 4.918033% |
| C | 8114 | 13 | 0.160217% |
| D | 8114 | 67 | 0.825733% |
Noise dominated data is calculated using 1-second bins in cleaned event files. If a bin has >2000 counts, and if more than 50% of those come from <1% of pixels, then it is considered to be noise-dominated and hence unusable.
| Quadrant | # 1 sec bins | Bins with >0 counts | Bins with >2000 counts | High rate bins dominated by noise | Noise dominated (total time) | Noise dominated (detector-on time) | Marked lightcurve |
|---|---|---|---|---|---|---|---|
| A | 8113 | 8112 | 535 | 535 | 6.59% | 6.60% | 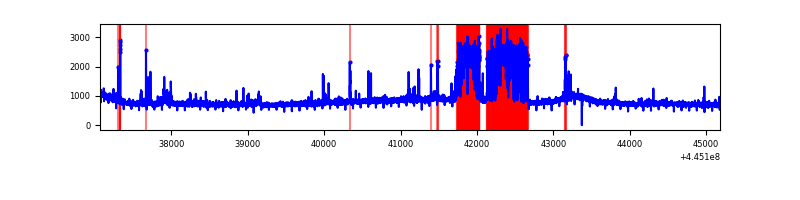 |
| B | 8113 | 8113 | 172 | 172 | 2.12% | 2.12% | 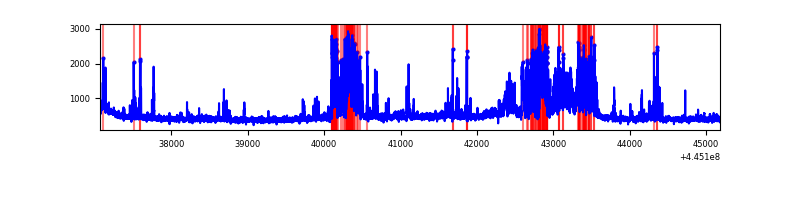 |
| C | 8114 | 8114 | 12 | 12 | 0.15% | 0.15% | 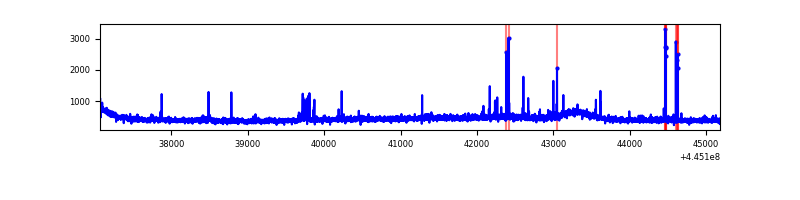 |
| D | 8114 | 8114 | 66 | 66 | 0.81% | 0.81% | 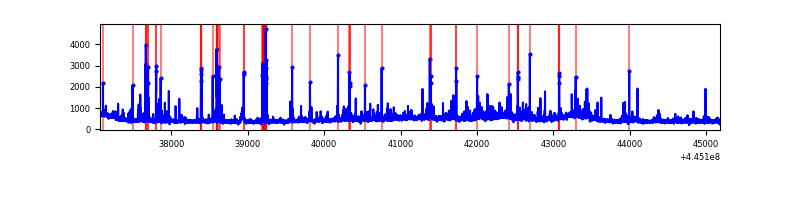 |
Top three noisy pixels from each quadrant. If the there are fewer than three noisy pixels in the level2.evt file, extra rows are filled as -1
| Pixel properties | Quadrant properties | ||||||
|---|---|---|---|---|---|---|---|
| Quadrant | DetID | PixID | Counts | Sigma | Mean | Median | Sigma |
| A | 10 | 83 | 2733745 | 14910.79 | 876 | 857 | 183.3 |
| A | 9 | 191 | 1257894 | 6858.47 | 876 | 857 | 183.3 |
| A | 7 | 3 | 76044 | 410.22 | 876 | 857 | 183.3 |
| B | 5 | 255 | 1240134 | 7073.11 | 894 | 865 | 175.2 |
| B | 15 | 201 | 94154 | 532.45 | 894 | 865 | 175.2 |
| B | 3 | 112 | 44638 | 249.83 | 894 | 865 | 175.2 |
| C | 14 | 254 | 53216 | 250.25 | 882 | 887 | 209.1 |
| C | 0 | 239 | 53029 | 249.36 | 882 | 887 | 209.1 |
| C | 3 | 233 | 23523 | 108.25 | 882 | 887 | 209.1 |
| D | 1 | 52 | 368828 | 1693.45 | 873 | 847 | 217.3 |
| D | 11 | 241 | 131095 | 599.4 | 873 | 847 | 217.3 |
| D | 2 | 249 | 103052 | 470.35 | 873 | 847 | 217.3 |
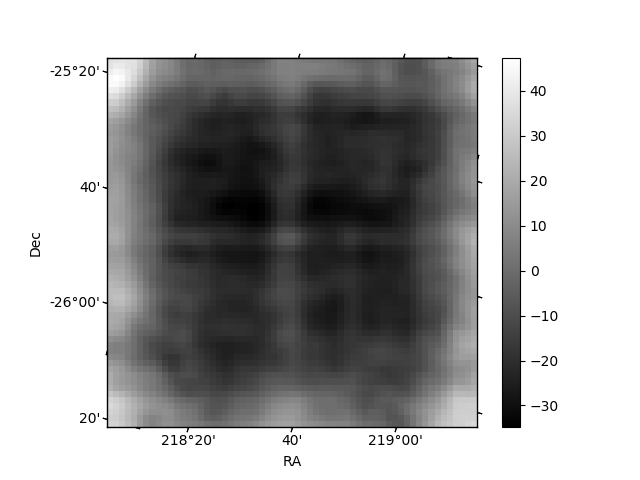
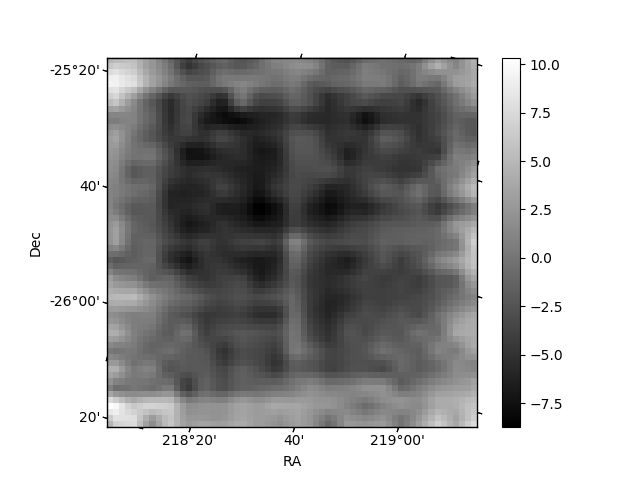
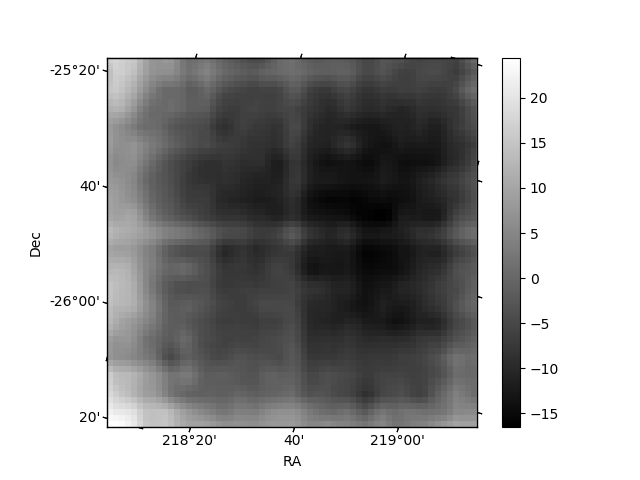
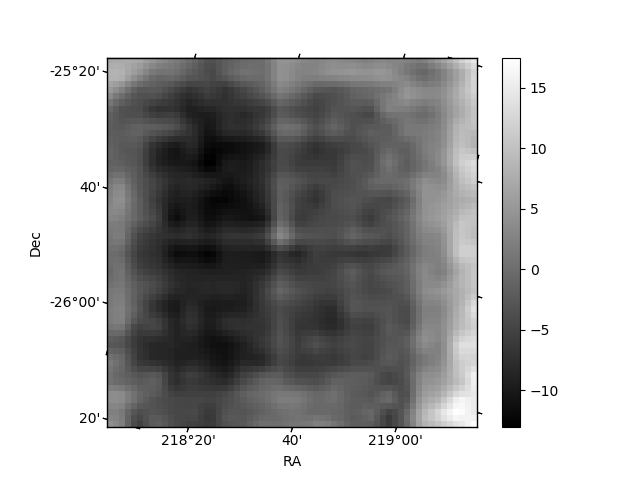
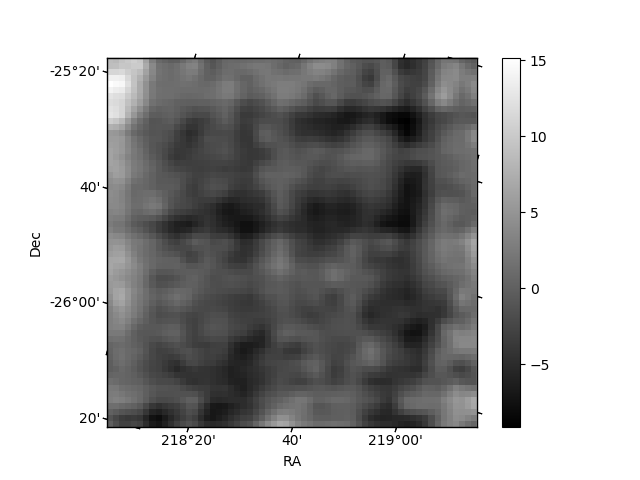
Histogram calculated using DETX and DETY for each event in the final _common_clean file
| Quadrant A | 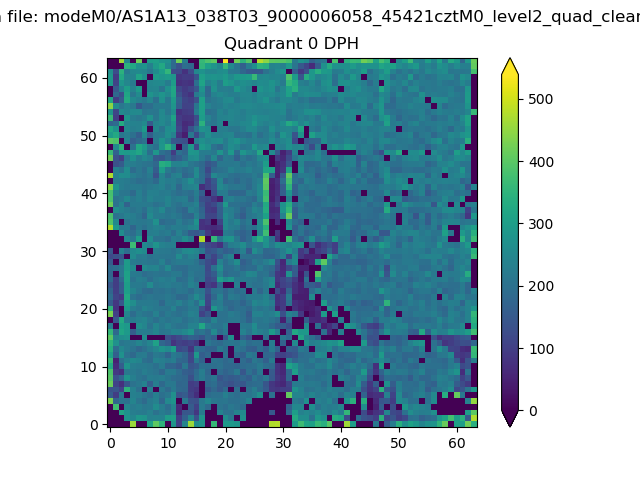 |
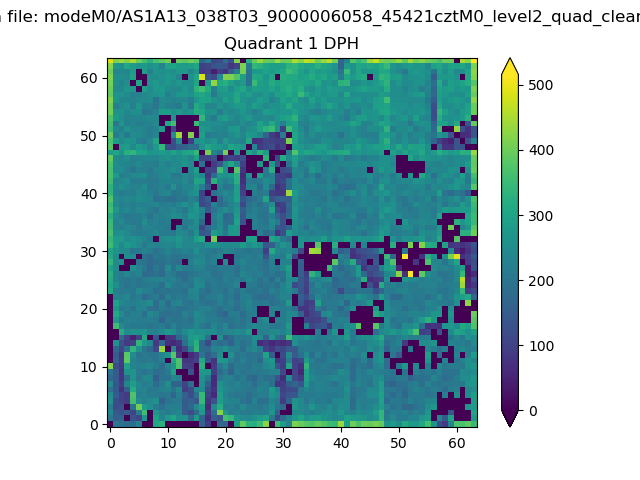 |
Quadrant B |
|---|---|---|---|
| Quadrant D | 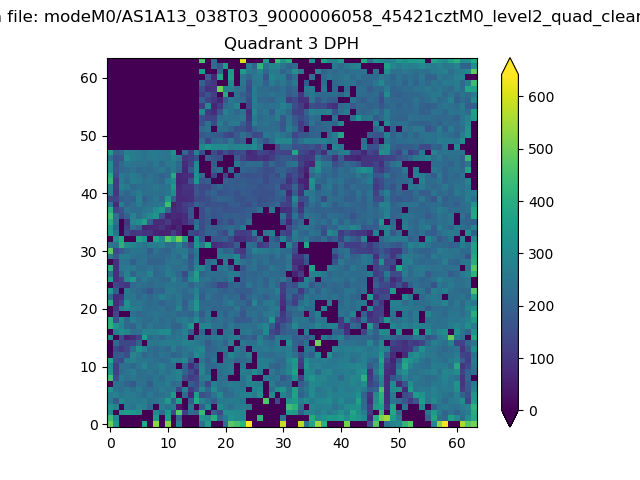 |
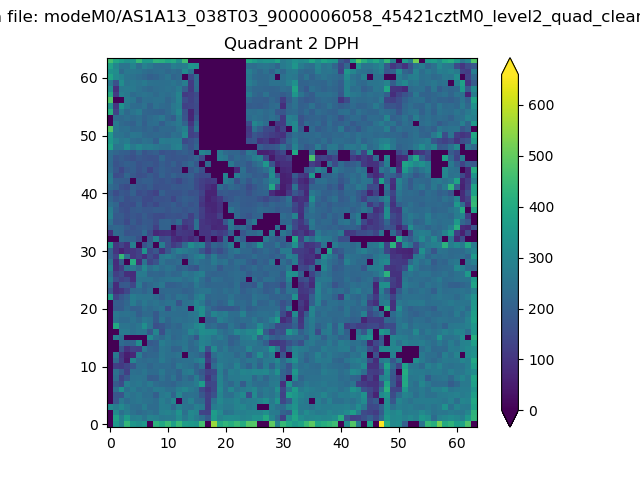 |
Quadrant C |
| Plot type | Count rate plots | Images |
|---|---|---|
| Comparison with Poisson distribution Blue bars denote a histogram of data divided into 1 sec bins. Red curve is a Poisson curve with rate = median count rate of data. |
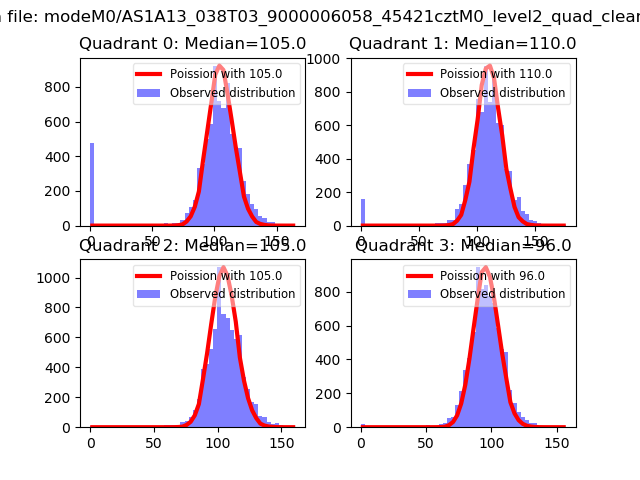 |
 |
| Quadrant-wise count rates Data is divided into 100 sec bins |
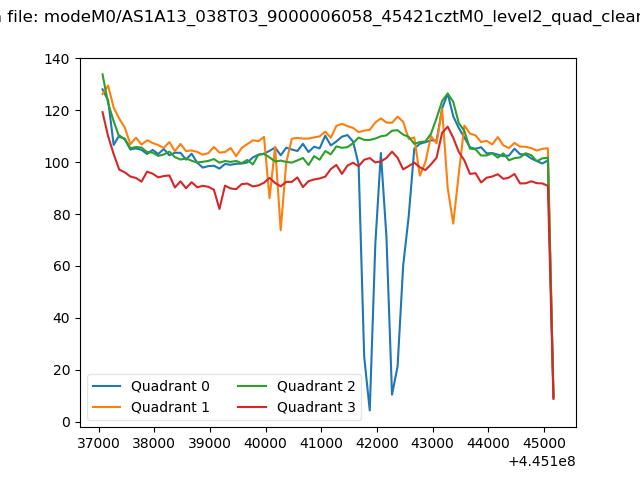 |
|
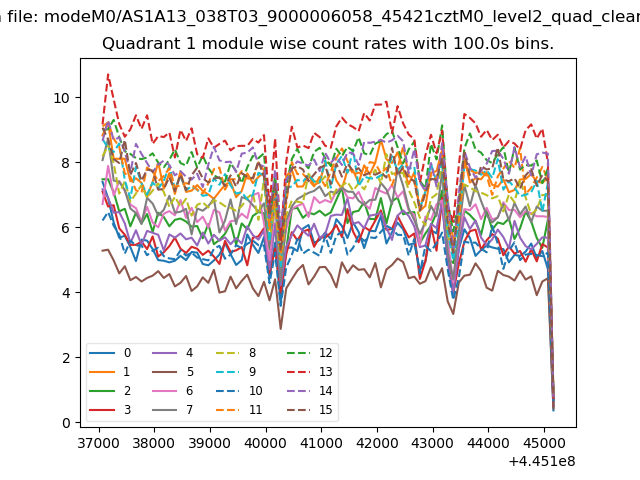
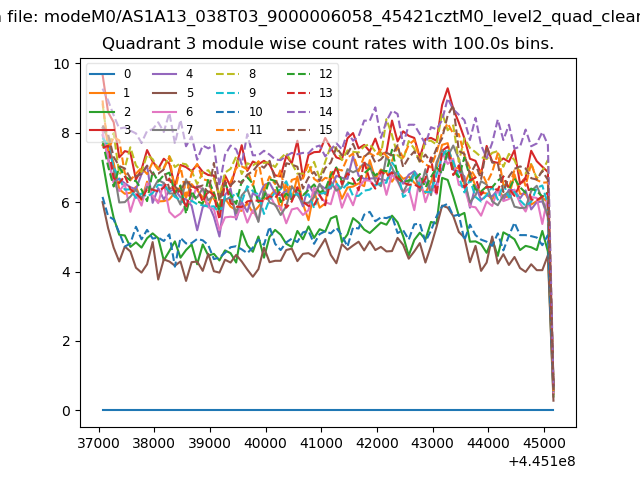
| Module-wise count rates for Quadrant A Data is divided into 100 sec bins |
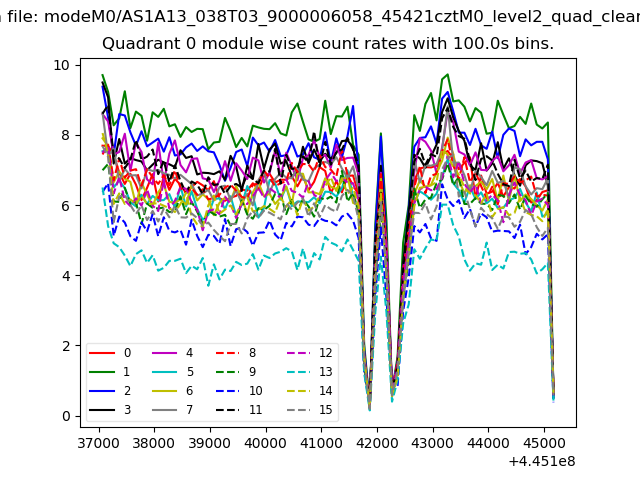 |
 |
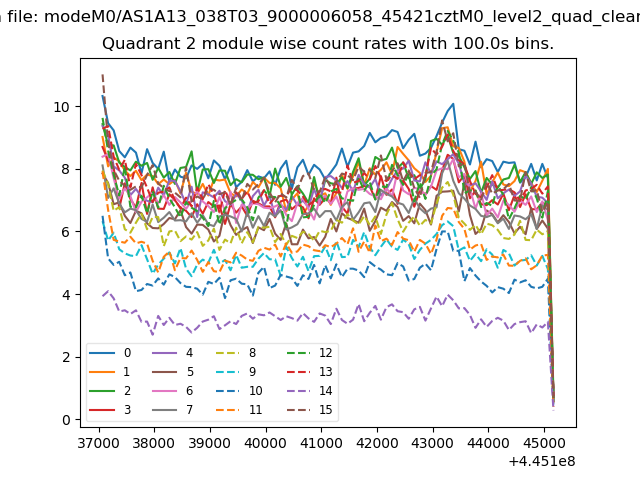
| Module-wise count rates for Quadrant B Data is divided into 100 sec bins |
 |
 |
| Module-wise count rates for Quadrant C Data is divided into 100 sec bins |
 |
 |
| Module-wise count rates for Quadrant D Data is divided into 100 sec bins |
 |
 |
| Parameter | Plot |
|---|---|
| CZT HV Monitor | 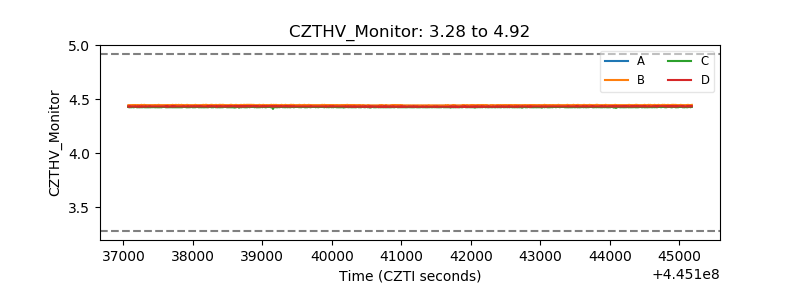 |
| D_VDD | 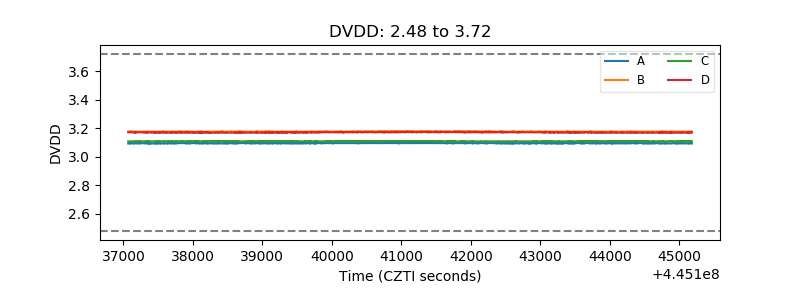 |
| Temperature 1 | 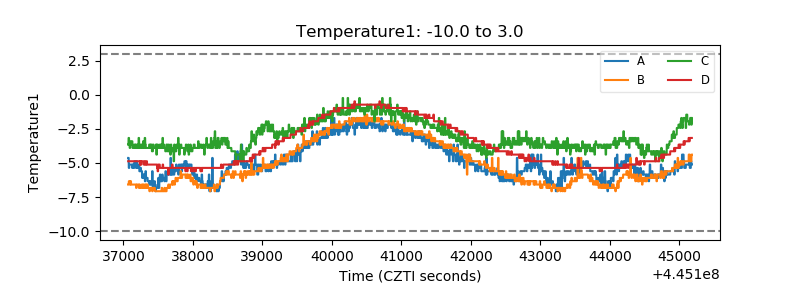 |
| Veto HV Monitor | 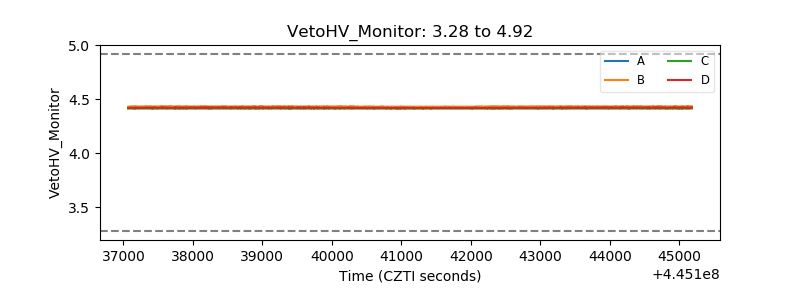 |
| Veto LLD | 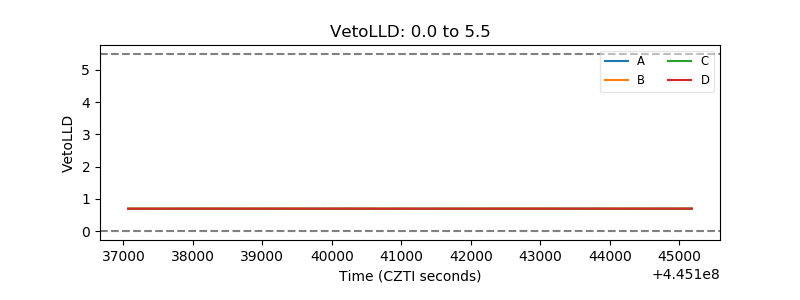 |
| Alpha Counter | 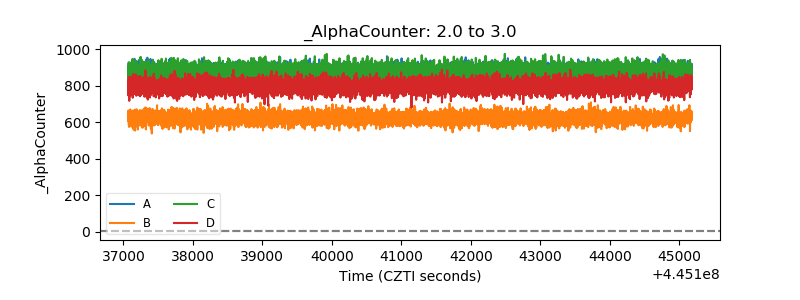 |
| _CPM_Rate | 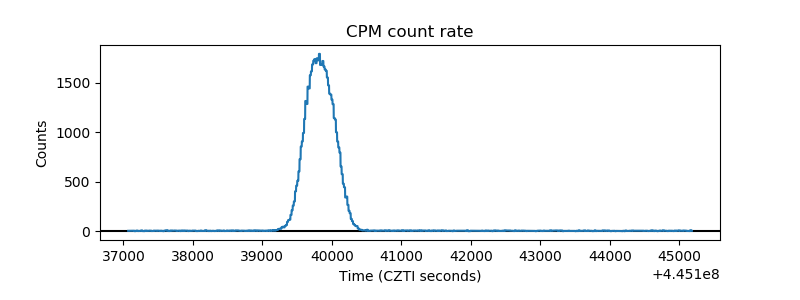 |
| CZT Counter | 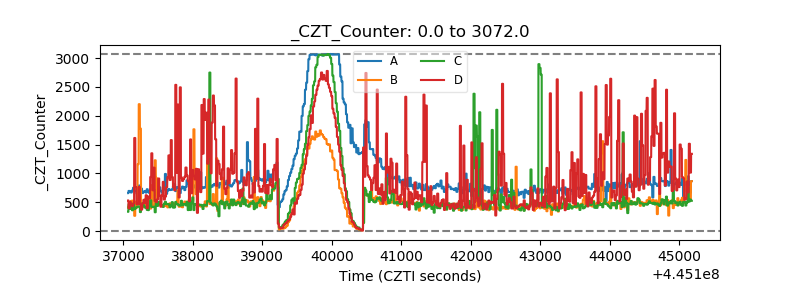 |
| +2.5 Volts monitor |  |
| +5 Volts monitor | 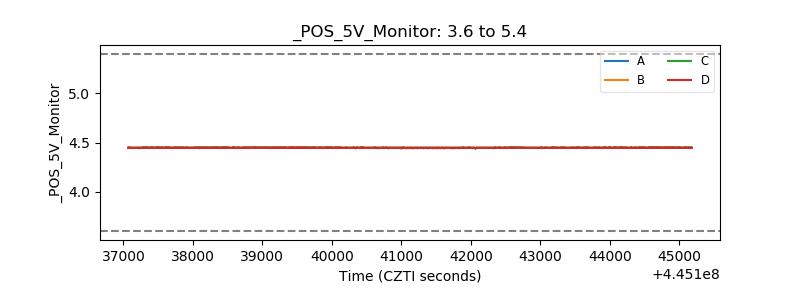 |
| _ROLL_ROT | 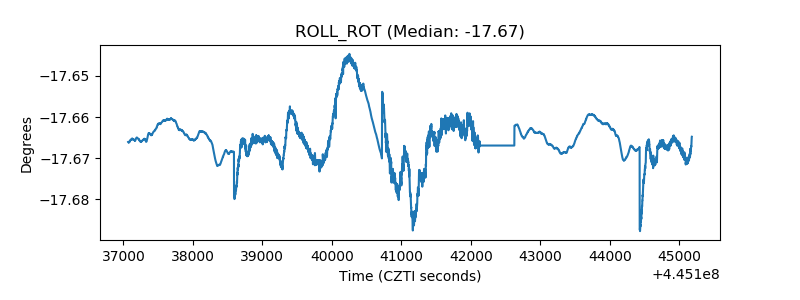 |
| _Roll_DEC | 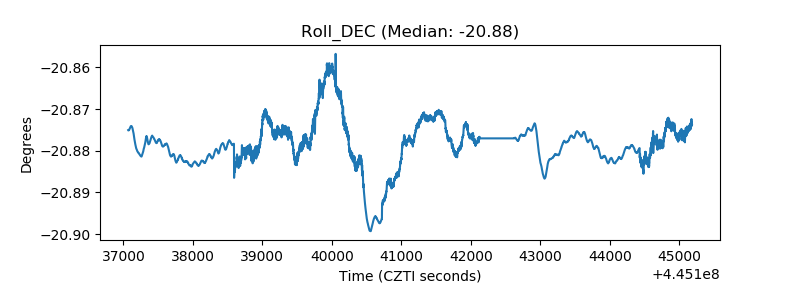 |
| _Roll_RA | 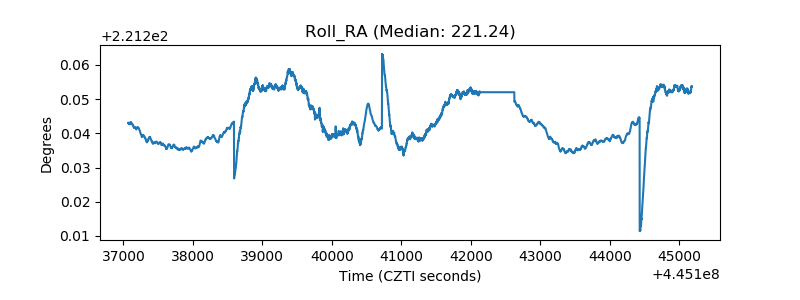 |
| Veto Counter | 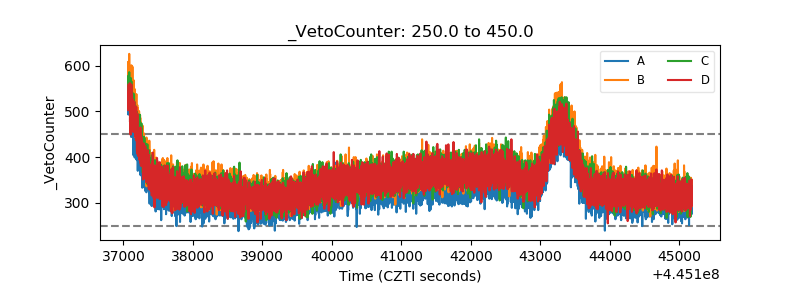 |