| Param | Original file | Final file |
|---|---|---|
| Filename | modeM0/AS1A13_038T03_9000006058_45422cztM0_level2.fits | modeM0/AS1A13_038T03_9000006058_45422cztM0_level2_quad_clean.evt |
| Size (bytes) | 487,463,040 | 115,577,280 |
| Size | 464.9 MB | 110.2 MB |
| Events in quadrant A | 5,724,552 | 764,602 |
| Events in quadrant B | 3,778,465 | 793,919 |
| Events in quadrant C | 3,260,915 | 758,842 |
| Events in quadrant D | 4,716,234 | 676,507 |
| Mode M0 | |||
|---|---|---|---|
| Quadrant | BADHDUFLAG | Total packets | Discarded packets |
| A | 0 | 22355 | 5 |
| B | 0 | 16434 | 0 |
| C | 0 | 15271 | 0 |
| D | 0 | 19165 | 0 |
| Mode SS | |||
|---|---|---|---|
| Quadrant | BADHDUFLAG | Total packets | Discarded packets |
| A | 0 | 144 | 0 |
| B | 0 | 144 | 0 |
| C | 0 | 144 | 0 |
| D | 0 | 144 | 0 |
| Quadrant | Total seconds | Saturated seconds | Saturation percentage |
|---|---|---|---|
| A | 7262 | 141 | 1.941614% |
| B | 7264 | 160 | 2.202643% |
| C | 7265 | 44 | 0.605643% |
| D | 7265 | 243 | 3.344804% |
Noise dominated data is calculated using 1-second bins in cleaned event files. If a bin has >2000 counts, and if more than 50% of those come from <1% of pixels, then it is considered to be noise-dominated and hence unusable.
| Quadrant | # 1 sec bins | Bins with >0 counts | Bins with >2000 counts | High rate bins dominated by noise | Noise dominated (total time) | Noise dominated (detector-on time) | Marked lightcurve |
|---|---|---|---|---|---|---|---|
| A | 7264 | 7263 | 30 | 30 | 0.41% | 0.41% | 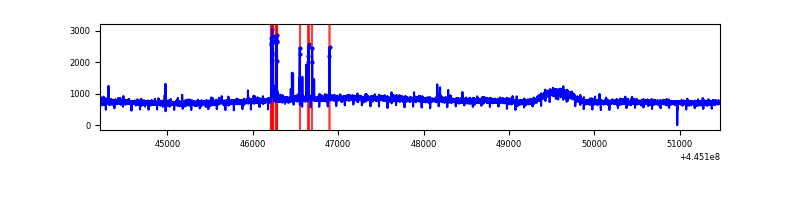 |
| B | 7264 | 7264 | 58 | 58 | 0.80% | 0.80% | 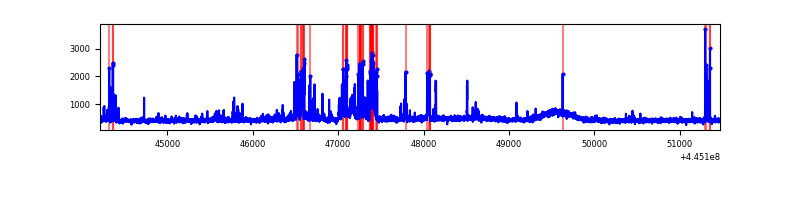 |
| C | 7265 | 7265 | 29 | 29 | 0.40% | 0.40% | 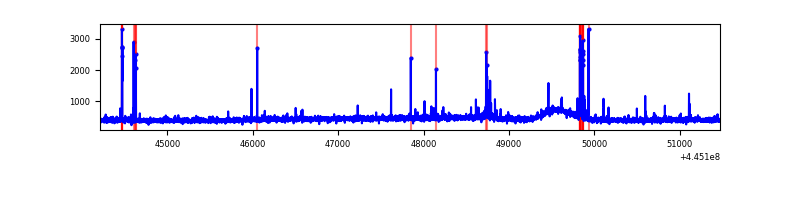 |
| D | 7265 | 7265 | 212 | 212 | 2.92% | 2.92% | 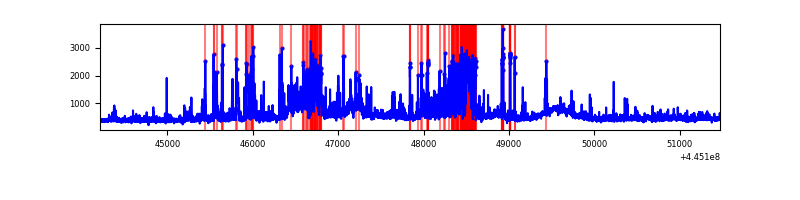 |
Top three noisy pixels from each quadrant. If the there are fewer than three noisy pixels in the level2.evt file, extra rows are filled as -1
| Pixel properties | Quadrant properties | ||||||
|---|---|---|---|---|---|---|---|
| Quadrant | DetID | PixID | Counts | Sigma | Mean | Median | Sigma |
| A | 10 | 83 | 2492147 | 14784.78 | 805 | 786 | 168.5 |
| A | 15 | 174 | 59733 | 349.82 | 805 | 786 | 168.5 |
| A | 2 | 79 | 37867 | 220.05 | 805 | 786 | 168.5 |
| B | 15 | 201 | 355321 | 2200.16 | 802 | 777 | 161.1 |
| B | 5 | 255 | 59234 | 362.76 | 802 | 777 | 161.1 |
| B | 0 | 189 | 55479 | 339.46 | 802 | 777 | 161.1 |
| C | 14 | 254 | 69911 | 373.32 | 787 | 791 | 185.1 |
| C | 0 | 239 | 50240 | 267.08 | 787 | 791 | 185.1 |
| C | 2 | 14 | 18758 | 97.04 | 787 | 791 | 185.1 |
| D | 5 | 222 | 582180 | 2956.01 | 777 | 750 | 196.7 |
| D | 1 | 52 | 370061 | 1877.59 | 777 | 750 | 196.7 |
| D | 8 | 48 | 331091 | 1679.47 | 777 | 750 | 196.7 |
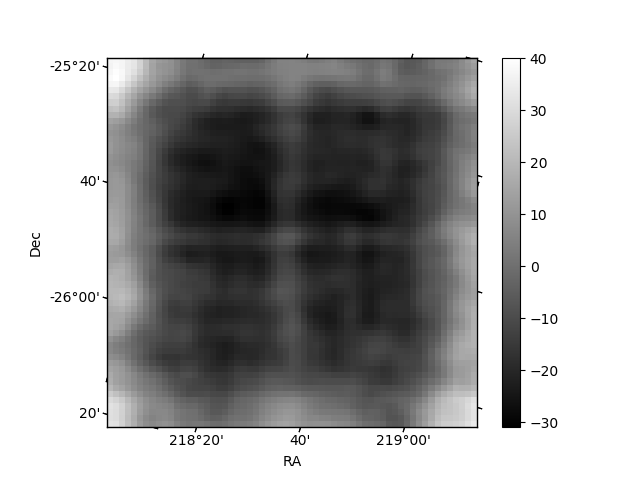
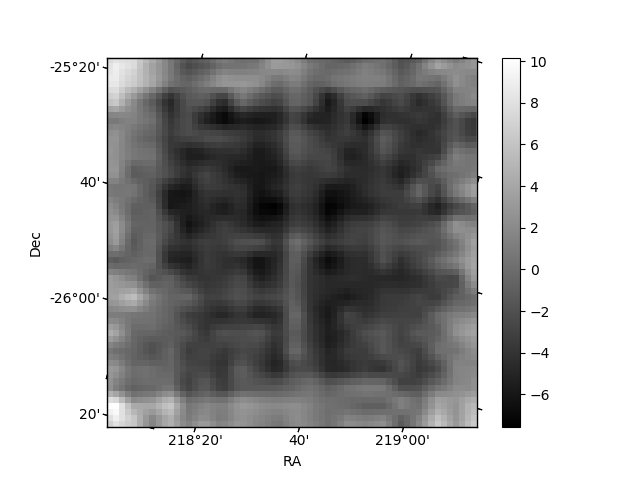
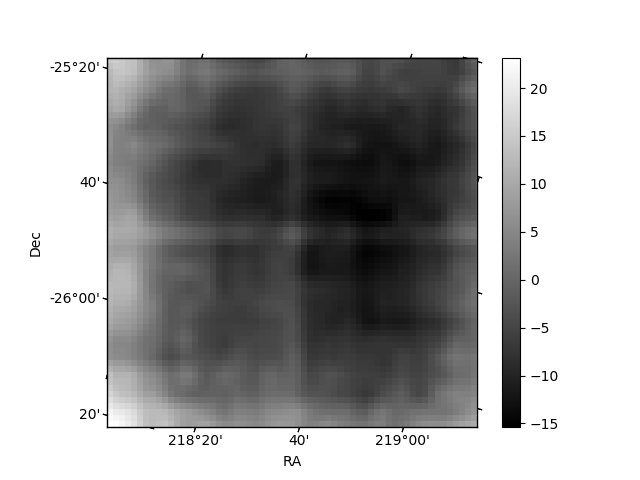
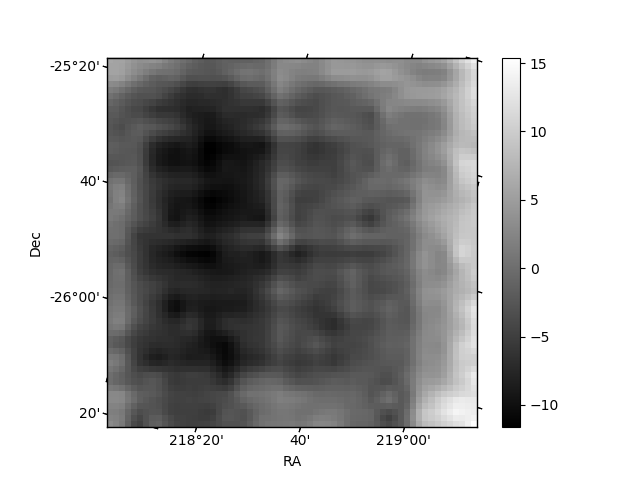
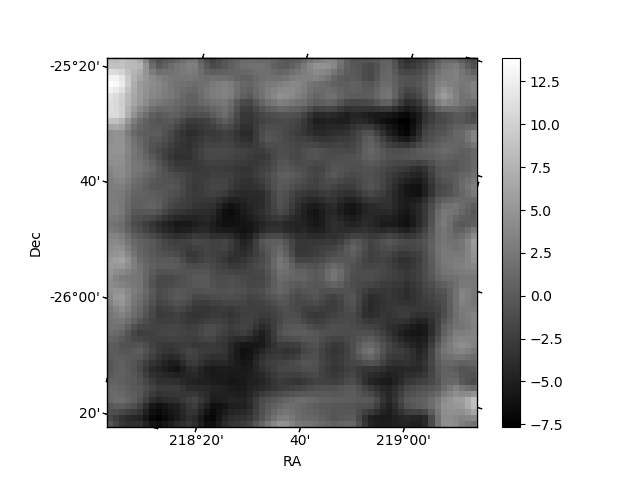
Histogram calculated using DETX and DETY for each event in the final _common_clean file
| Quadrant A | 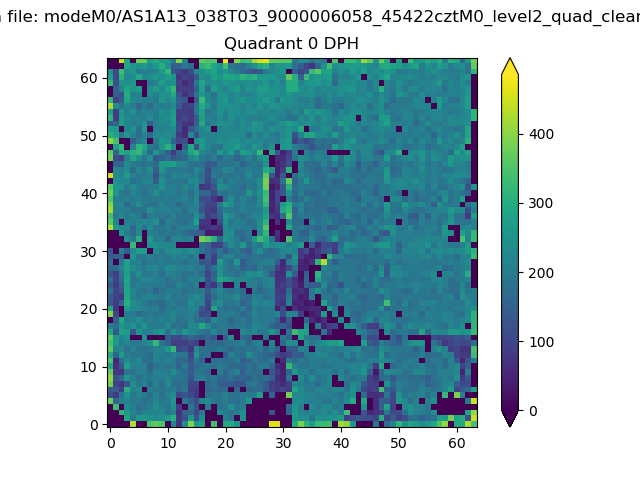 |
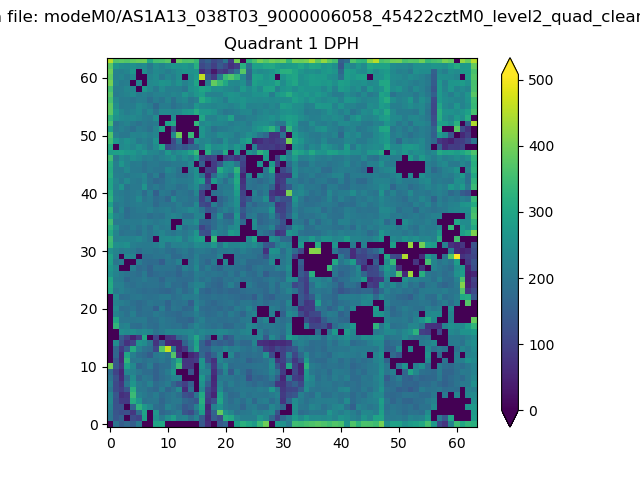 |
Quadrant B |
|---|---|---|---|
| Quadrant D | 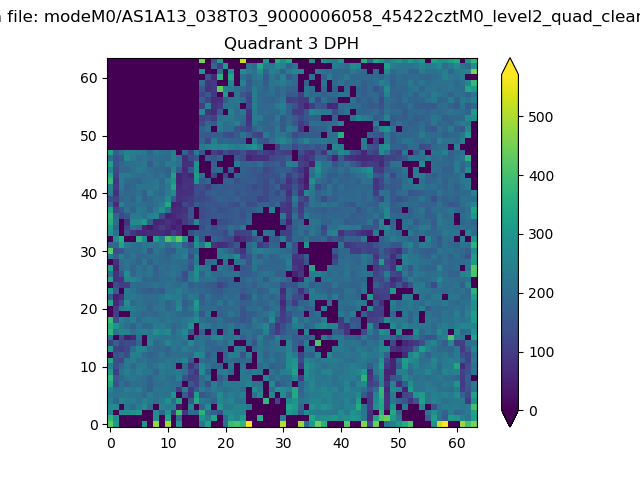 |
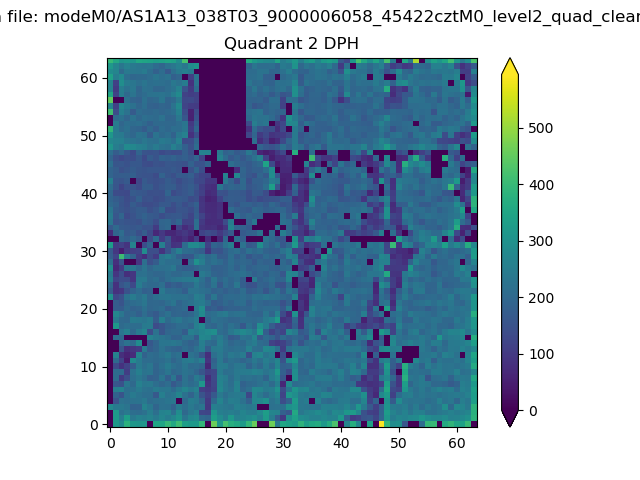 |
Quadrant C |
| Plot type | Count rate plots | Images |
|---|---|---|
| Comparison with Poisson distribution Blue bars denote a histogram of data divided into 1 sec bins. Red curve is a Poisson curve with rate = median count rate of data. |
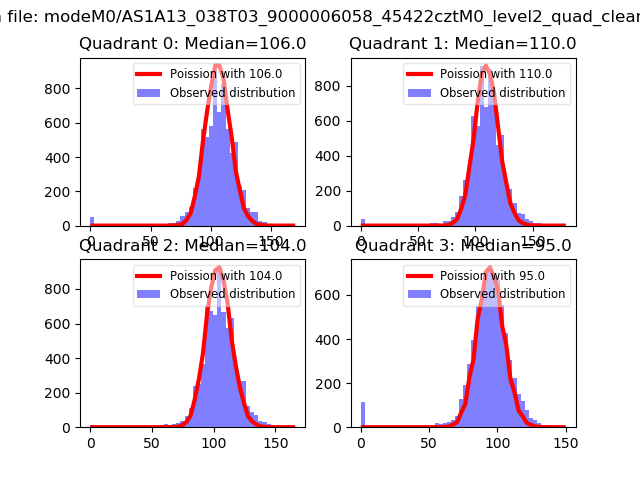 |
 |
| Quadrant-wise count rates Data is divided into 100 sec bins |
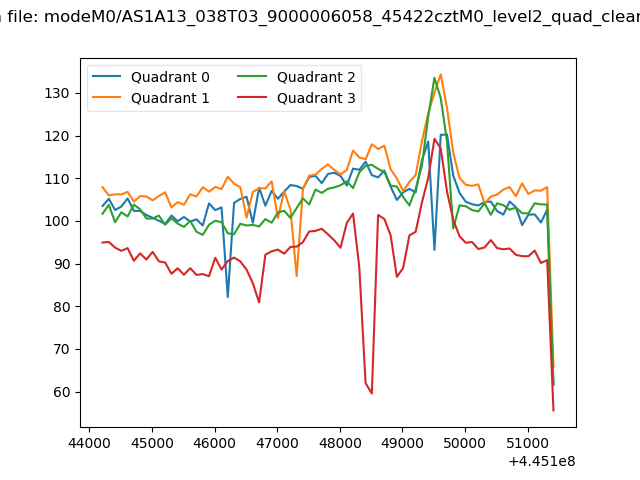 |
|
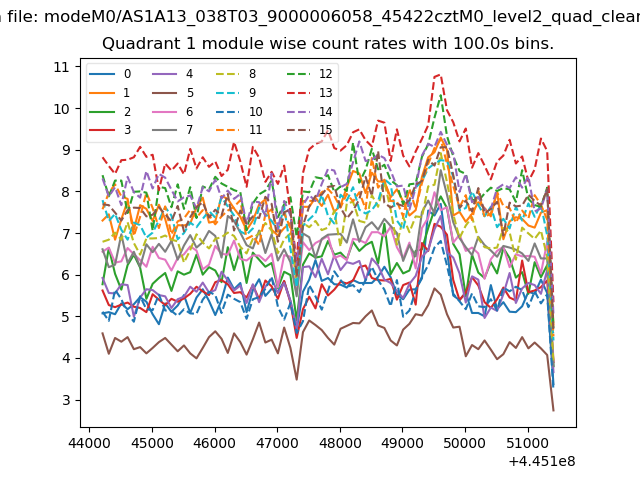
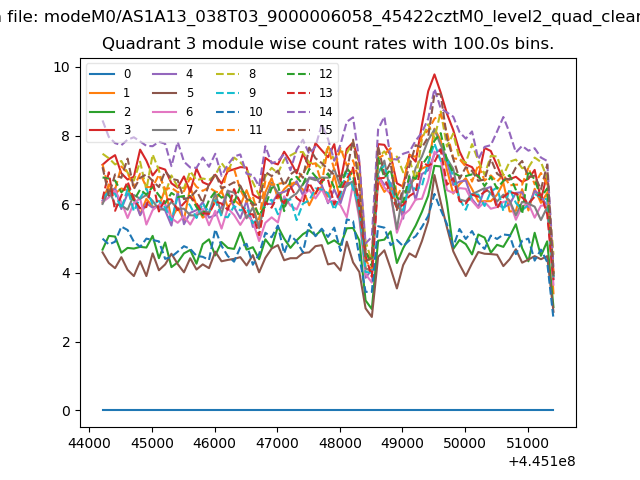
| Module-wise count rates for Quadrant A Data is divided into 100 sec bins |
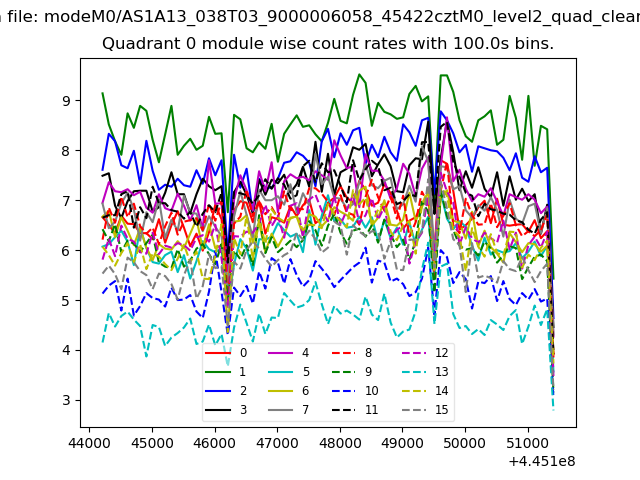 |
 |
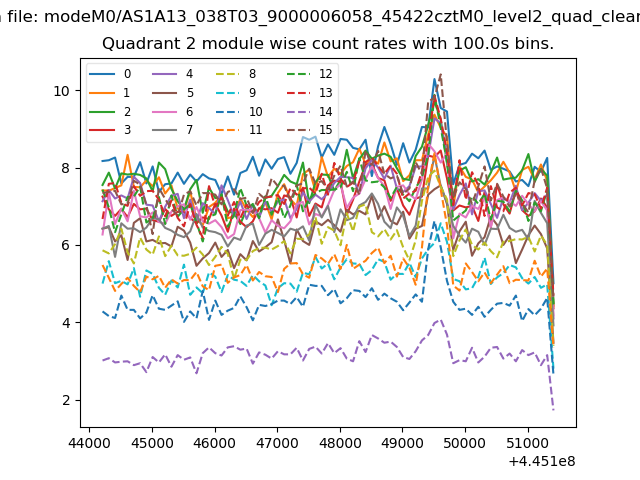
| Module-wise count rates for Quadrant B Data is divided into 100 sec bins |
 |
 |
| Module-wise count rates for Quadrant C Data is divided into 100 sec bins |
 |
 |
| Module-wise count rates for Quadrant D Data is divided into 100 sec bins |
 |
 |
| Parameter | Plot |
|---|---|
| CZT HV Monitor | 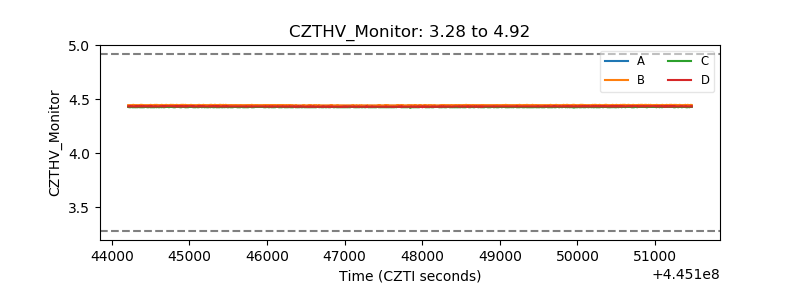 |
| D_VDD |  |
| Temperature 1 | 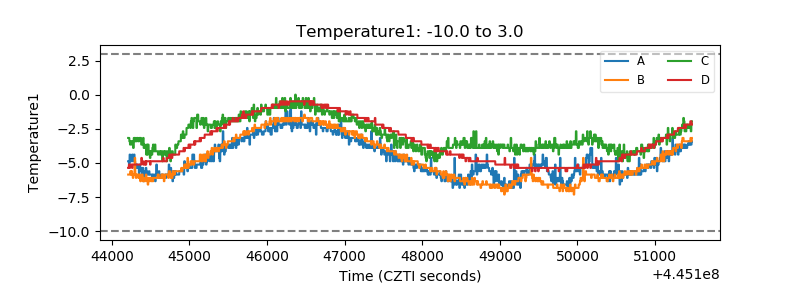 |
| Veto HV Monitor | 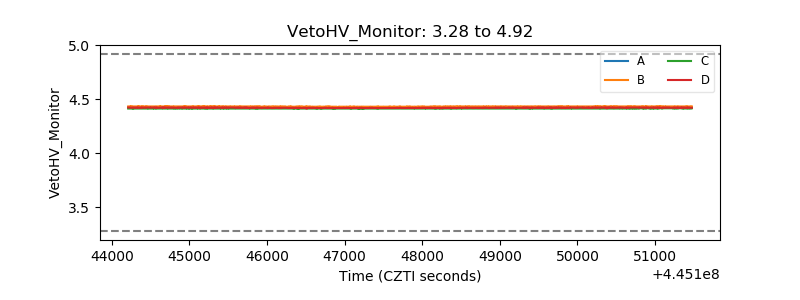 |
| Veto LLD | 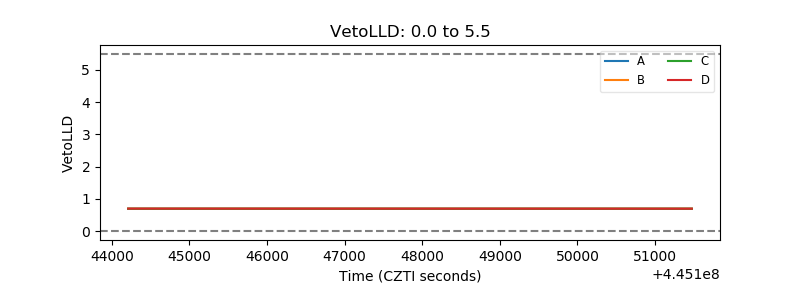 |
| Alpha Counter | 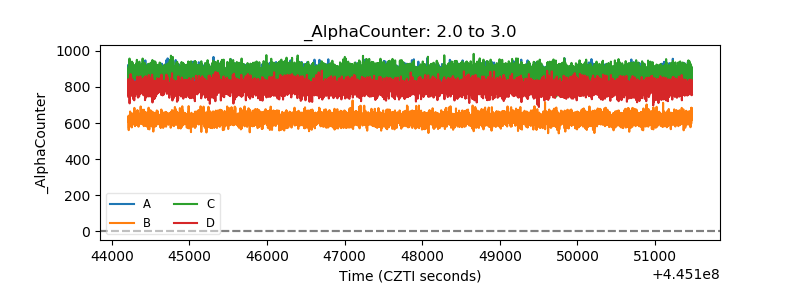 |
| _CPM_Rate | 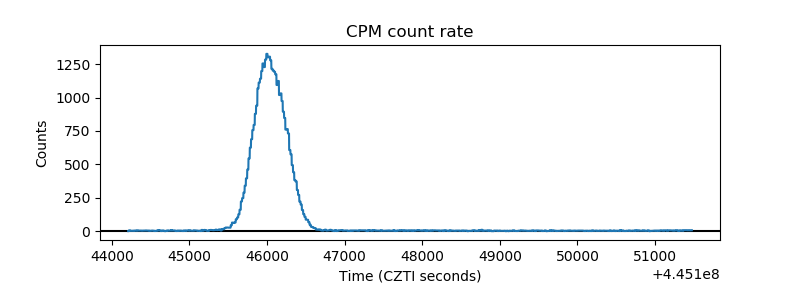 |
| CZT Counter | 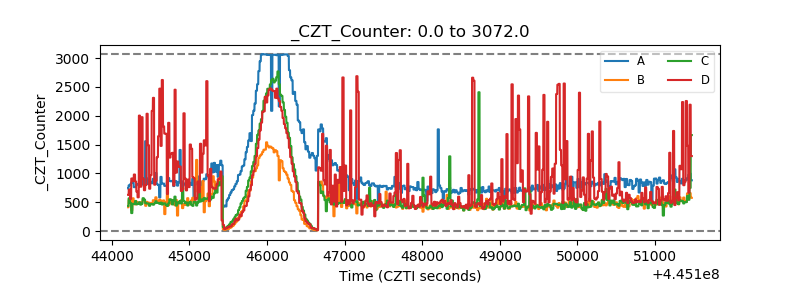 |
| +2.5 Volts monitor | 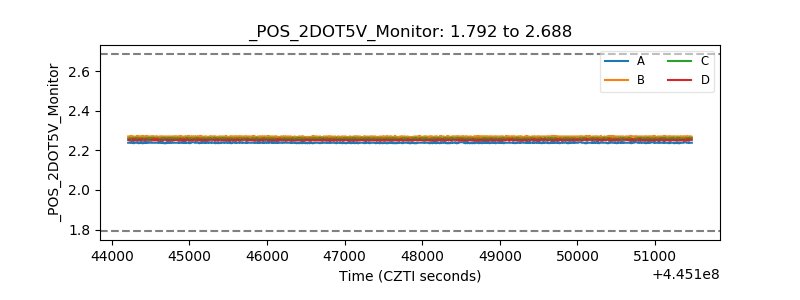 |
| +5 Volts monitor | 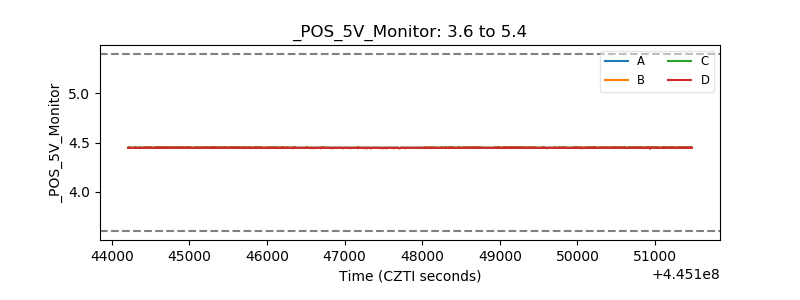 |
| _ROLL_ROT | 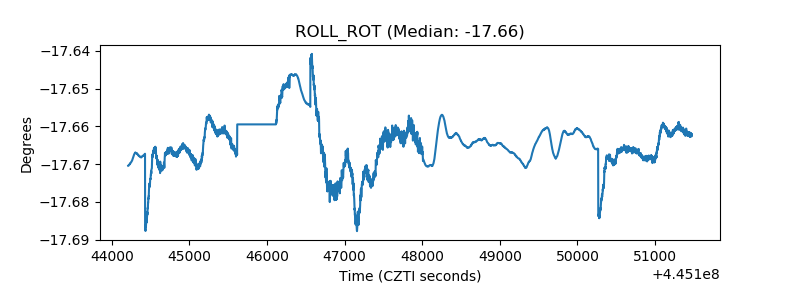 |
| _Roll_DEC | 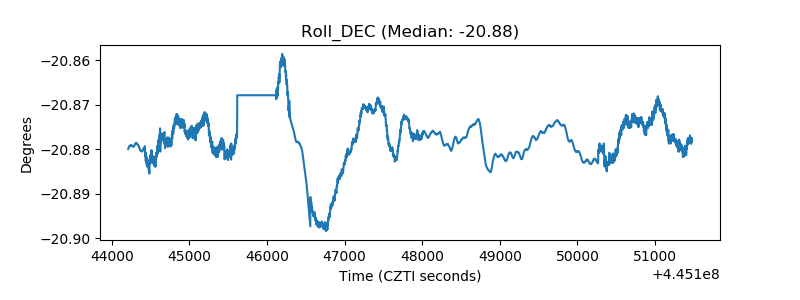 |
| _Roll_RA | 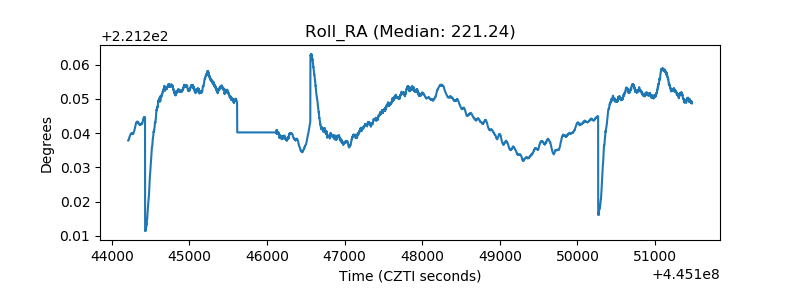 |
| Veto Counter | 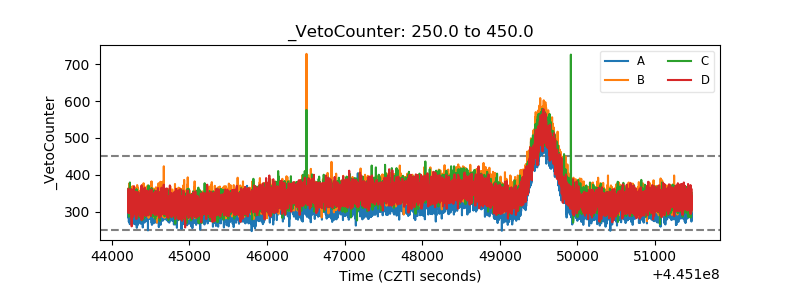 |