| Param | Original file | Final file |
|---|---|---|
| Filename | modeM0/AS1A13_038T03_9000006058_45424cztM0_level2.fits | modeM0/AS1A13_038T03_9000006058_45424cztM0_level2_quad_clean.evt |
| Size (bytes) | 279,797,760 | 64,779,840 |
| Size | 266.8 MB | 61.8 MB |
| Events in quadrant A | 3,280,743 | 431,812 |
| Events in quadrant B | 2,514,265 | 430,257 |
| Events in quadrant C | 1,789,517 | 421,693 |
| Events in quadrant D | 2,448,091 | 384,722 |
| Mode M0 | |||
|---|---|---|---|
| Quadrant | BADHDUFLAG | Total packets | Discarded packets |
| A | 0 | 12671 | 1 |
| B | 0 | 10446 | 0 |
| C | 0 | 8541 | 3 |
| D | 0 | 10084 | 0 |
| Mode SS | |||
|---|---|---|---|
| Quadrant | BADHDUFLAG | Total packets | Discarded packets |
| A | 0 | 82 | 0 |
| B | 0 | 82 | 0 |
| C | 0 | 82 | 0 |
| D | 0 | 82 | 0 |
| Quadrant | Total seconds | Saturated seconds | Saturation percentage |
|---|---|---|---|
| A | 4161 | 36 | 0.865177% |
| B | 4162 | 195 | 4.685247% |
| C | 4160 | 14 | 0.336538% |
| D | 4162 | 27 | 0.648727% |
Noise dominated data is calculated using 1-second bins in cleaned event files. If a bin has >2000 counts, and if more than 50% of those come from <1% of pixels, then it is considered to be noise-dominated and hence unusable.
| Quadrant | # 1 sec bins | Bins with >0 counts | Bins with >2000 counts | High rate bins dominated by noise | Noise dominated (total time) | Noise dominated (detector-on time) | Marked lightcurve |
|---|---|---|---|---|---|---|---|
| A | 4161 | 4161 | 23 | 23 | 0.55% | 0.55% | 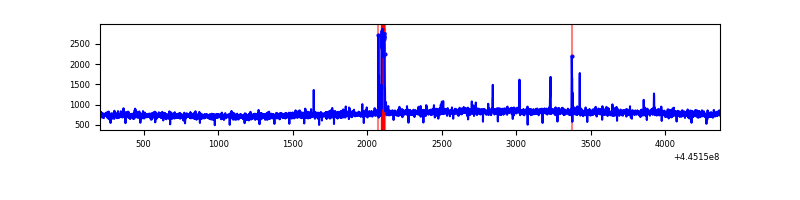 |
| B | 4162 | 4162 | 152 | 152 | 3.65% | 3.65% | 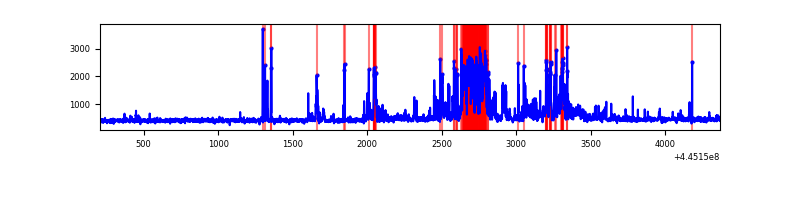 |
| C | 4162 | 4161 | 17 | 17 | 0.41% | 0.41% | 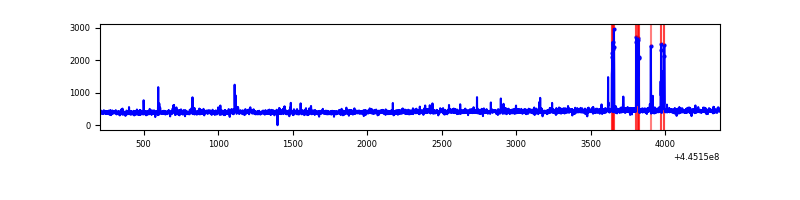 |
| D | 4162 | 4162 | 23 | 23 | 0.55% | 0.55% | 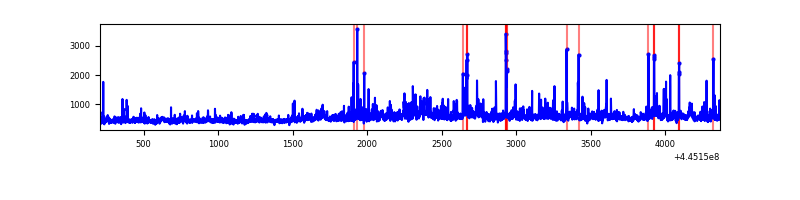 |
Top three noisy pixels from each quadrant. If the there are fewer than three noisy pixels in the level2.evt file, extra rows are filled as -1
| Pixel properties | Quadrant properties | ||||||
|---|---|---|---|---|---|---|---|
| Quadrant | DetID | PixID | Counts | Sigma | Mean | Median | Sigma |
| A | 10 | 83 | 1477455 | 15783.09 | 443 | 432 | 93.6 |
| A | 15 | 174 | 57923 | 614.33 | 443 | 432 | 93.6 |
| A | 2 | 79 | 28811 | 303.25 | 443 | 432 | 93.6 |
| B | 15 | 201 | 615307 | 7023.18 | 435 | 422 | 87.6 |
| B | 0 | 189 | 41224 | 466.04 | 435 | 422 | 87.6 |
| B | 4 | 170 | 28070 | 315.79 | 435 | 422 | 87.6 |
| C | 14 | 254 | 79798 | 769.77 | 434 | 435 | 103.1 |
| C | 11 | 16 | 5604 | 50.14 | 434 | 435 | 103.1 |
| C | 3 | 233 | 5195 | 46.17 | 434 | 435 | 103.1 |
| D | 11 | 241 | 259541 | 2338.33 | 435 | 422 | 110.8 |
| D | 1 | 52 | 252240 | 2272.45 | 435 | 422 | 110.8 |
| D | 5 | 222 | 114083 | 1025.69 | 435 | 422 | 110.8 |
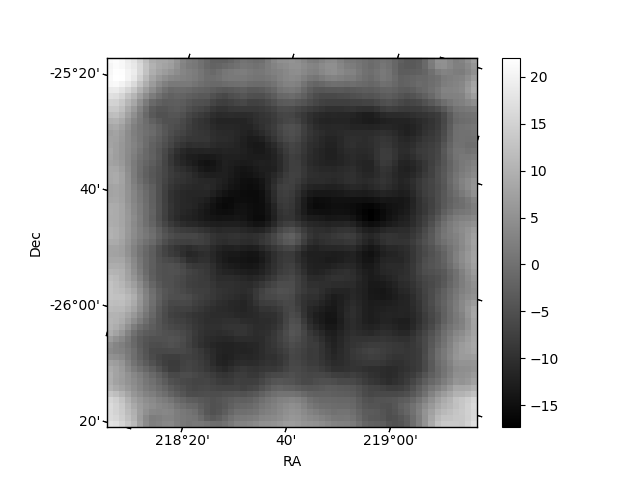
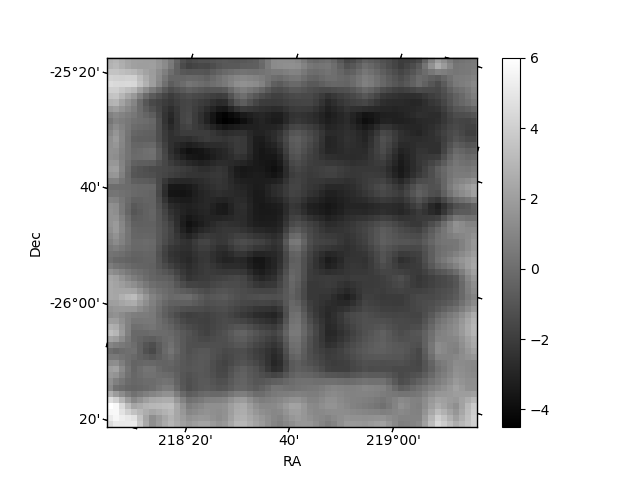
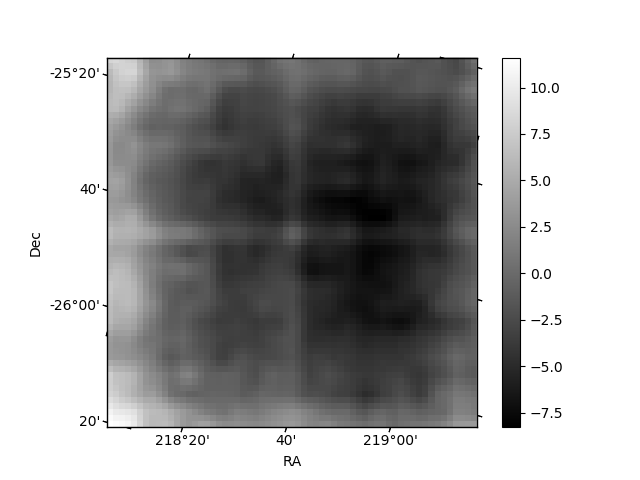
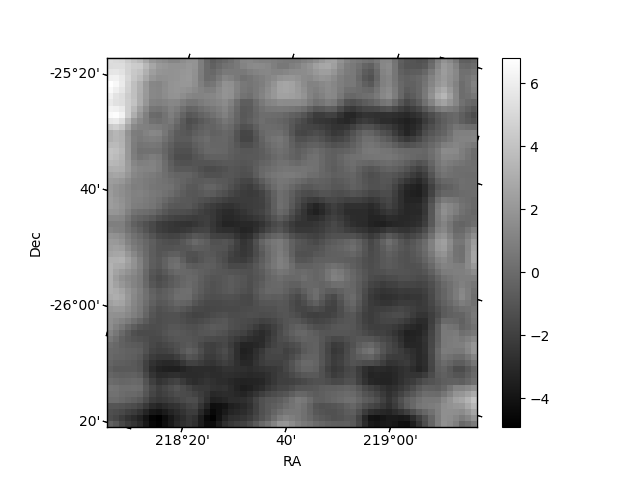
Histogram calculated using DETX and DETY for each event in the final _common_clean file
| Quadrant A | 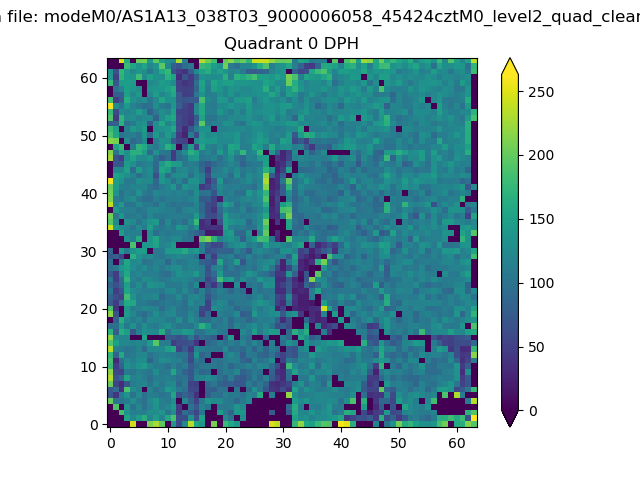 |
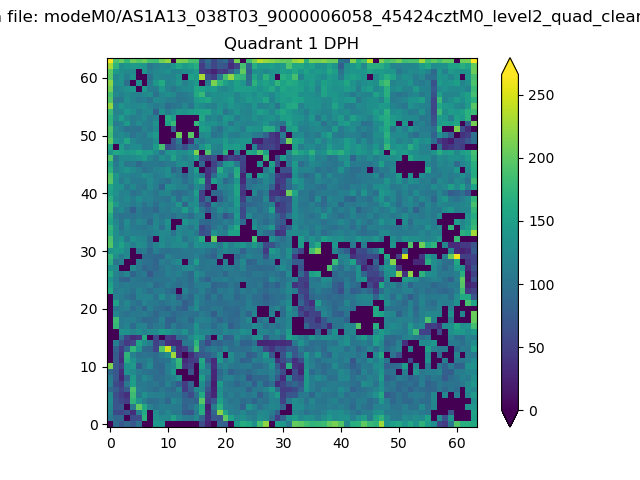 |
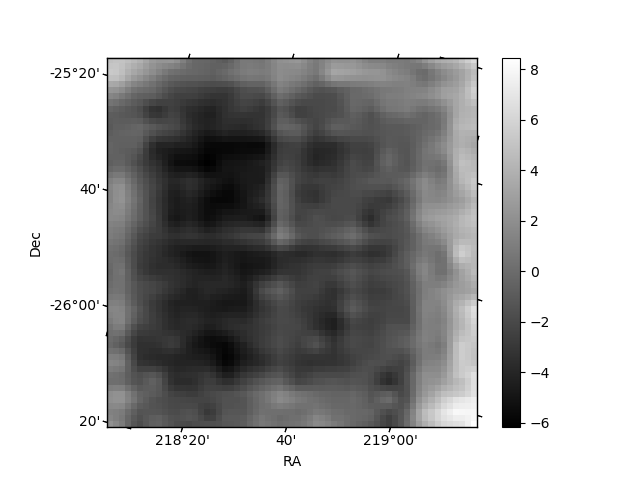
Quadrant B |
|---|---|---|---|
| Quadrant D | 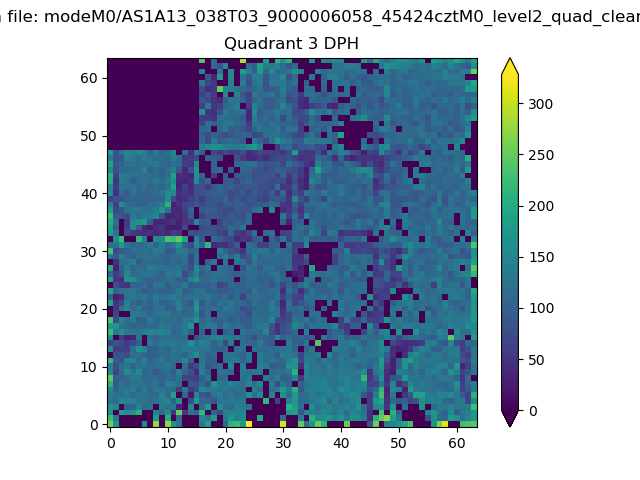 |
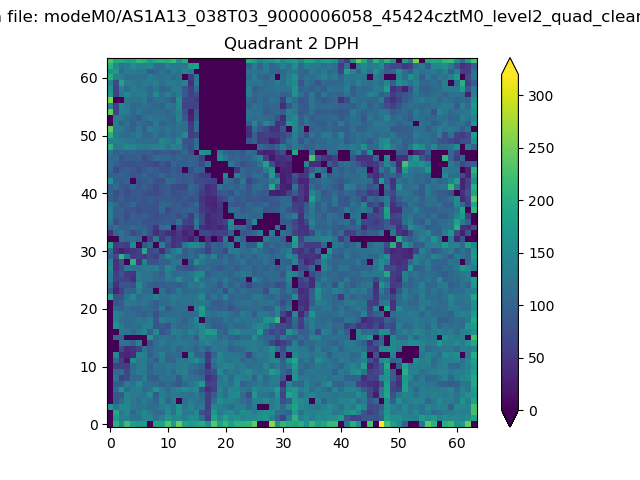 |
Quadrant C |
| Plot type | Count rate plots | Images |
|---|---|---|
| Comparison with Poisson distribution Blue bars denote a histogram of data divided into 1 sec bins. Red curve is a Poisson curve with rate = median count rate of data. |
 |
 |
| Quadrant-wise count rates Data is divided into 100 sec bins |
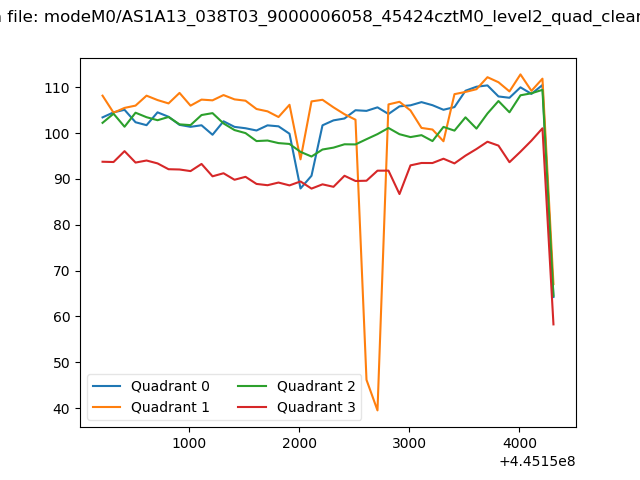 |
|
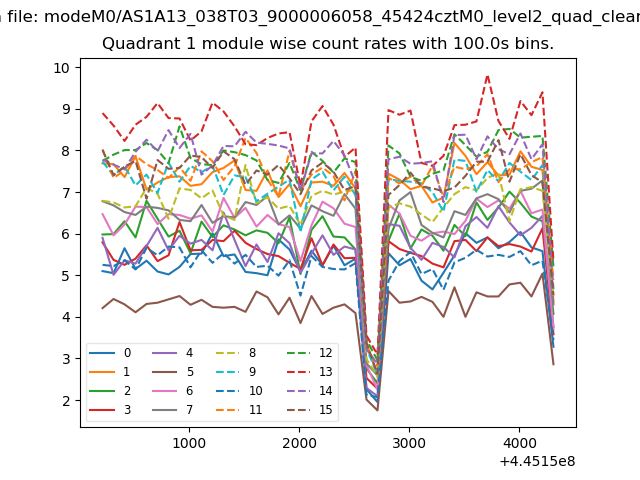
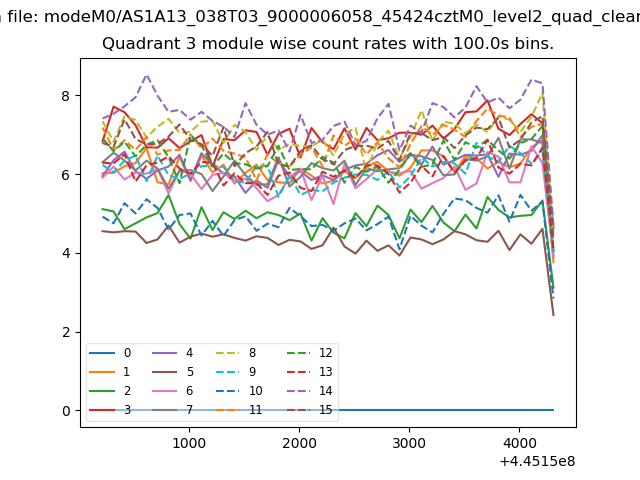
| Module-wise count rates for Quadrant A Data is divided into 100 sec bins |
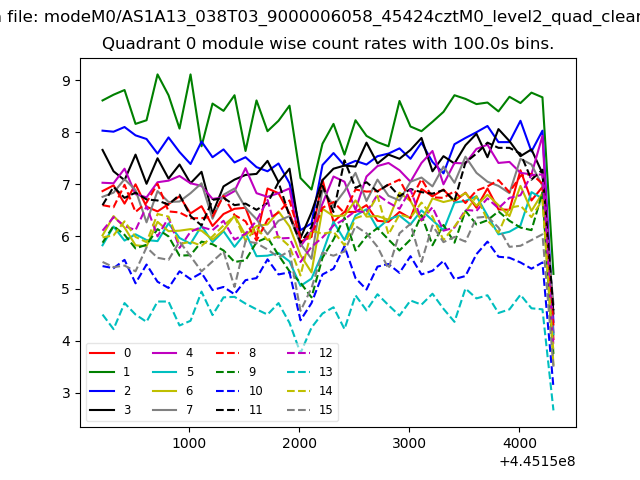 |
 |
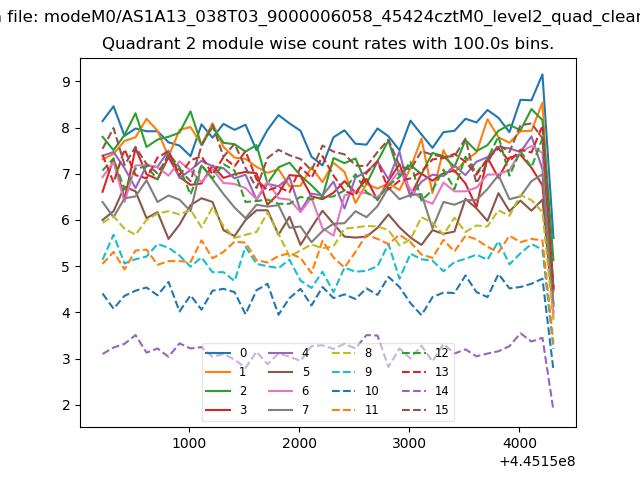
| Module-wise count rates for Quadrant B Data is divided into 100 sec bins |
 |
 |
| Module-wise count rates for Quadrant C Data is divided into 100 sec bins |
 |
 |
| Module-wise count rates for Quadrant D Data is divided into 100 sec bins |
 |
 |
| Parameter | Plot |
|---|---|
| CZT HV Monitor | 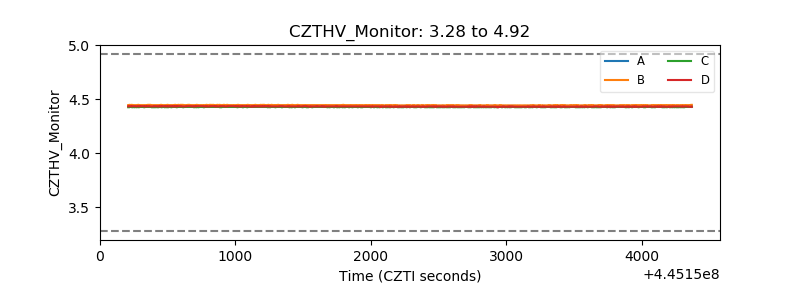 |
| D_VDD | 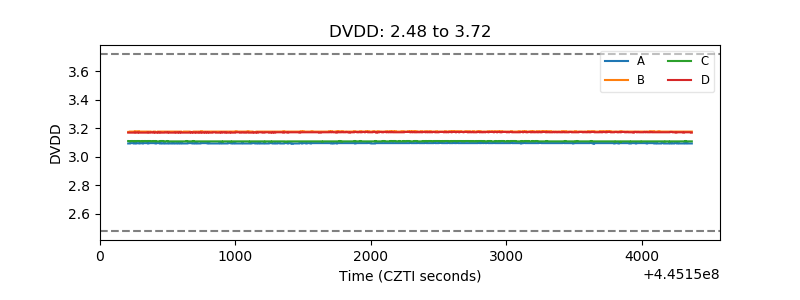 |
| Temperature 1 | 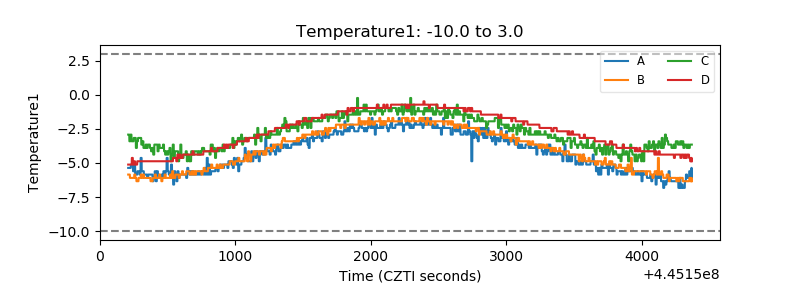 |
| Veto HV Monitor |  |
| Veto LLD | 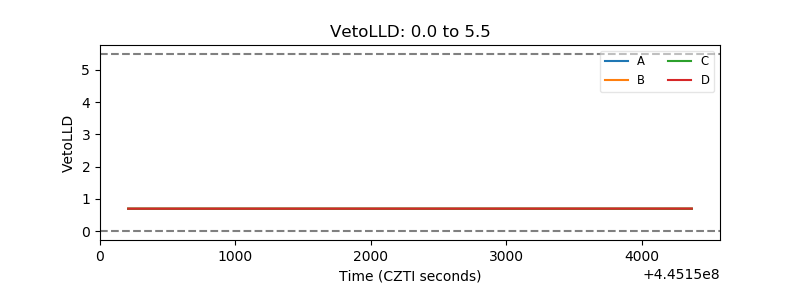 |
| Alpha Counter | 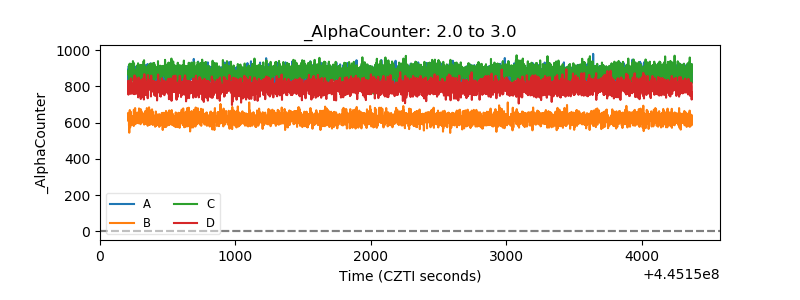 |
| _CPM_Rate | 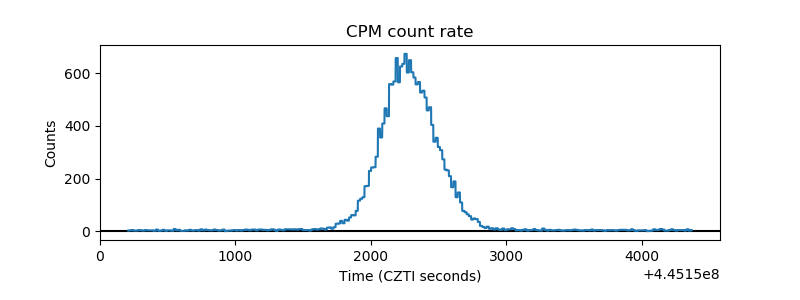 |
| CZT Counter | 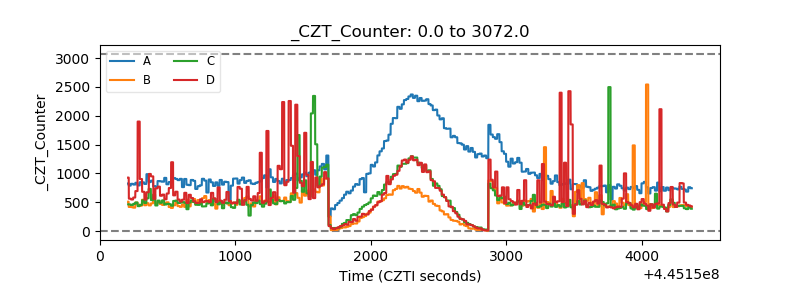 |
| +2.5 Volts monitor | 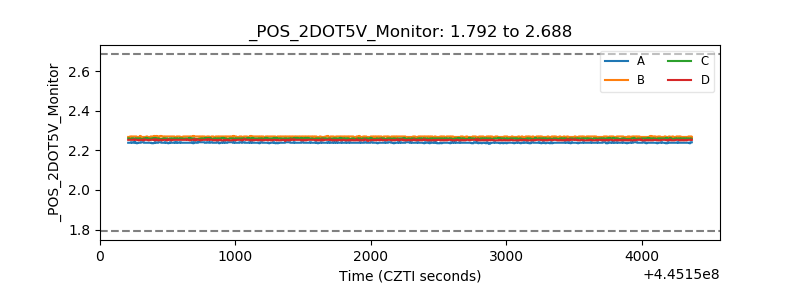 |
| +5 Volts monitor | 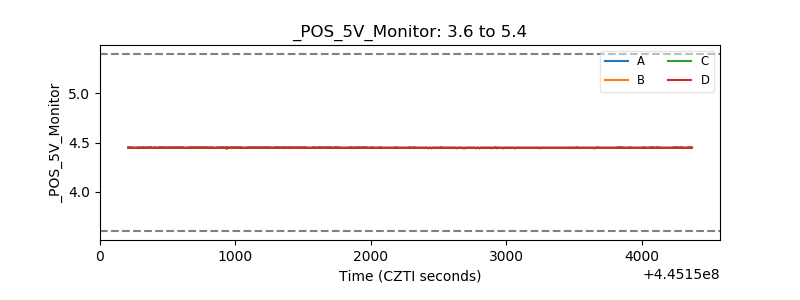 |
| _ROLL_ROT | 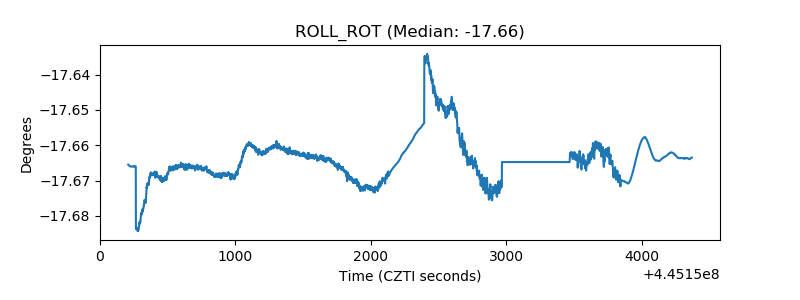 |
| _Roll_DEC | 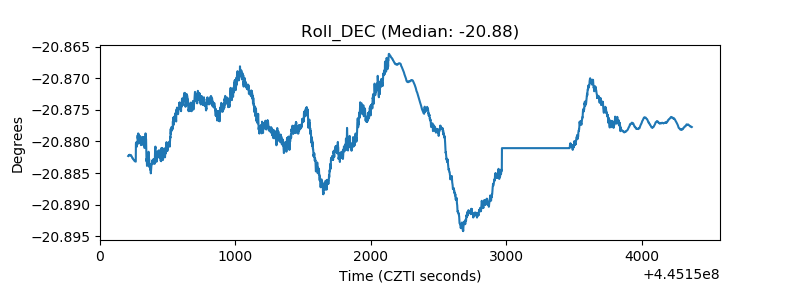 |
| _Roll_RA | 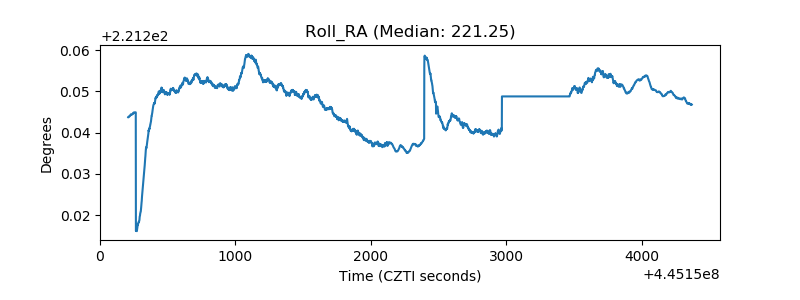 |
| Veto Counter | 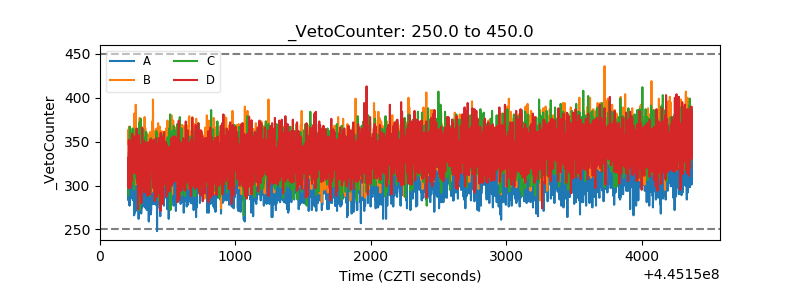 |