| Param | Original file | Final file |
|---|---|---|
| Filename | modeM0/AS1A13_009T01_9000006060_45246cztM0_level2.fits | modeM0/AS1A13_009T01_9000006060_45246cztM0_level2_quad_clean.evt |
| Size (bytes) | 200,214,720 | 40,711,680 |
| Size | 190.9 MB | 38.8 MB |
| Events in quadrant A | 2,105,231 | 268,507 |
| Events in quadrant B | 1,713,600 | 266,297 |
| Events in quadrant C | 1,504,657 | 270,734 |
| Events in quadrant D | 1,889,987 | 246,415 |
| Mode SS | |||
|---|---|---|---|
| Quadrant | BADHDUFLAG | Total packets | Discarded packets |
| A | 0 | 50 | 0 |
| B | 0 | 50 | 0 |
| C | 0 | 50 | 0 |
| D | 0 | 50 | 0 |
| Mode M0 | |||
|---|---|---|---|
| Quadrant | BADHDUFLAG | Total packets | Discarded packets |
| A | 0 | 8065 | 0 |
| B | 0 | 6737 | 0 |
| C | 0 | 6203 | 0 |
| D | 0 | 7307 | 0 |
| Quadrant | Total seconds | Saturated seconds | Saturation percentage |
|---|---|---|---|
| A | 2520 | 181 | 7.182540% |
| B | 2519 | 289 | 11.472807% |
| C | 2519 | 115 | 4.565304% |
| D | 2519 | 145 | 5.756252% |
Noise dominated data is calculated using 1-second bins in cleaned event files. If a bin has >2000 counts, and if more than 50% of those come from <1% of pixels, then it is considered to be noise-dominated and hence unusable.
| Quadrant | # 1 sec bins | Bins with >0 counts | Bins with >2000 counts | High rate bins dominated by noise | Noise dominated (total time) | Noise dominated (detector-on time) | Marked lightcurve |
|---|---|---|---|---|---|---|---|
| A | 2520 | 2520 | 1 | 1 | 0.04% | 0.04% | 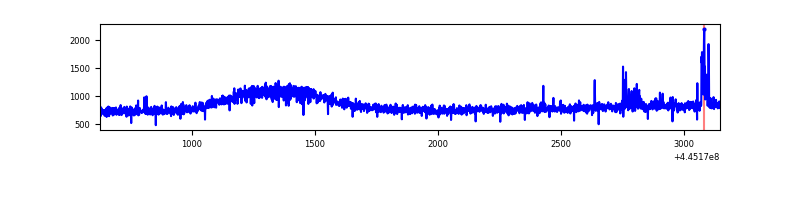 |
| B | 2519 | 2519 | 63 | 63 | 2.50% | 2.50% | 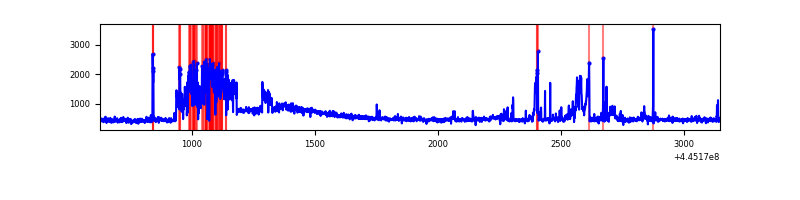 |
| C | 2519 | 2519 | 24 | 24 | 0.95% | 0.95% | 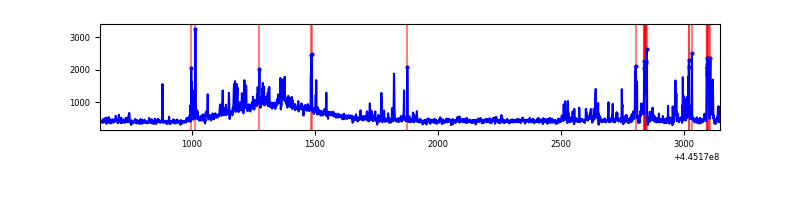 |
| D | 2519 | 2519 | 86 | 86 | 3.41% | 3.41% | 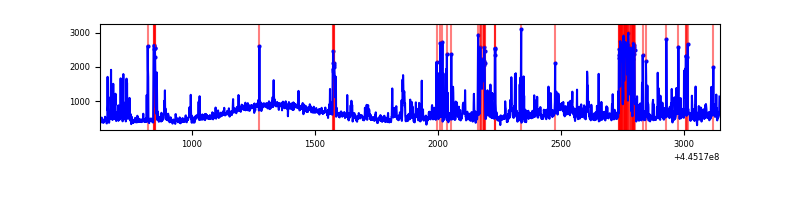 |
Top three noisy pixels from each quadrant. If the there are fewer than three noisy pixels in the level2.evt file, extra rows are filled as -1
| Pixel properties | Quadrant properties | ||||||
|---|---|---|---|---|---|---|---|
| Quadrant | DetID | PixID | Counts | Sigma | Mean | Median | Sigma |
| A | 10 | 83 | 804194 | 11134.05 | 328 | 320 | 72.2 |
| A | 13 | 248 | 32824 | 450.2 | 328 | 320 | 72.2 |
| A | 3 | 137 | 4109 | 52.48 | 328 | 320 | 72.2 |
| B | 5 | 32 | 355373 | 5208.4 | 317 | 306 | 68.2 |
| B | 15 | 36 | 64589 | 942.95 | 317 | 306 | 68.2 |
| B | 0 | 168 | 14465 | 207.7 | 317 | 306 | 68.2 |
| C | 14 | 254 | 186831 | 2370.11 | 321 | 321 | 78.7 |
| C | 15 | 208 | 19983 | 249.86 | 321 | 321 | 78.7 |
| C | 2 | 14 | 12047 | 149.01 | 321 | 321 | 78.7 |
| D | 5 | 235 | 152832 | 1821.22 | 323 | 311 | 83.7 |
| D | 11 | 241 | 92970 | 1106.42 | 323 | 311 | 83.7 |
| D | 13 | 249 | 89453 | 1064.42 | 323 | 311 | 83.7 |
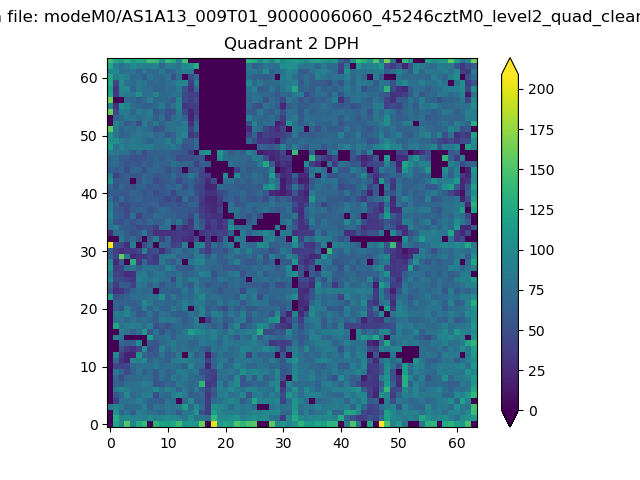
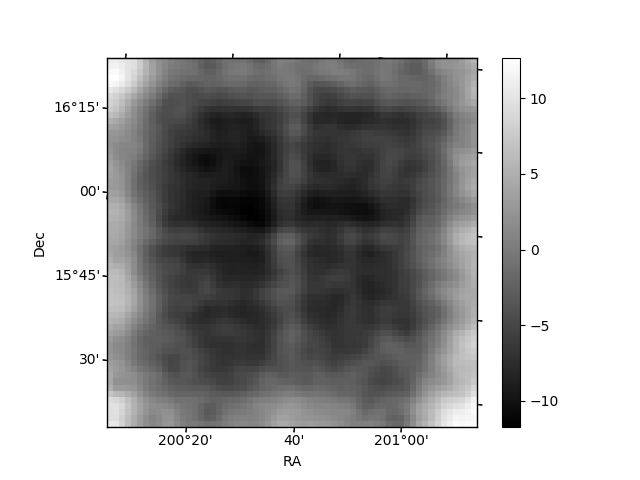
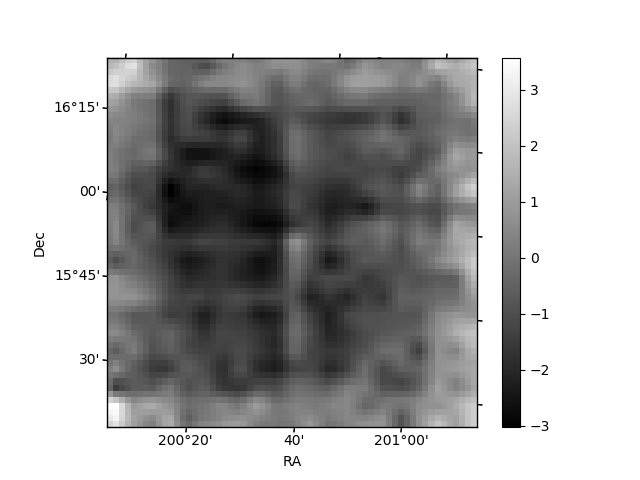
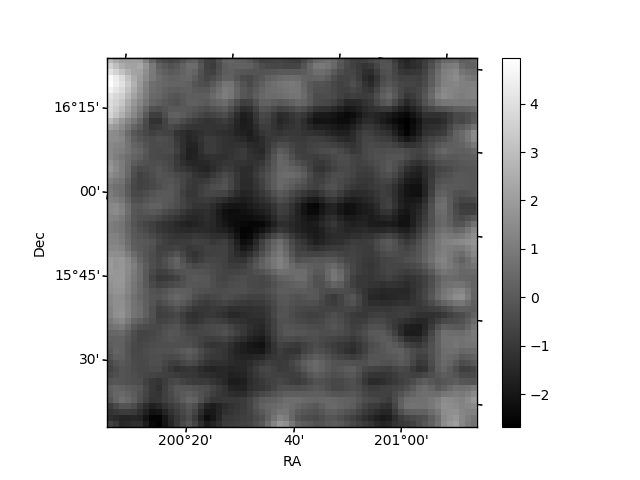
Histogram calculated using DETX and DETY for each event in the final _common_clean file
| Quadrant A | 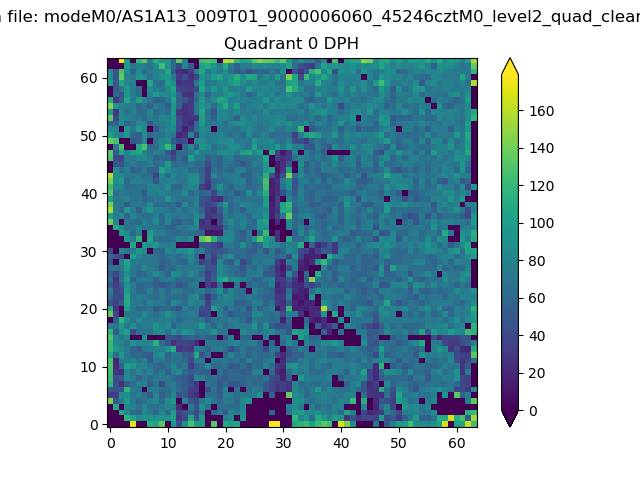 |
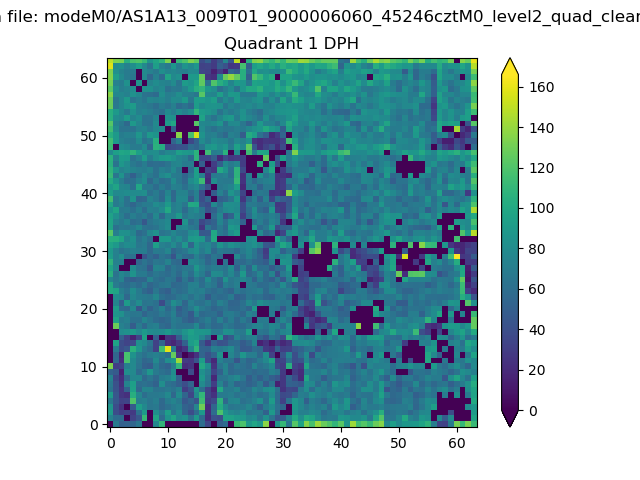 |
Quadrant B |
|---|---|---|---|
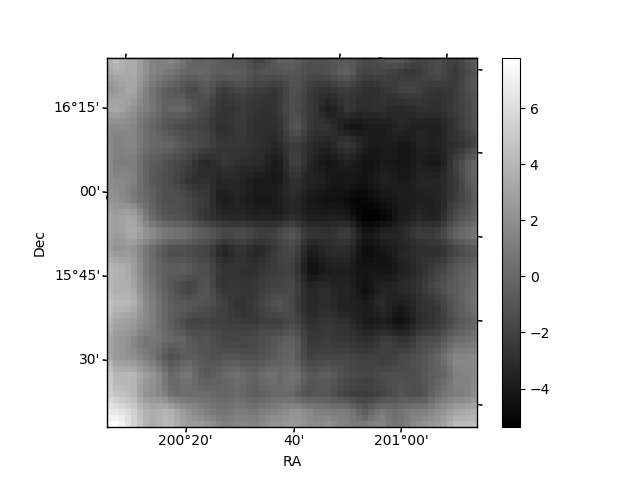
| Quadrant D | 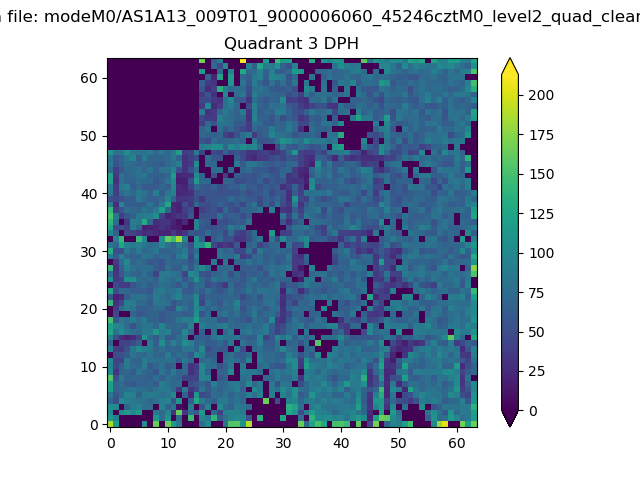 |
 |
Quadrant C |
| Plot type | Count rate plots | Images |
|---|---|---|
| Comparison with Poisson distribution Blue bars denote a histogram of data divided into 1 sec bins. Red curve is a Poisson curve with rate = median count rate of data. |
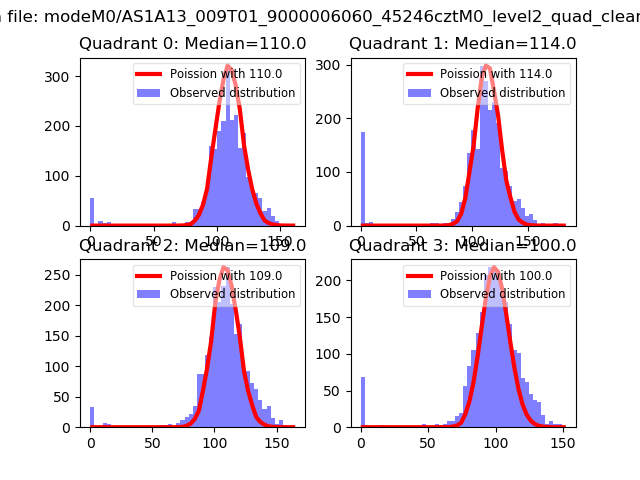 |
 |
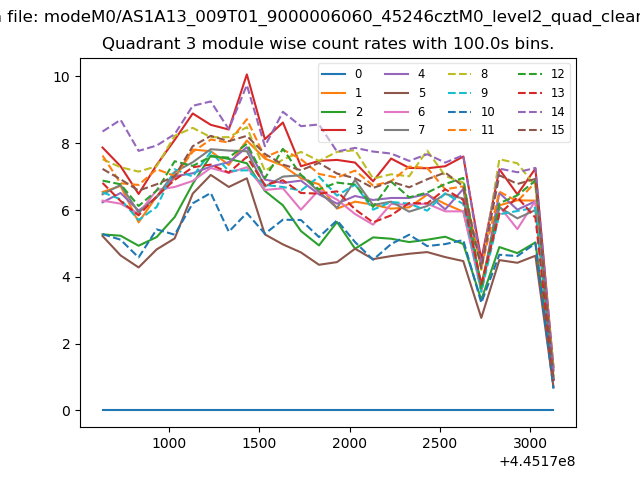
| Quadrant-wise count rates Data is divided into 100 sec bins |
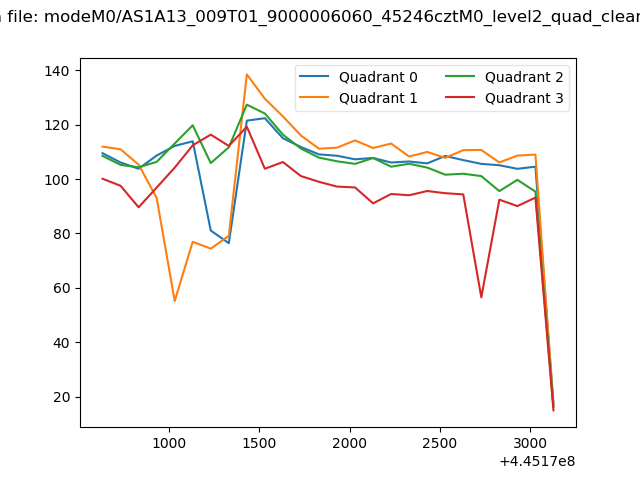 |
|
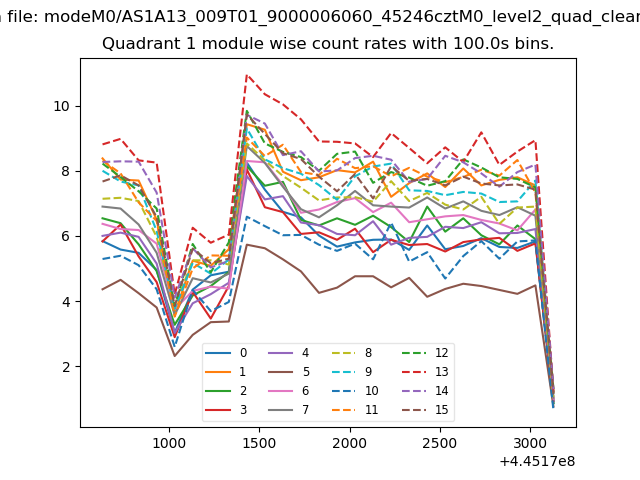
| Module-wise count rates for Quadrant A Data is divided into 100 sec bins |
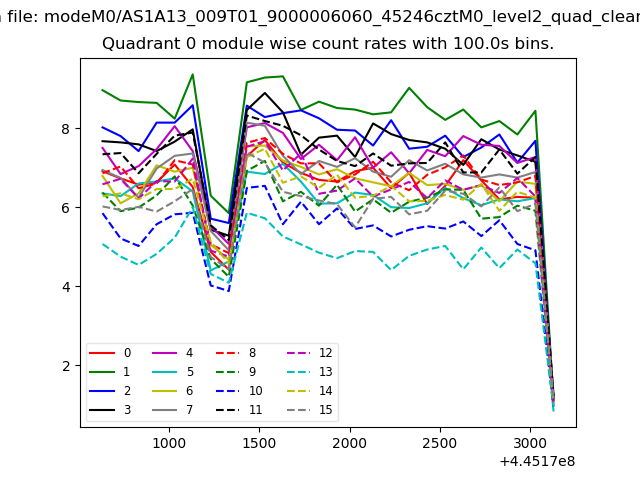 |
 |
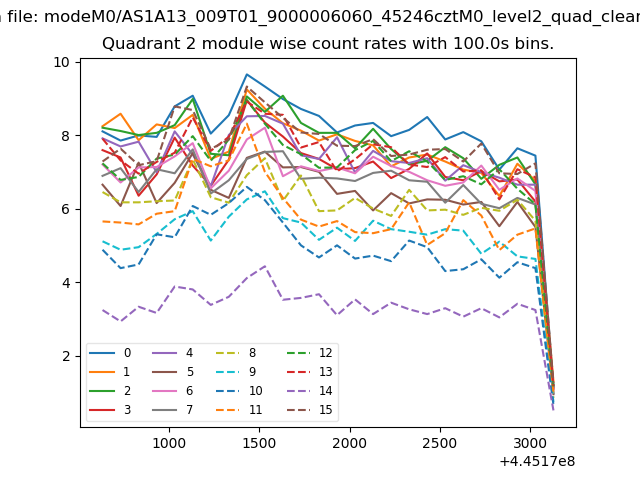
| Module-wise count rates for Quadrant B Data is divided into 100 sec bins |
 |
 |
| Module-wise count rates for Quadrant C Data is divided into 100 sec bins |
 |
 |
| Module-wise count rates for Quadrant D Data is divided into 100 sec bins |
 |
 |
| Parameter | Plot |
|---|---|
| CZT HV Monitor | 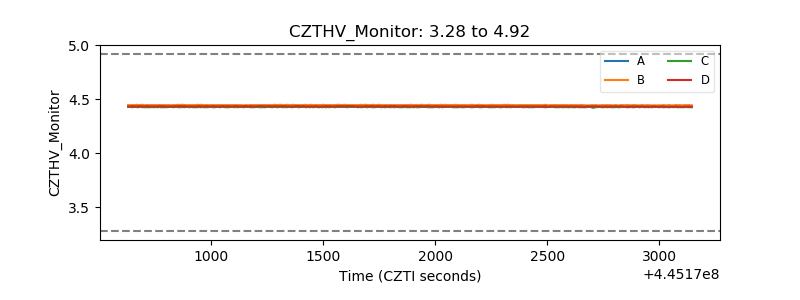 |
| D_VDD | 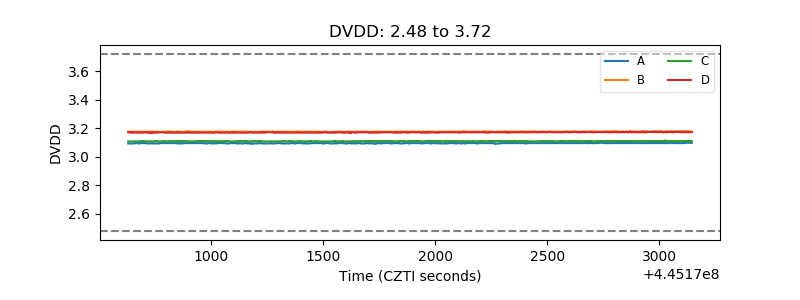 |
| Temperature 1 | 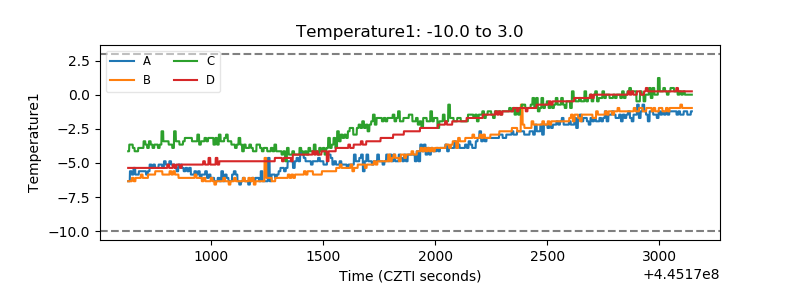 |
| Veto HV Monitor | 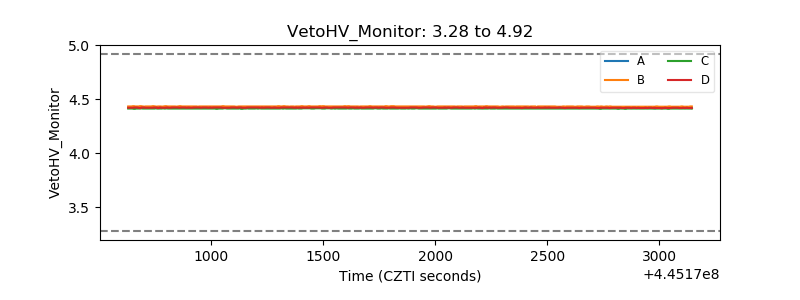 |
| Veto LLD | 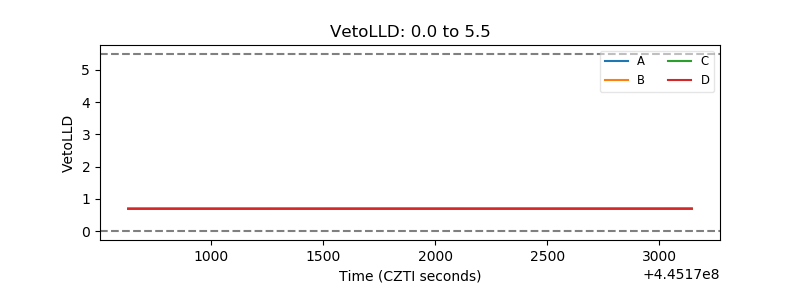 |
| Alpha Counter | 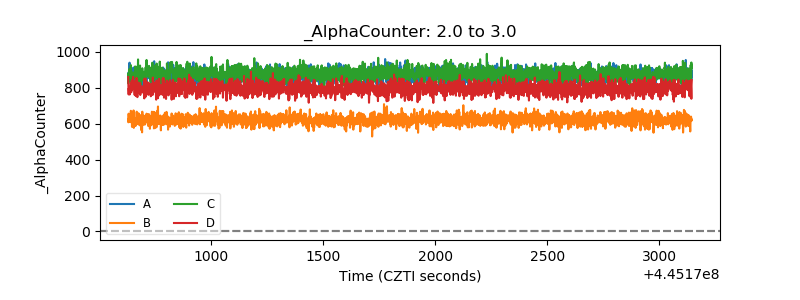 |
| _CPM_Rate | 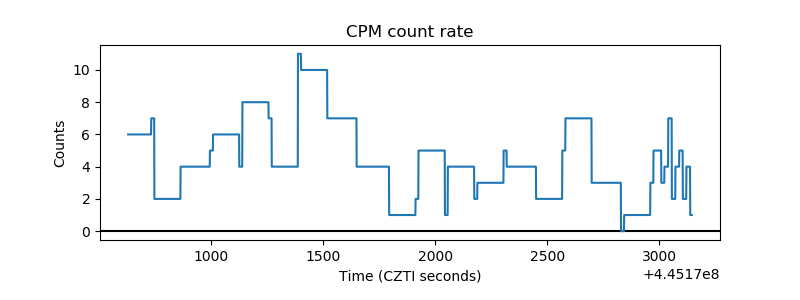 |
| CZT Counter | 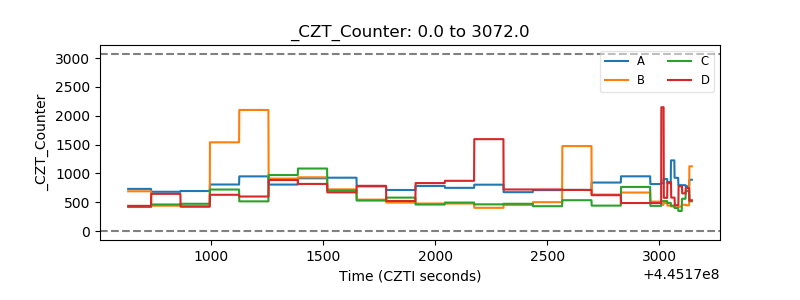 |
| +2.5 Volts monitor |  |
| +5 Volts monitor |  |
| _ROLL_ROT | 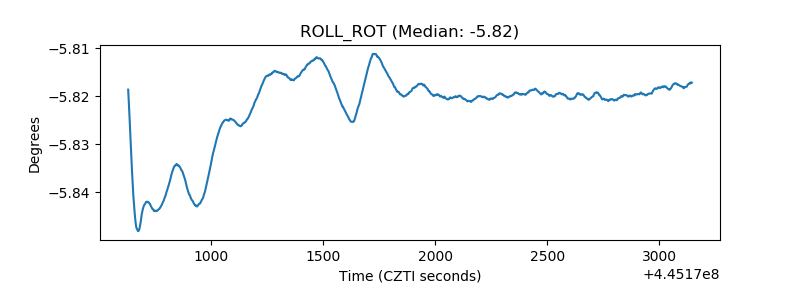 |
| _Roll_DEC | 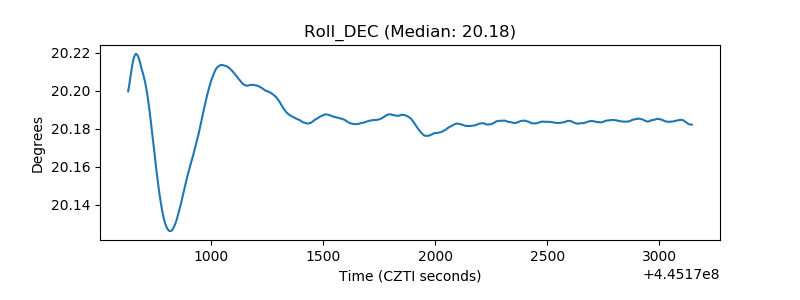 |
| _Roll_RA | 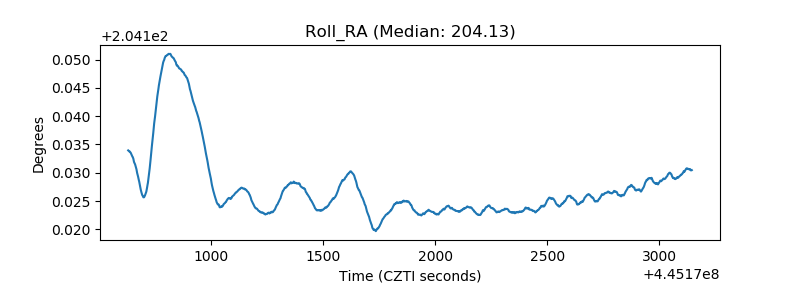 |
| Veto Counter | 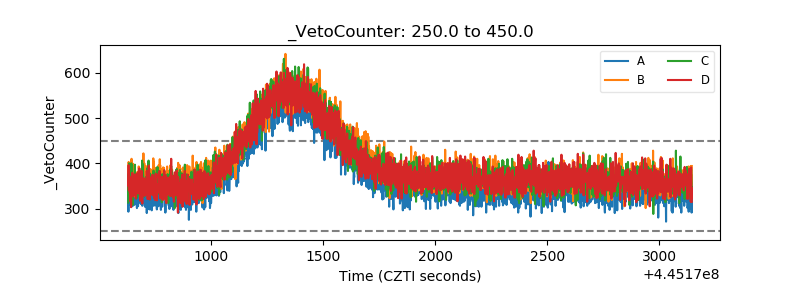 |