| Param | Original file | Final file |
|---|---|---|
| Filename | modeM0/AS1A13_009T01_9000006060_45251cztM0_level2.fits | modeM0/AS1A13_009T01_9000006060_45251cztM0_level2_quad_clean.evt |
| Size (bytes) | 1,062,132,480 | 191,327,040 |
| Size | 1012.9 MB | 182.5 MB |
| Events in quadrant A | 10,668,260 | 1,292,932 |
| Events in quadrant B | 6,246,582 | 1,361,134 |
| Events in quadrant C | 6,275,937 | 1,303,915 |
| Events in quadrant D | 15,150,451 | 961,733 |
| Mode SS | |||
|---|---|---|---|
| Quadrant | BADHDUFLAG | Total packets | Discarded packets |
| A | 0 | 258 | 0 |
| B | 0 | 258 | 0 |
| C | 0 | 258 | 0 |
| D | 0 | 258 | 0 |
| Mode M9 | |||
|---|---|---|---|
| Quadrant | BADHDUFLAG | Total packets | Discarded packets |
| A | 0 | 10 | 0 |
| B | 0 | 10 | 0 |
| C | 0 | 10 | 0 |
| D | 0 | 10 | 0 |
| Mode M0 | |||
|---|---|---|---|
| Quadrant | BADHDUFLAG | Total packets | Discarded packets |
| A | 0 | 40710 | 2 |
| B | 0 | 27018 | 2 |
| C | 0 | 27605 | 2 |
| D | 0 | 53753 | 10 |
| Quadrant | Total seconds | Saturated seconds | Saturation percentage |
|---|---|---|---|
| A | 12619 | 425 | 3.367937% |
| B | 12619 | 165 | 1.307552% |
| C | 12620 | 221 | 1.751189% |
| D | 12617 | 2876 | 22.794642% |
Noise dominated data is calculated using 1-second bins in cleaned event files. If a bin has >2000 counts, and if more than 50% of those come from <1% of pixels, then it is considered to be noise-dominated and hence unusable.
| Quadrant | # 1 sec bins | Bins with >0 counts | Bins with >2000 counts | High rate bins dominated by noise | Noise dominated (total time) | Noise dominated (detector-on time) | Marked lightcurve |
|---|---|---|---|---|---|---|---|
| A | 13634 | 12620 | 138 | 138 | 1.01% | 1.09% | 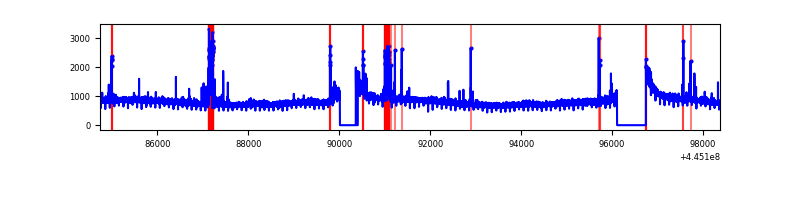 |
| B | 13634 | 12619 | 63 | 63 | 0.46% | 0.50% | 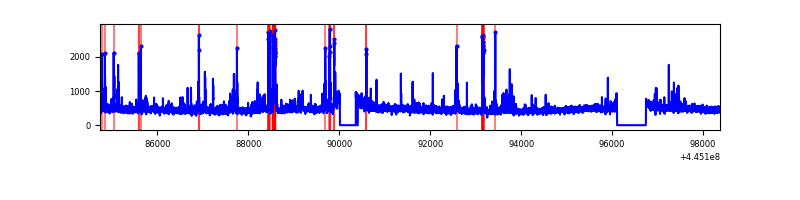 |
| C | 13635 | 12621 | 113 | 113 | 0.83% | 0.90% | 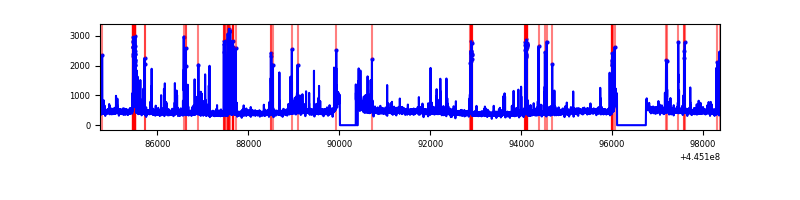 |
| D | 13635 | 12619 | 2621 | 2621 | 19.22% | 20.77% | 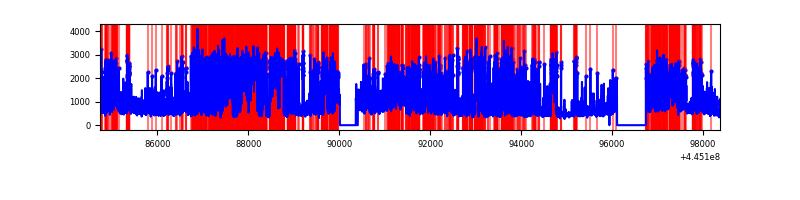 |
Top three noisy pixels from each quadrant. If the there are fewer than three noisy pixels in the level2.evt file, extra rows are filled as -1
| Pixel properties | Quadrant properties | ||||||
|---|---|---|---|---|---|---|---|
| Quadrant | DetID | PixID | Counts | Sigma | Mean | Median | Sigma |
| A | 10 | 83 | 4706283 | 16082.79 | 1412 | 1379 | 292.5 |
| A | 13 | 248 | 448270 | 1527.61 | 1412 | 1379 | 292.5 |
| A | 0 | 243 | 36373 | 119.62 | 1412 | 1379 | 292.5 |
| B | 12 | 3 | 198626 | 704.3 | 1422 | 1380 | 280.1 |
| B | 5 | 32 | 192366 | 681.94 | 1422 | 1380 | 280.1 |
| B | 12 | 16 | 42509 | 146.86 | 1422 | 1380 | 280.1 |
| C | 14 | 254 | 646020 | 1948.13 | 1398 | 1404 | 330.9 |
| C | 1 | 3 | 77545 | 230.11 | 1398 | 1404 | 330.9 |
| C | 12 | 250 | 25809 | 73.76 | 1398 | 1404 | 330.9 |
| D | 12 | 17 | 4050879 | 12576.95 | 1267 | 1227 | 322.0 |
| D | 13 | 249 | 2020461 | 6271.11 | 1267 | 1227 | 322.0 |
| D | 11 | 241 | 1601463 | 4969.83 | 1267 | 1227 | 322.0 |
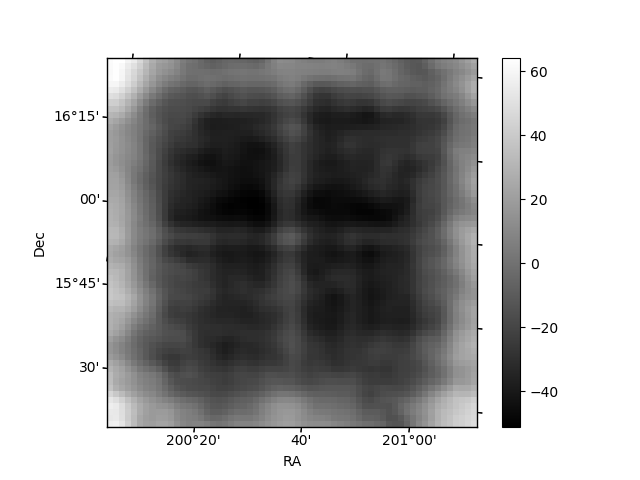
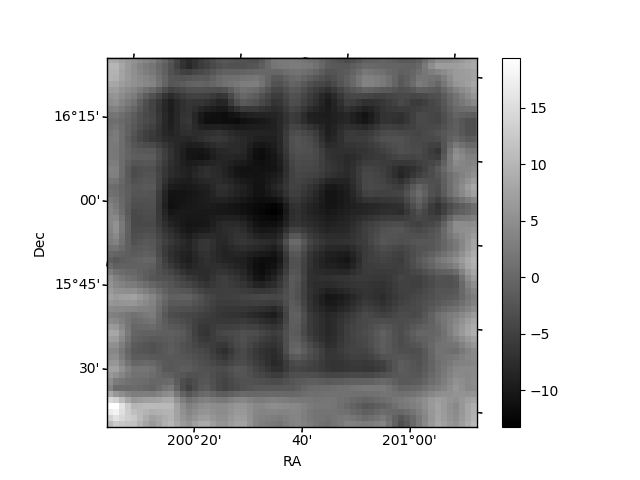
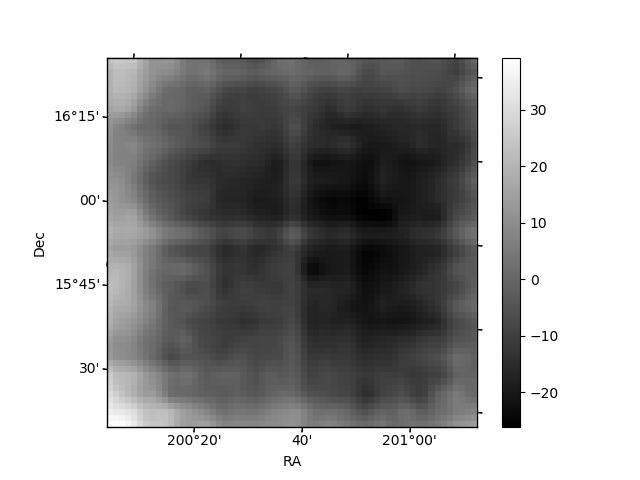
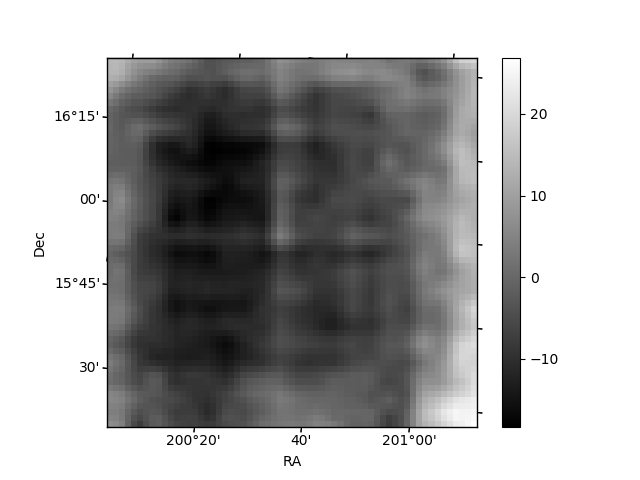
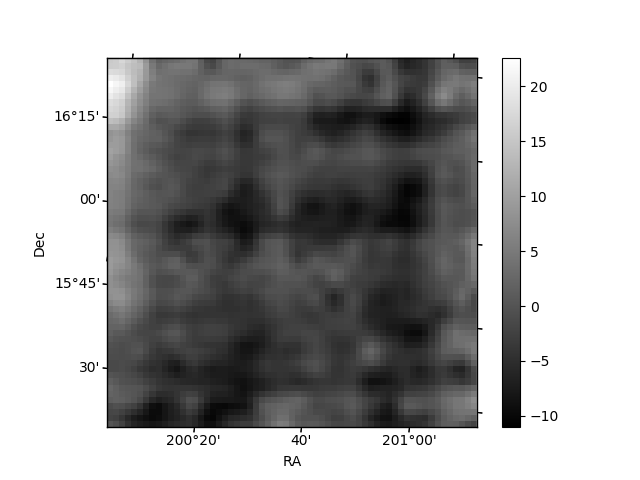
Histogram calculated using DETX and DETY for each event in the final _common_clean file
| Quadrant A | 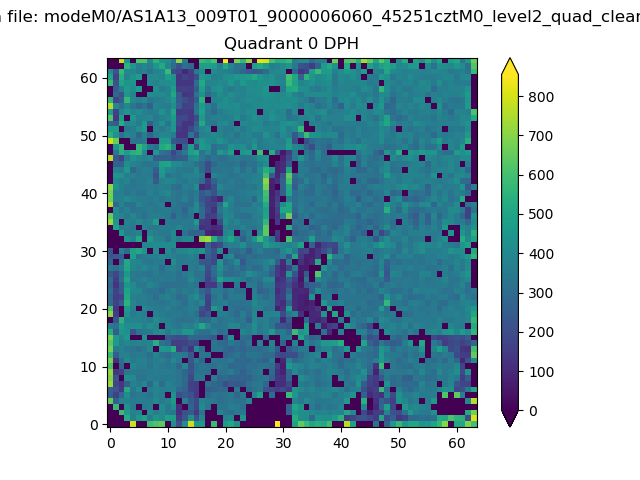 |
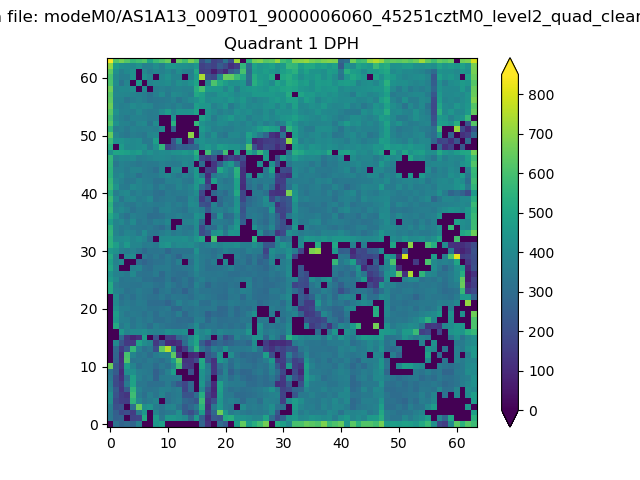 |
Quadrant B |
|---|---|---|---|
| Quadrant D | 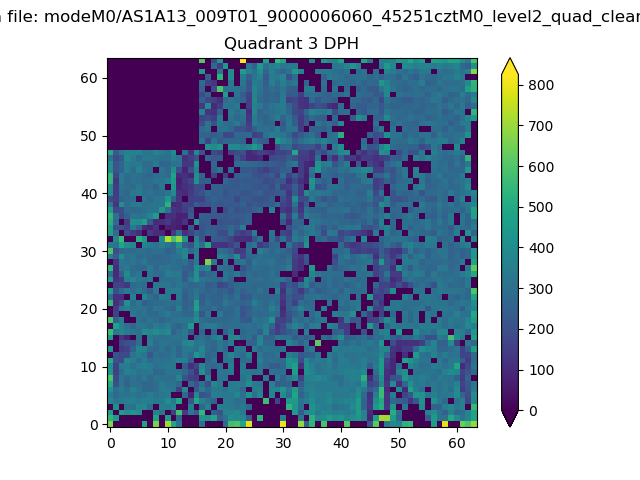 |
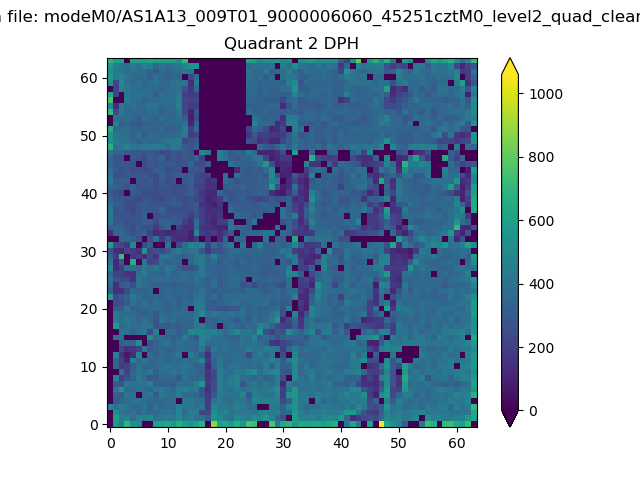 |
Quadrant C |
| Plot type | Count rate plots | Images |
|---|---|---|
| Comparison with Poisson distribution Blue bars denote a histogram of data divided into 1 sec bins. Red curve is a Poisson curve with rate = median count rate of data. |
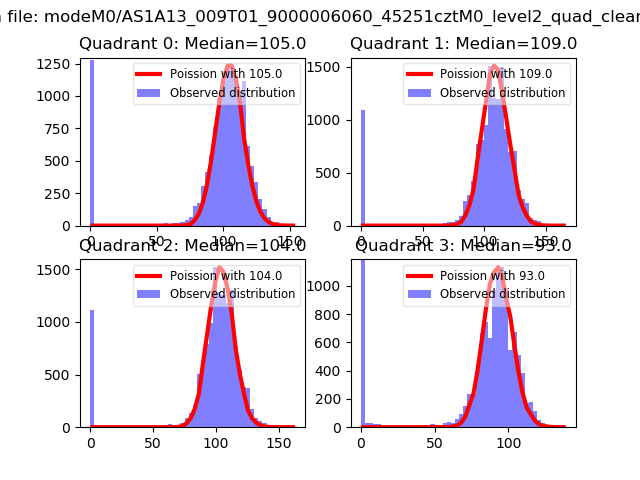 |
 |
| Quadrant-wise count rates Data is divided into 100 sec bins |
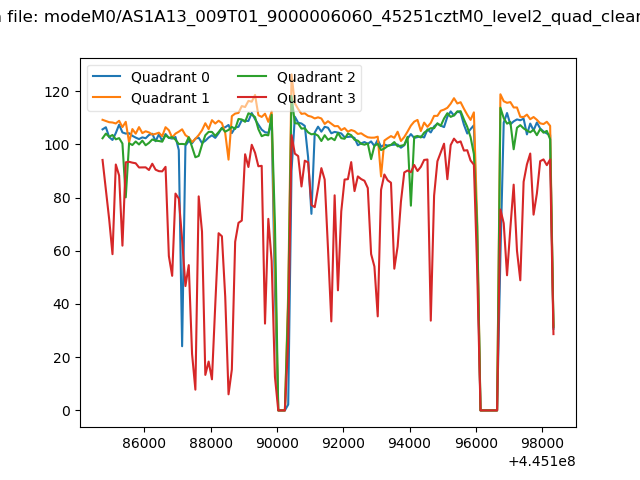 |
|
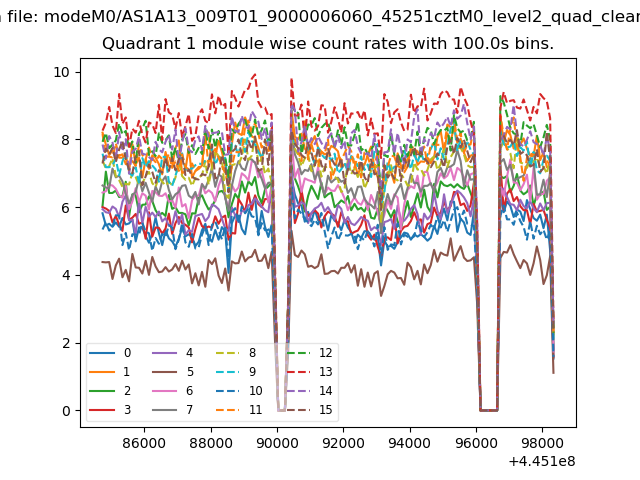
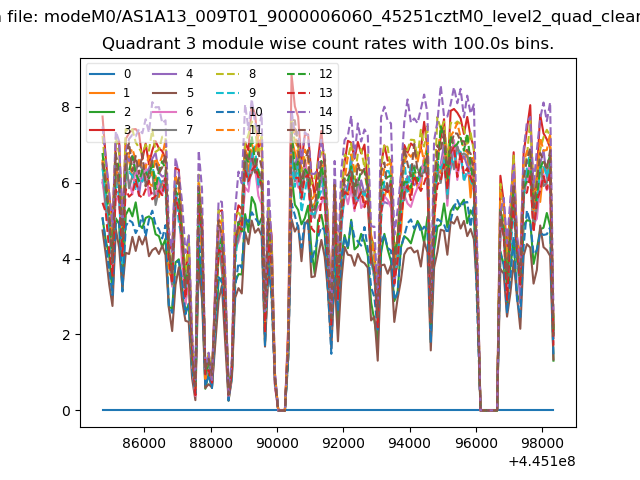
| Module-wise count rates for Quadrant A Data is divided into 100 sec bins |
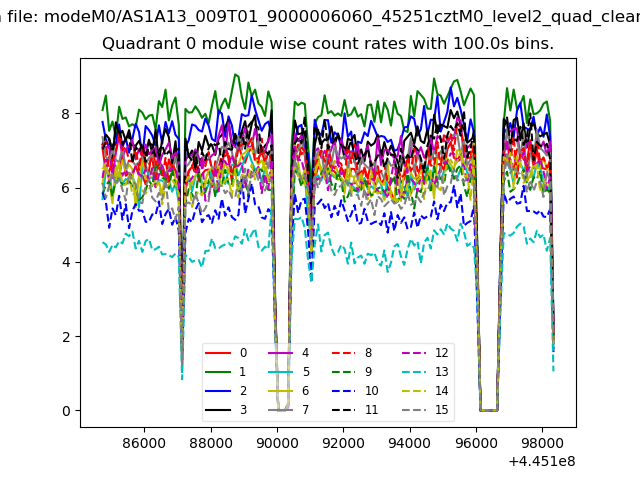 |
 |
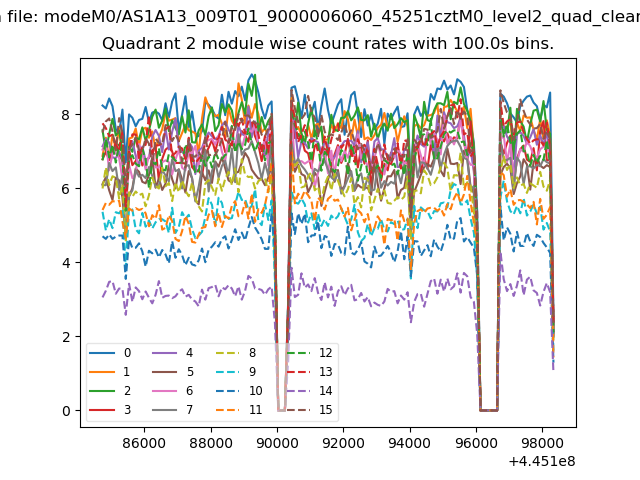
| Module-wise count rates for Quadrant B Data is divided into 100 sec bins |
 |
 |
| Module-wise count rates for Quadrant C Data is divided into 100 sec bins |
 |
 |
| Module-wise count rates for Quadrant D Data is divided into 100 sec bins |
 |
 |
| Parameter | Plot |
|---|---|
| CZT HV Monitor | 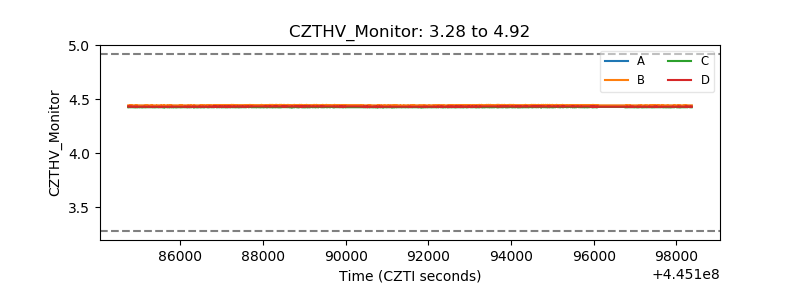 |
| D_VDD | 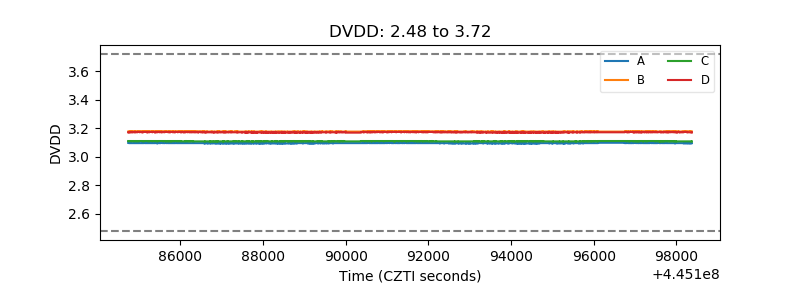 |
| Temperature 1 | 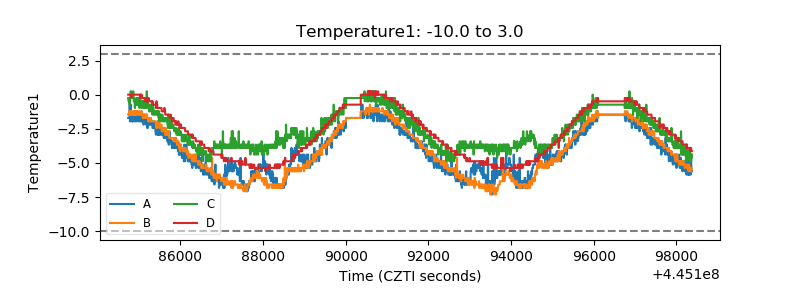 |
| Veto HV Monitor | 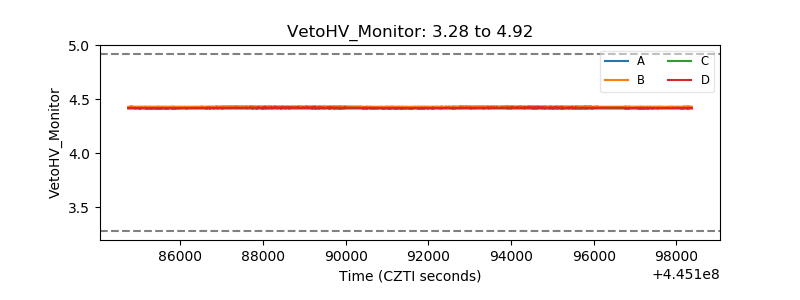 |
| Veto LLD | 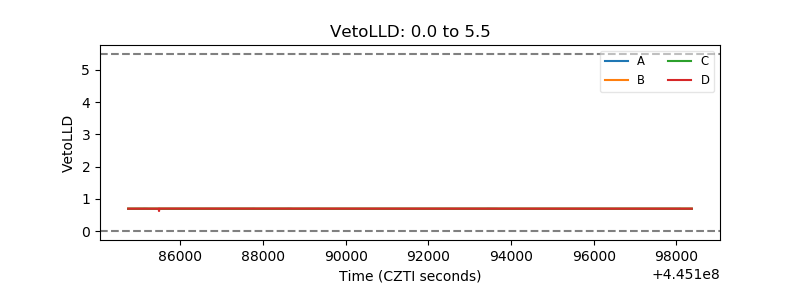 |
| Alpha Counter |  |
| _CPM_Rate | 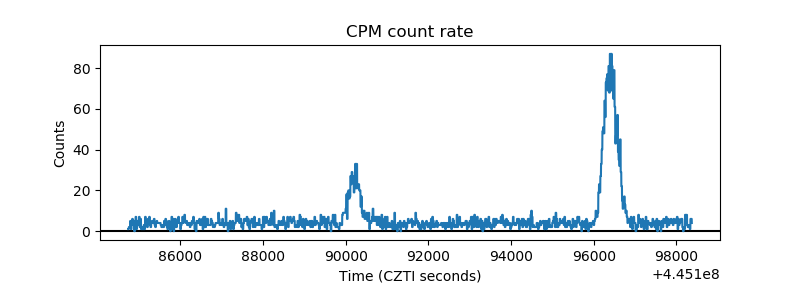 |
| CZT Counter | 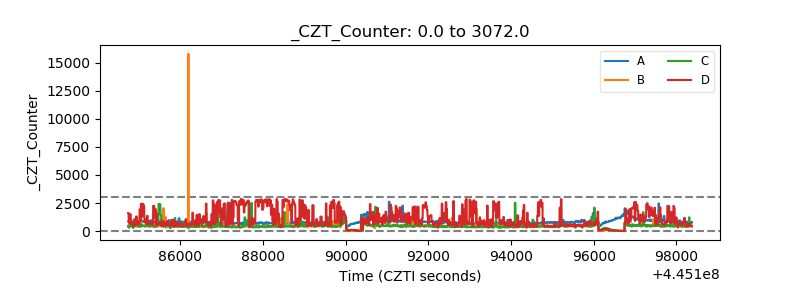 |
| +2.5 Volts monitor | 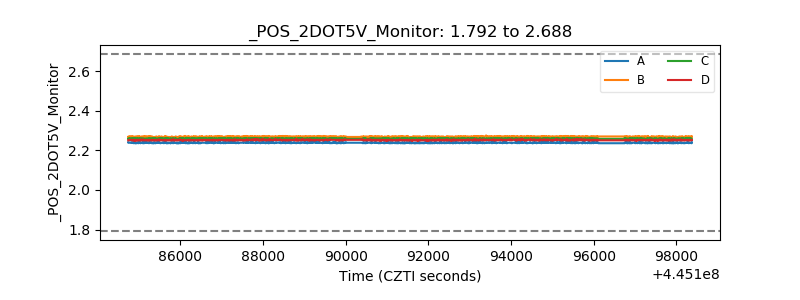 |
| +5 Volts monitor | 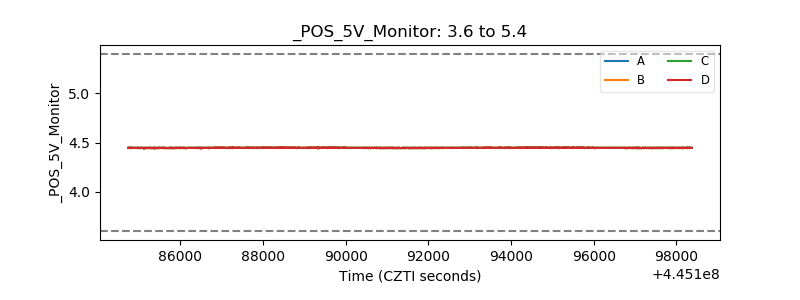 |
| _ROLL_ROT | 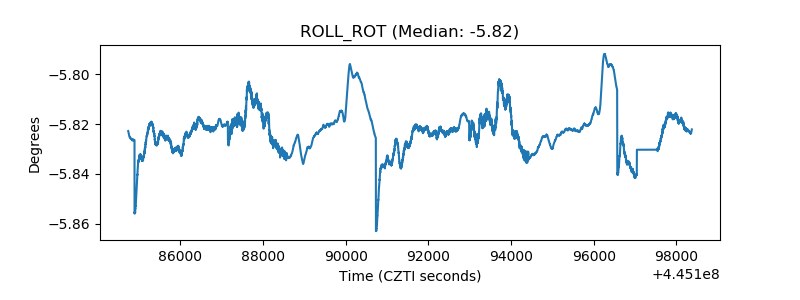 |
| _Roll_DEC | 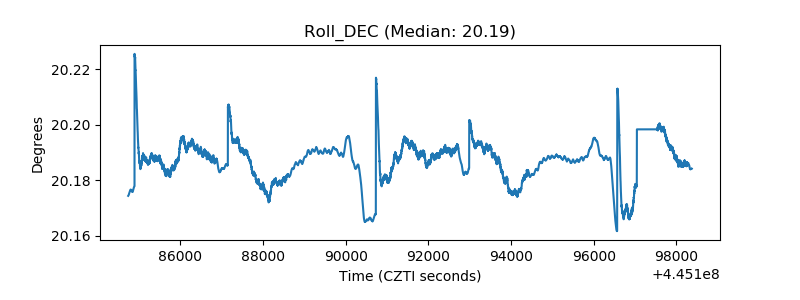 |
| _Roll_RA | 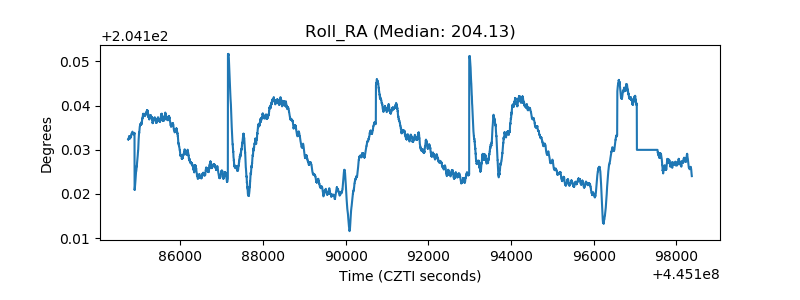 |
| Veto Counter | 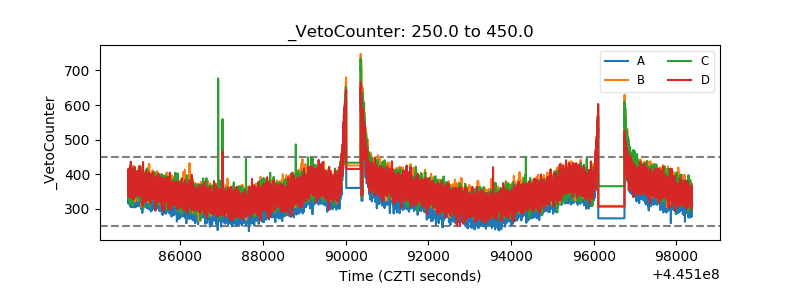 |