| Param | Original file | Final file |
|---|---|---|
| Filename | modeM0/AS1A13_009T01_9000006060_45430cztM0_level2.fits | modeM0/AS1A13_009T01_9000006060_45430cztM0_level2_quad_clean.evt |
| Size (bytes) | 485,573,760 | 109,160,640 |
| Size | 463.1 MB | 104.1 MB |
| Events in quadrant A | 5,869,947 | 722,245 |
| Events in quadrant B | 3,637,893 | 761,667 |
| Events in quadrant C | 3,171,139 | 735,563 |
| Events in quadrant D | 4,804,179 | 643,553 |
| Mode SS | |||
|---|---|---|---|
| Quadrant | BADHDUFLAG | Total packets | Discarded packets |
| A | 0 | 130 | 0 |
| B | 0 | 130 | 0 |
| C | 0 | 130 | 0 |
| D | 0 | 130 | 0 |
| Mode M9 | |||
|---|---|---|---|
| Quadrant | BADHDUFLAG | Total packets | Discarded packets |
| A | 0 | 16 | 0 |
| B | 0 | 17 | 0 |
| C | 0 | 17 | 0 |
| D | 0 | 17 | 0 |
| Mode M0 | |||
|---|---|---|---|
| Quadrant | BADHDUFLAG | Total packets | Discarded packets |
| A | 0 | 21777 | 2 |
| B | 0 | 14978 | 2 |
| C | 0 | 13743 | 2 |
| D | 0 | 18553 | 2 |
| Quadrant | Total seconds | Saturated seconds | Saturation percentage |
|---|---|---|---|
| A | 6334 | 252 | 3.978529% |
| B | 6334 | 118 | 1.862962% |
| C | 6334 | 60 | 0.947269% |
| D | 6334 | 268 | 4.231134% |
Noise dominated data is calculated using 1-second bins in cleaned event files. If a bin has >2000 counts, and if more than 50% of those come from <1% of pixels, then it is considered to be noise-dominated and hence unusable.
| Quadrant | # 1 sec bins | Bins with >0 counts | Bins with >2000 counts | High rate bins dominated by noise | Noise dominated (total time) | Noise dominated (detector-on time) | Marked lightcurve |
|---|---|---|---|---|---|---|---|
| A | 7539 | 6334 | 128 | 128 | 1.70% | 2.02% | 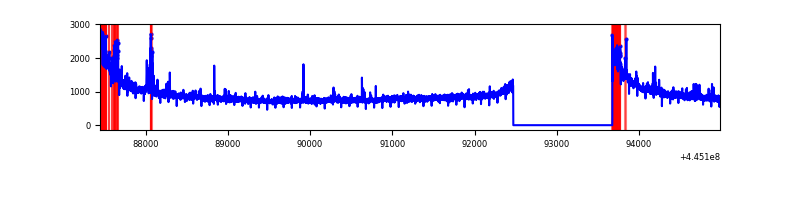 |
| B | 7539 | 6334 | 69 | 69 | 0.92% | 1.09% | 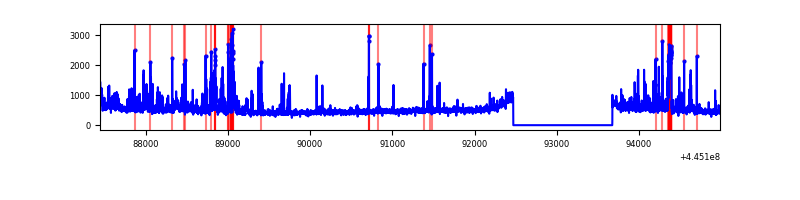 |
| C | 7539 | 6335 | 41 | 41 | 0.54% | 0.65% | 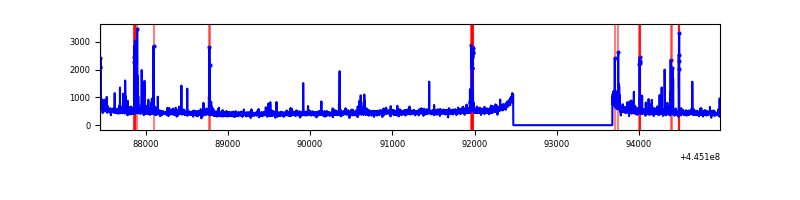 |
| D | 7539 | 6335 | 262 | 262 | 3.48% | 4.14% | 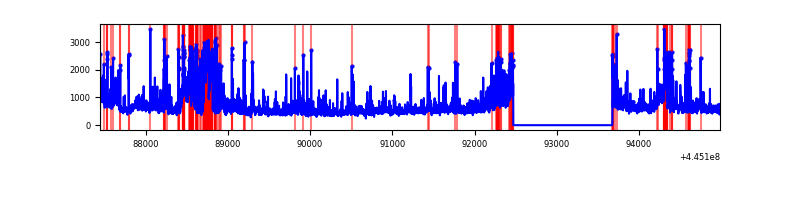 |
Top three noisy pixels from each quadrant. If the there are fewer than three noisy pixels in the level2.evt file, extra rows are filled as -1
| Pixel properties | Quadrant properties | ||||||
|---|---|---|---|---|---|---|---|
| Quadrant | DetID | PixID | Counts | Sigma | Mean | Median | Sigma |
| A | 10 | 83 | 2751536 | 18073.22 | 732 | 717 | 152.2 |
| A | 9 | 191 | 134258 | 877.38 | 732 | 717 | 152.2 |
| A | 13 | 248 | 84077 | 547.69 | 732 | 717 | 152.2 |
| B | 15 | 201 | 301723 | 2071.07 | 744 | 723 | 145.3 |
| B | 4 | 158 | 115353 | 788.73 | 744 | 723 | 145.3 |
| B | 0 | 171 | 51114 | 346.72 | 744 | 723 | 145.3 |
| C | 14 | 254 | 133019 | 772.22 | 728 | 735 | 171.3 |
| C | 12 | 2 | 49443 | 284.34 | 728 | 735 | 171.3 |
| C | 14 | 96 | 41132 | 235.82 | 728 | 735 | 171.3 |
| D | 1 | 52 | 926872 | 5195.64 | 706 | 686 | 178.3 |
| D | 11 | 241 | 305361 | 1709.14 | 706 | 686 | 178.3 |
| D | 2 | 249 | 267627 | 1497.46 | 706 | 686 | 178.3 |
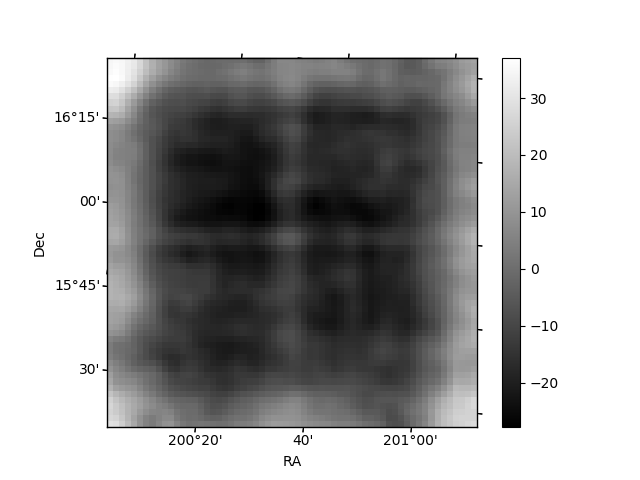
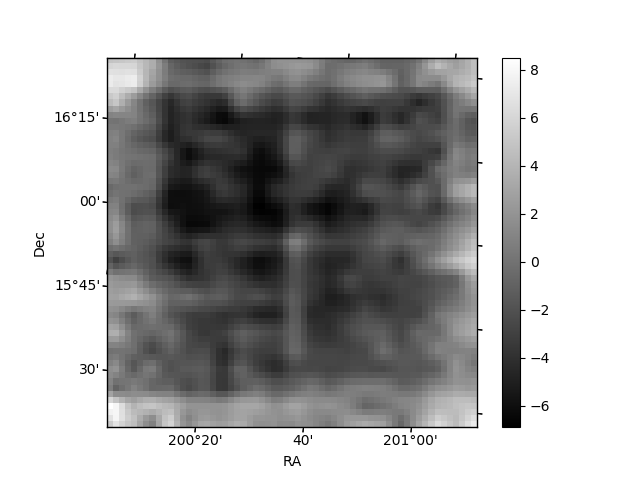
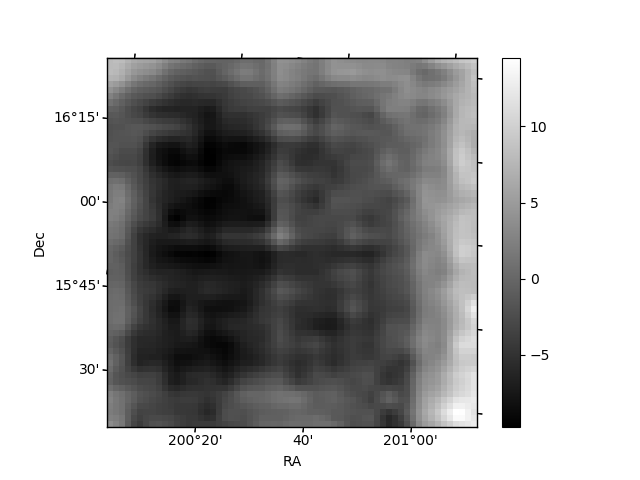
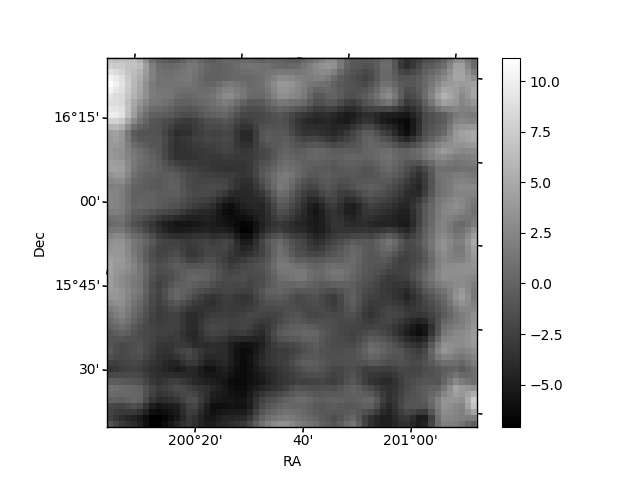
Histogram calculated using DETX and DETY for each event in the final _common_clean file
| Quadrant A | 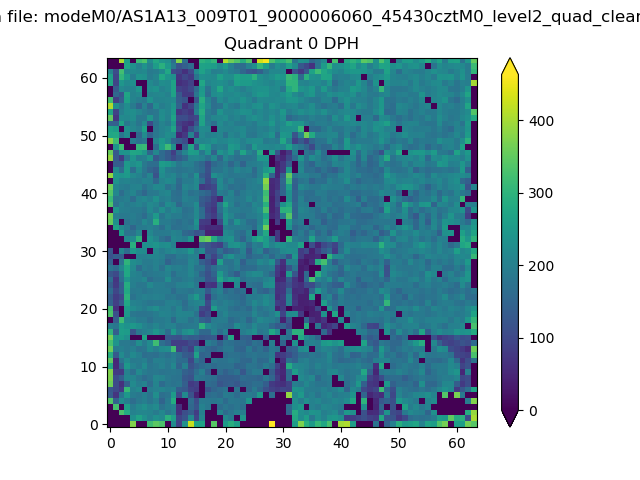 |
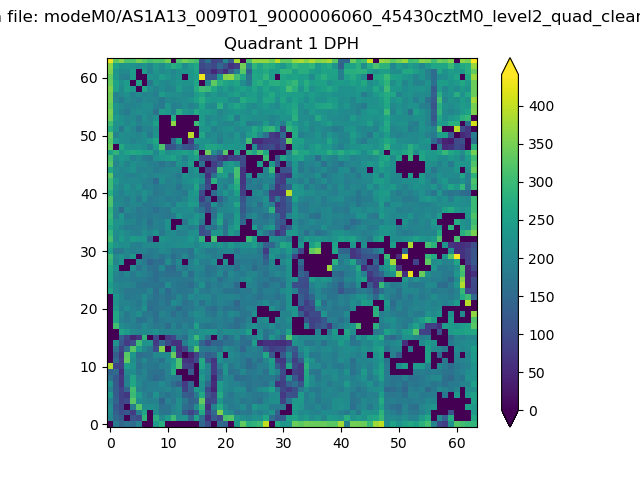 |
Quadrant B |
|---|---|---|---|
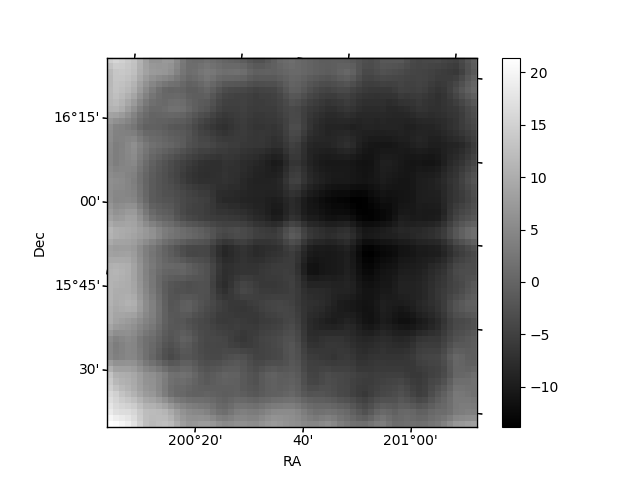
| Quadrant D | 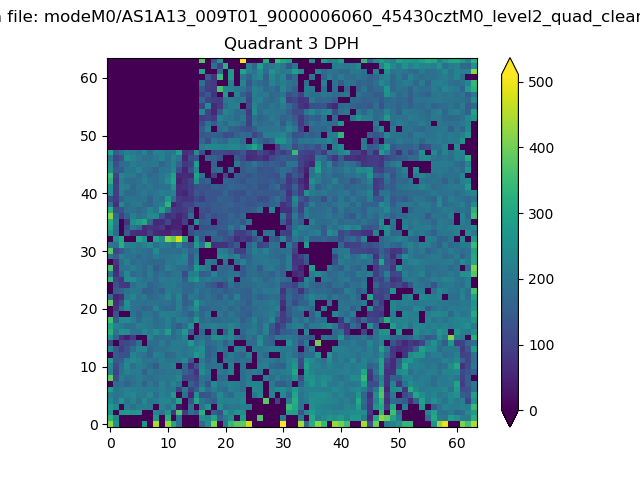 |
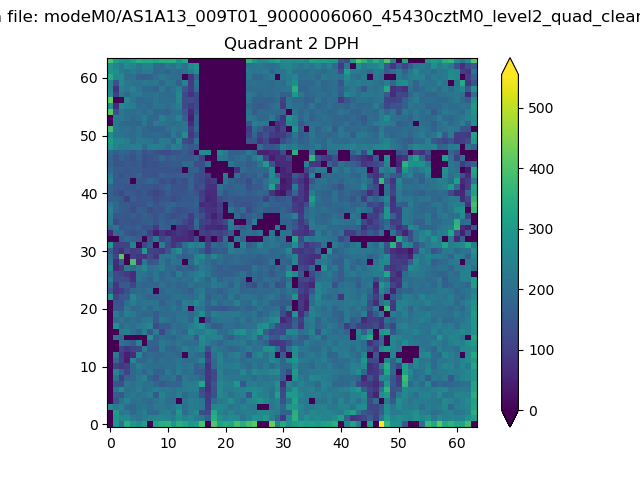 |
Quadrant C |
| Plot type | Count rate plots | Images |
|---|---|---|
| Comparison with Poisson distribution Blue bars denote a histogram of data divided into 1 sec bins. Red curve is a Poisson curve with rate = median count rate of data. |
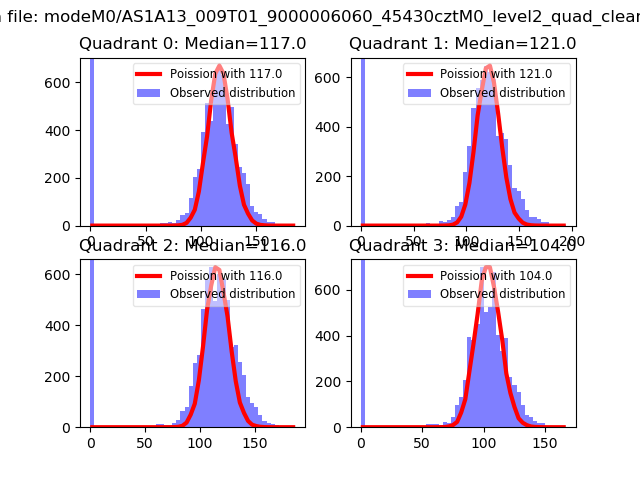 |
 |
| Quadrant-wise count rates Data is divided into 100 sec bins |
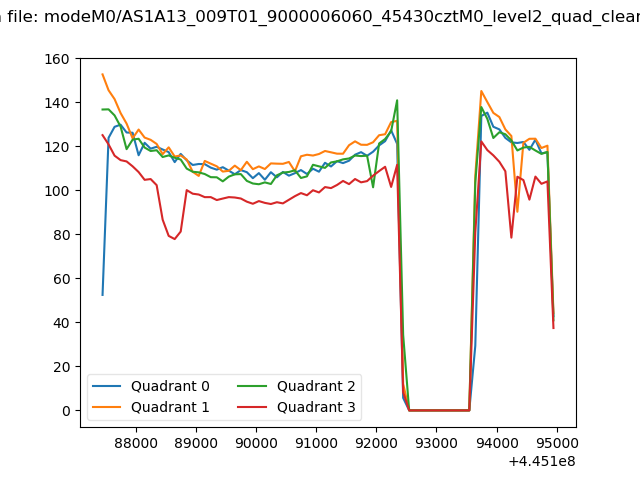 |
|
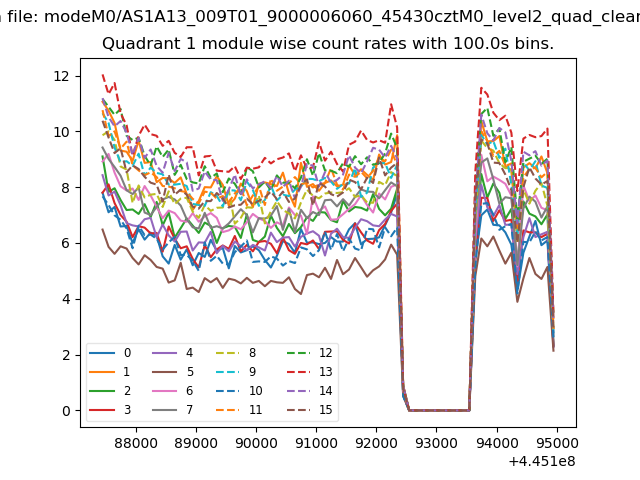
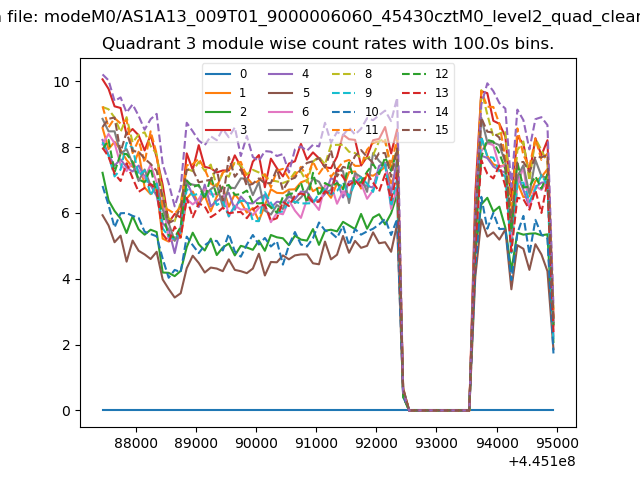
| Module-wise count rates for Quadrant A Data is divided into 100 sec bins |
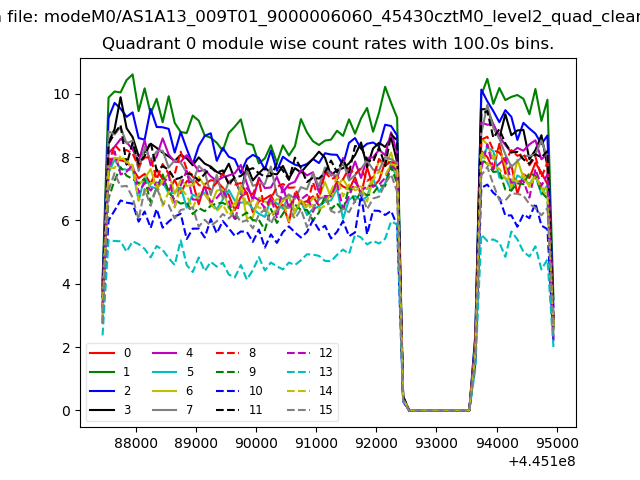 |
 |
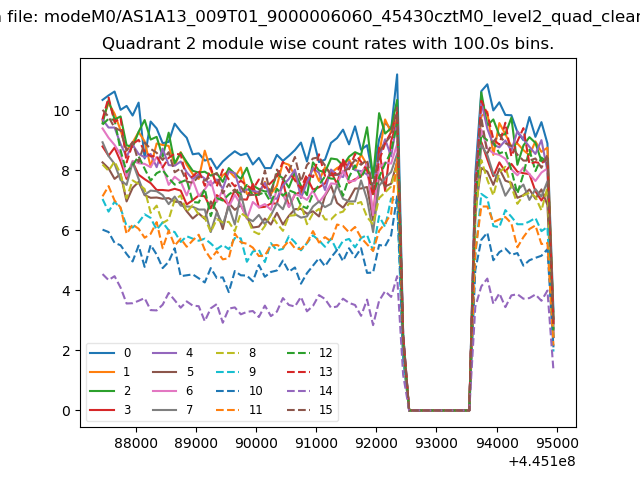
| Module-wise count rates for Quadrant B Data is divided into 100 sec bins |
 |
 |
| Module-wise count rates for Quadrant C Data is divided into 100 sec bins |
 |
 |
| Module-wise count rates for Quadrant D Data is divided into 100 sec bins |
 |
 |
| Parameter | Plot |
|---|---|
| CZT HV Monitor | 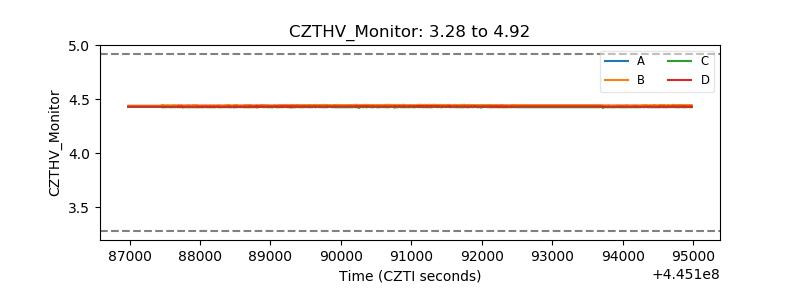 |
| D_VDD | 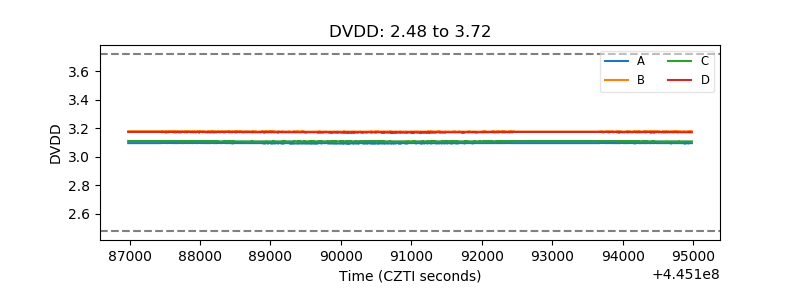 |
| Temperature 1 | 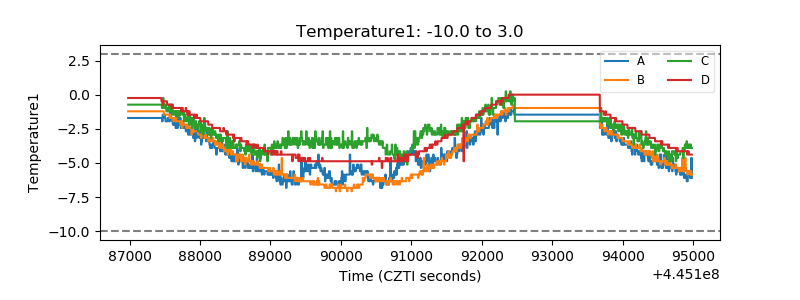 |
| Veto HV Monitor | 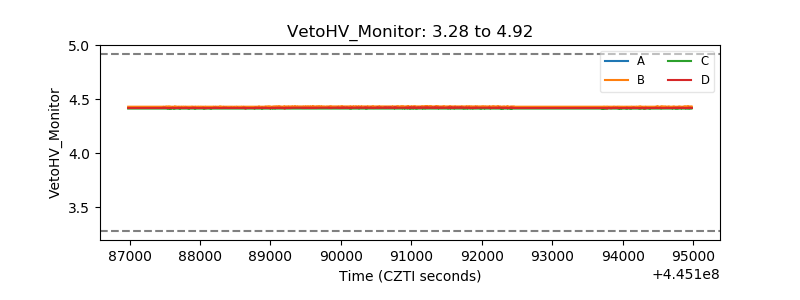 |
| Veto LLD | 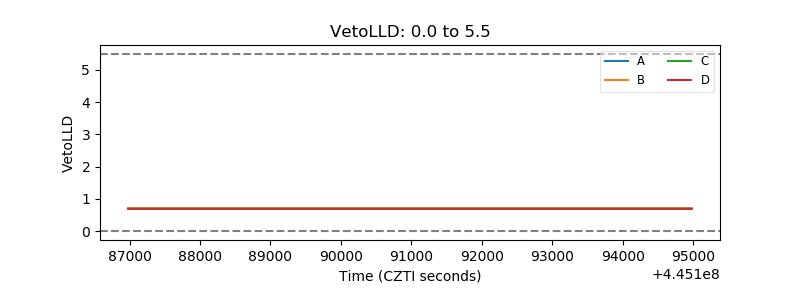 |
| Alpha Counter | 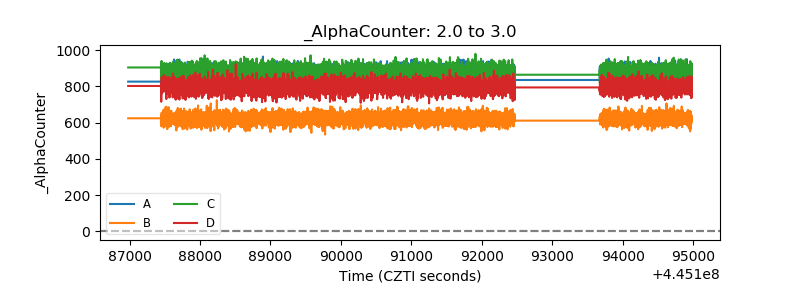 |
| _CPM_Rate |  |
| CZT Counter | 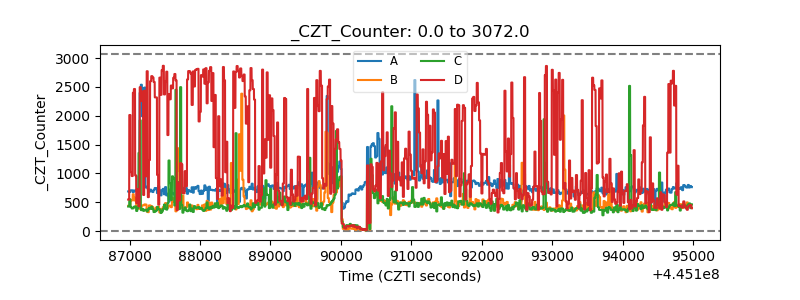 |
| +2.5 Volts monitor | 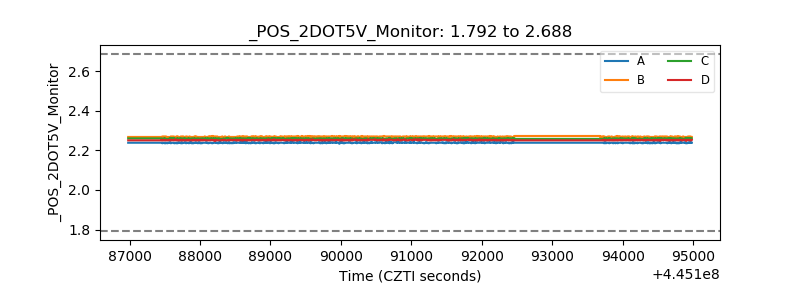 |
| +5 Volts monitor | 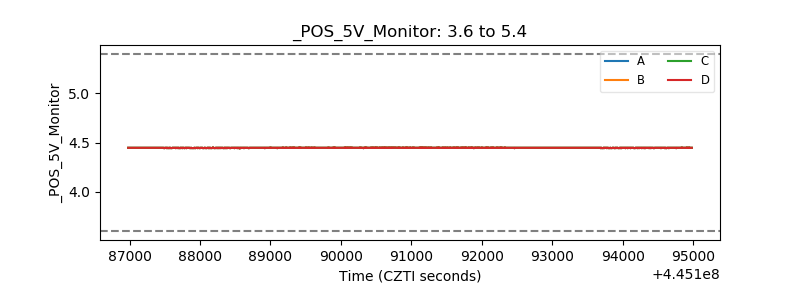 |
| _ROLL_ROT | 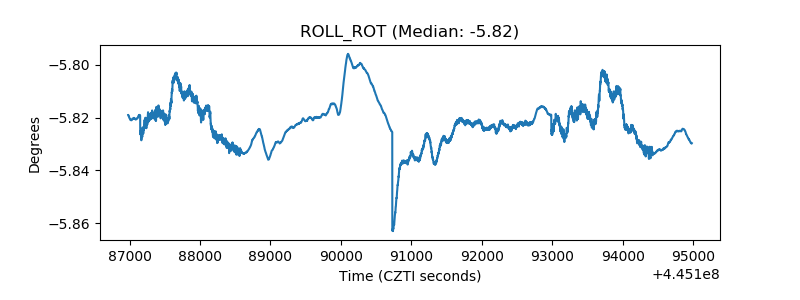 |
| _Roll_DEC | 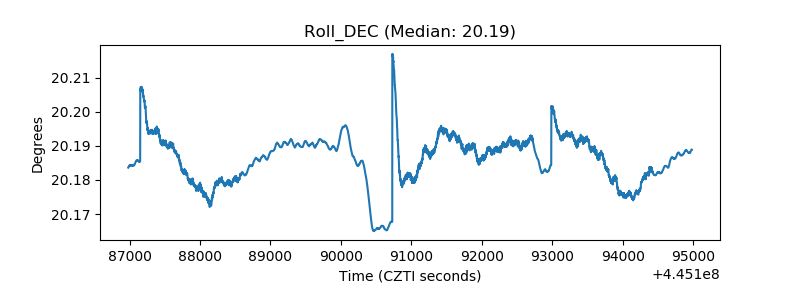 |
| _Roll_RA | 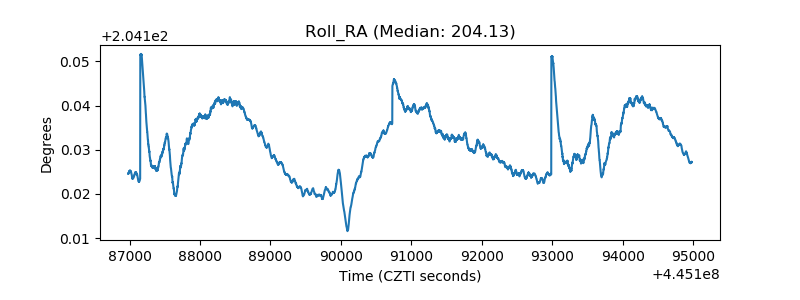 |
| Veto Counter | 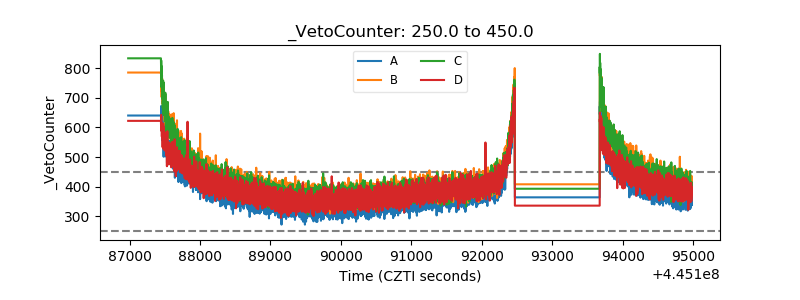 |