| Param | Original file | Final file |
|---|---|---|
| Filename | modeM0/AS1A13_023T05_9000006062_45252cztM0_level2.fits | modeM0/AS1A13_023T05_9000006062_45252cztM0_level2_quad_clean.evt |
| Size (bytes) | 639,195,840 | 155,543,040 |
| Size | 609.6 MB | 148.3 MB |
| Events in quadrant A | 7,523,694 | 1,034,457 |
| Events in quadrant B | 4,495,165 | 1,076,771 |
| Events in quadrant C | 4,436,014 | 1,023,502 |
| Events in quadrant D | 6,456,611 | 904,796 |
| Mode SS | |||
|---|---|---|---|
| Quadrant | BADHDUFLAG | Total packets | Discarded packets |
| A | 0 | 196 | 0 |
| B | 0 | 196 | 0 |
| C | 0 | 196 | 0 |
| D | 0 | 196 | 0 |
| Mode M9 | |||
|---|---|---|---|
| Quadrant | BADHDUFLAG | Total packets | Discarded packets |
| A | 0 | 19 | 0 |
| B | 0 | 19 | 0 |
| C | 0 | 19 | 0 |
| D | 0 | 19 | 0 |
| Mode M0 | |||
|---|---|---|---|
| Quadrant | BADHDUFLAG | Total packets | Discarded packets |
| A | 0 | 30185 | 2 |
| B | 0 | 20135 | 2 |
| C | 0 | 20138 | 2 |
| D | 0 | 25915 | 2 |
| Quadrant | Total seconds | Saturated seconds | Saturation percentage |
|---|---|---|---|
| A | 9668 | 171 | 1.768722% |
| B | 9668 | 92 | 0.951593% |
| C | 9668 | 30 | 0.310302% |
| D | 9668 | 382 | 3.951179% |
Noise dominated data is calculated using 1-second bins in cleaned event files. If a bin has >2000 counts, and if more than 50% of those come from <1% of pixels, then it is considered to be noise-dominated and hence unusable.
| Quadrant | # 1 sec bins | Bins with >0 counts | Bins with >2000 counts | High rate bins dominated by noise | Noise dominated (total time) | Noise dominated (detector-on time) | Marked lightcurve |
|---|---|---|---|---|---|---|---|
| A | 11498 | 9670 | 22 | 22 | 0.19% | 0.23% | 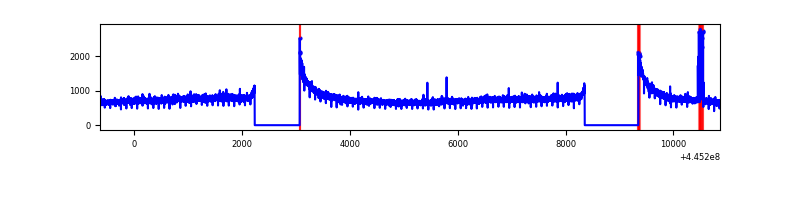 |
| B | 11498 | 9670 | 44 | 44 | 0.38% | 0.46% | 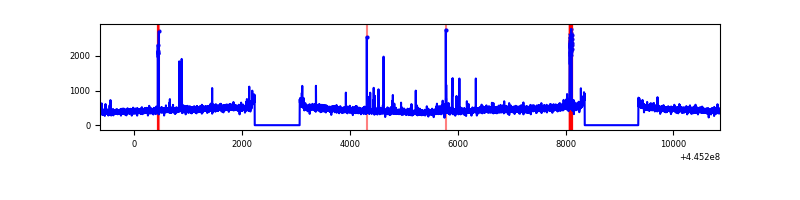 |
| C | 11498 | 9670 | 23 | 23 | 0.20% | 0.24% | 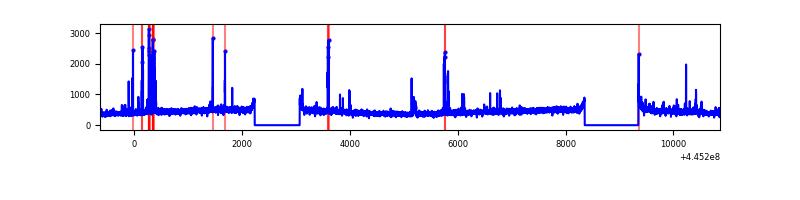 |
| D | 11498 | 9669 | 387 | 387 | 3.37% | 4.00% | 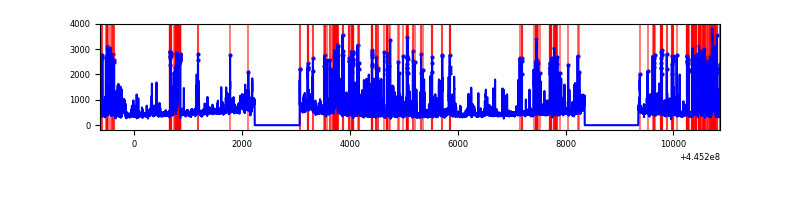 |
Top three noisy pixels from each quadrant. If the there are fewer than three noisy pixels in the level2.evt file, extra rows are filled as -1
| Pixel properties | Quadrant properties | ||||||
|---|---|---|---|---|---|---|---|
| Quadrant | DetID | PixID | Counts | Sigma | Mean | Median | Sigma |
| A | 10 | 83 | 3272361 | 14600.0 | 1082 | 1060 | 224.1 |
| A | 13 | 248 | 59811 | 262.21 | 1082 | 1060 | 224.1 |
| A | 0 | 243 | 14469 | 59.85 | 1082 | 1060 | 224.1 |
| B | 5 | 32 | 160389 | 744.1 | 1083 | 1050 | 214.1 |
| B | 12 | 111 | 27950 | 125.62 | 1083 | 1050 | 214.1 |
| B | 11 | 111 | 25717 | 115.19 | 1083 | 1050 | 214.1 |
| C | 14 | 254 | 174043 | 685.84 | 1069 | 1075 | 252.2 |
| C | 12 | 2 | 37865 | 145.88 | 1069 | 1075 | 252.2 |
| C | 1 | 3 | 21178 | 79.71 | 1069 | 1075 | 252.2 |
| D | 13 | 249 | 1229385 | 4649.58 | 1045 | 1012 | 264.2 |
| D | 11 | 241 | 450834 | 1702.64 | 1045 | 1012 | 264.2 |
| D | 13 | 171 | 165748 | 623.55 | 1045 | 1012 | 264.2 |
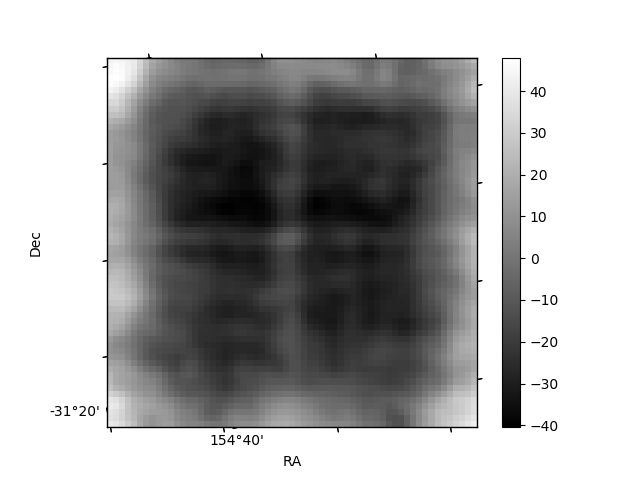
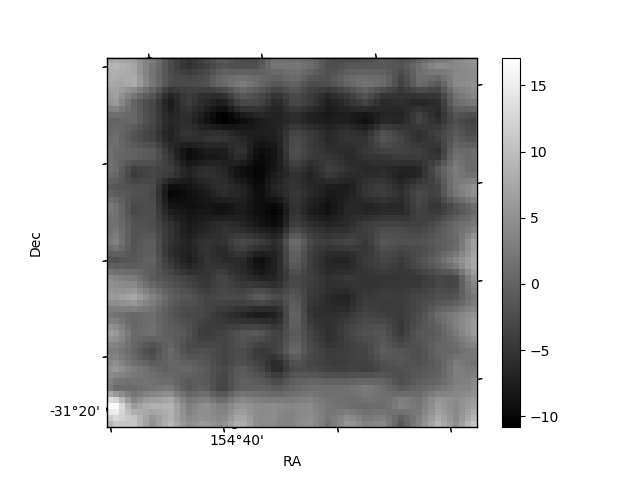
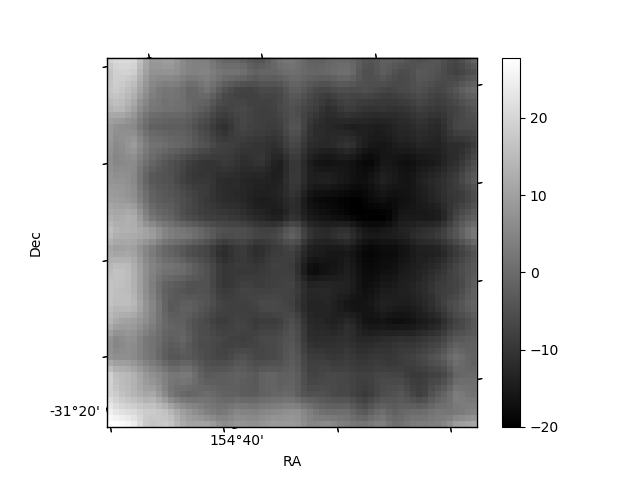
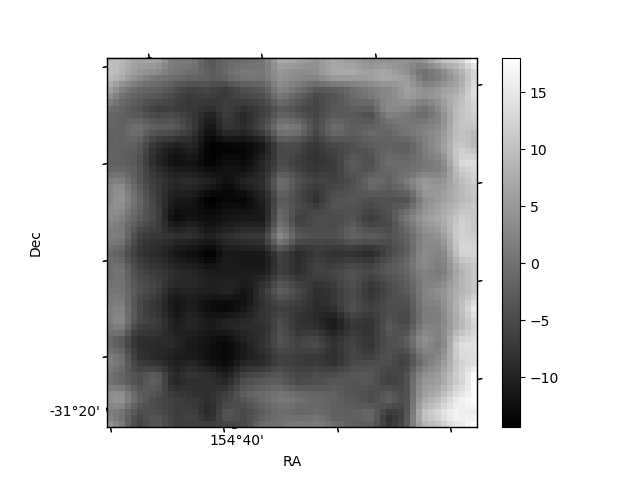
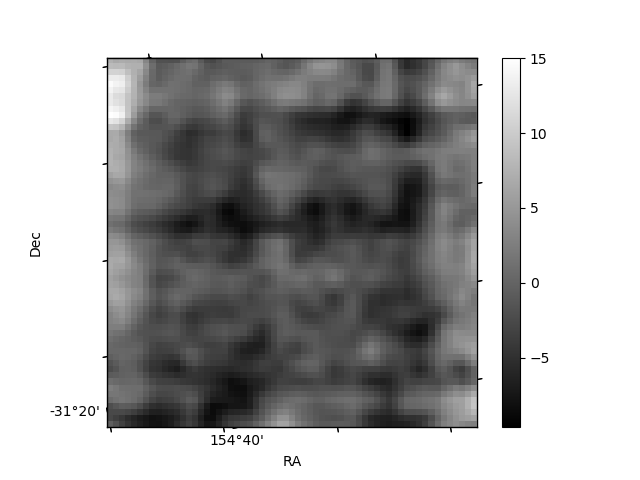
Histogram calculated using DETX and DETY for each event in the final _common_clean file
| Quadrant A | 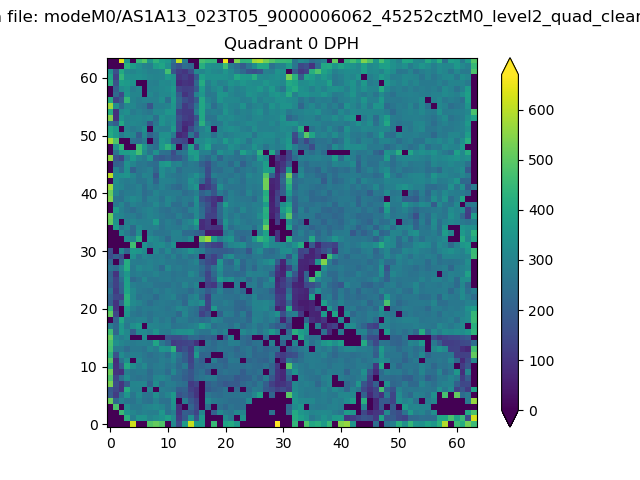 |
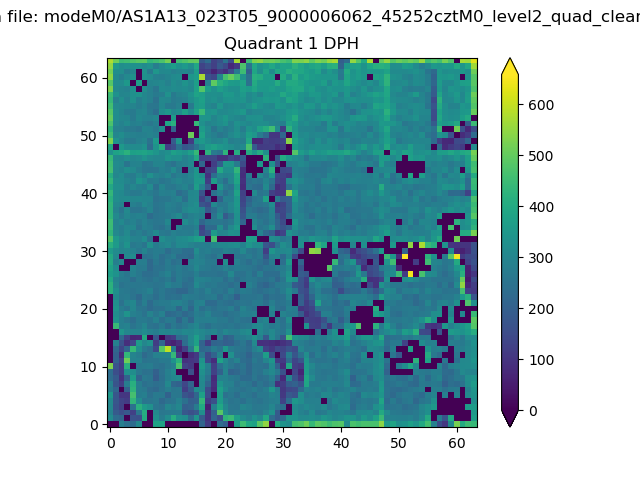 |
Quadrant B |
|---|---|---|---|
| Quadrant D | 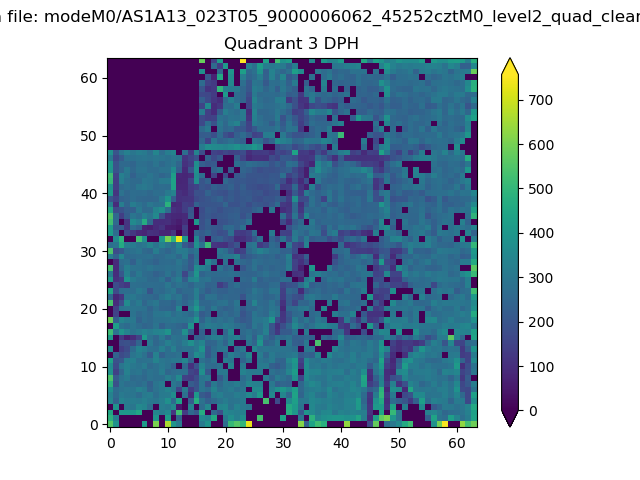 |
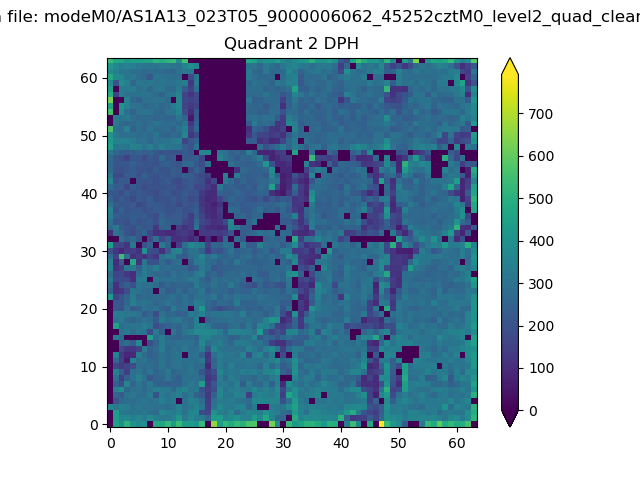 |
Quadrant C |
| Plot type | Count rate plots | Images |
|---|---|---|
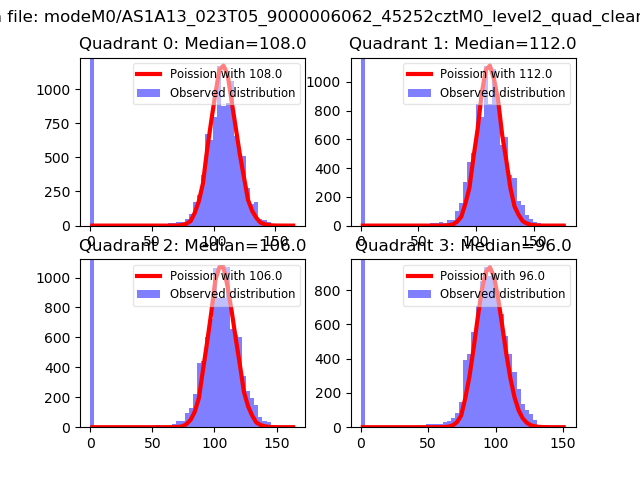
| Comparison with Poisson distribution Blue bars denote a histogram of data divided into 1 sec bins. Red curve is a Poisson curve with rate = median count rate of data. |
 |
 |
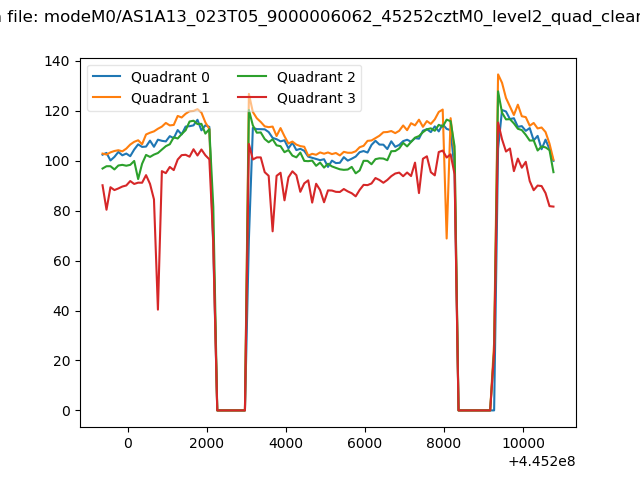
| Quadrant-wise count rates Data is divided into 100 sec bins |
 |
|
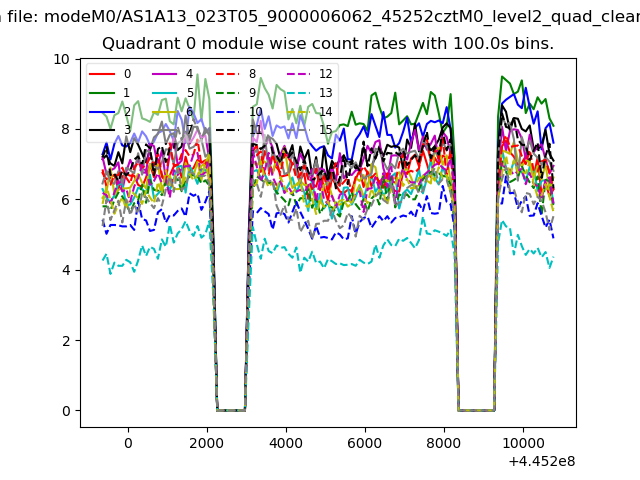
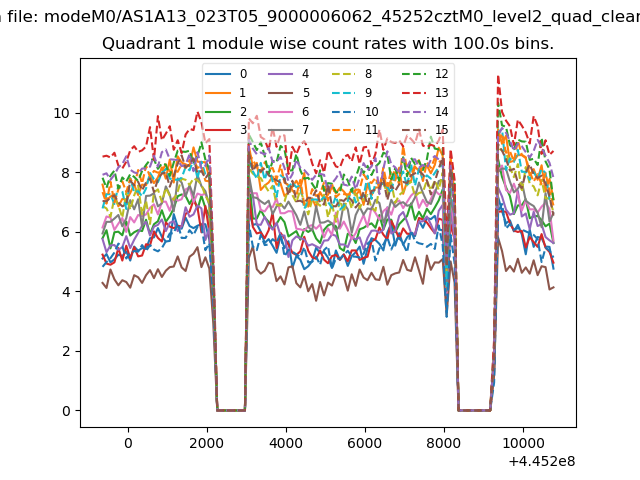
| Module-wise count rates for Quadrant A Data is divided into 100 sec bins |
 |
 |
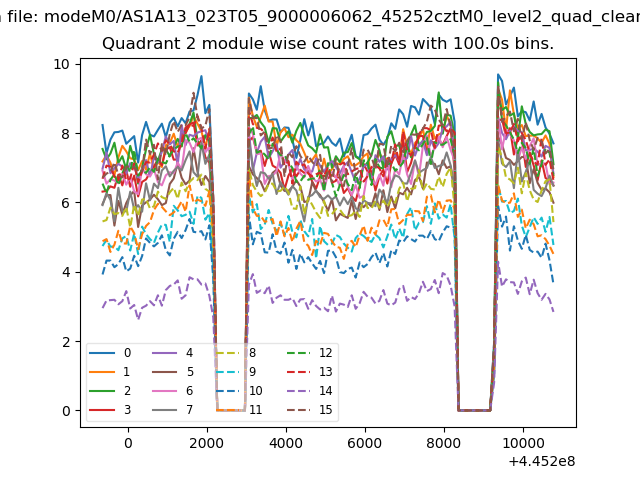
| Module-wise count rates for Quadrant B Data is divided into 100 sec bins |
 |
 |
| Module-wise count rates for Quadrant C Data is divided into 100 sec bins |
 |
 |
| Module-wise count rates for Quadrant D Data is divided into 100 sec bins |
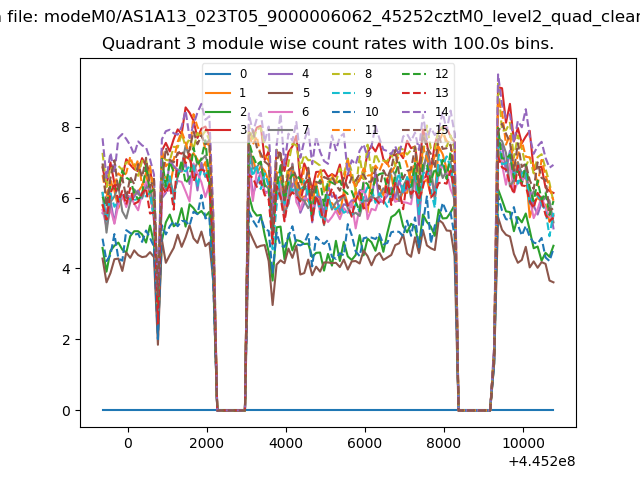 |
 |
| Parameter | Plot |
|---|---|
| CZT HV Monitor | 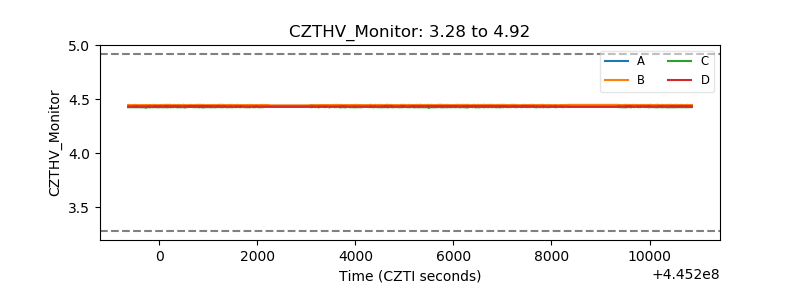 |
| D_VDD | 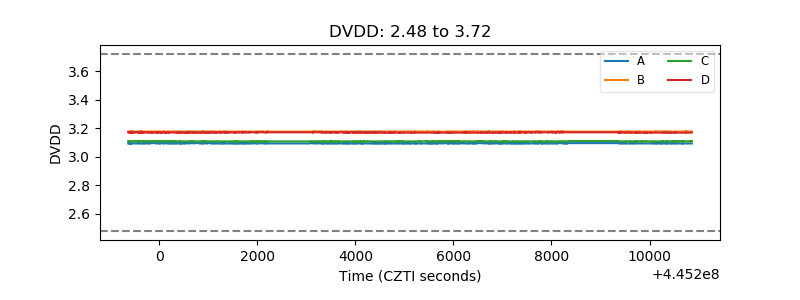 |
| Temperature 1 | 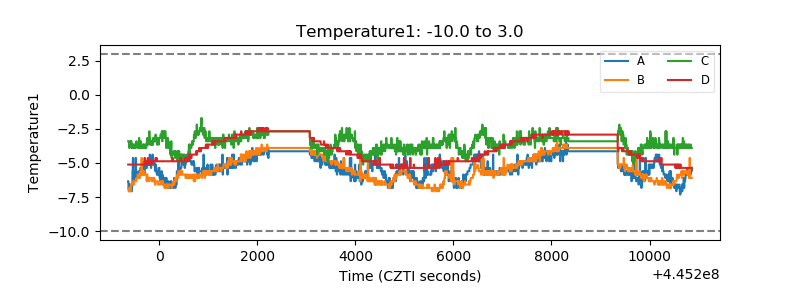 |
| Veto HV Monitor | 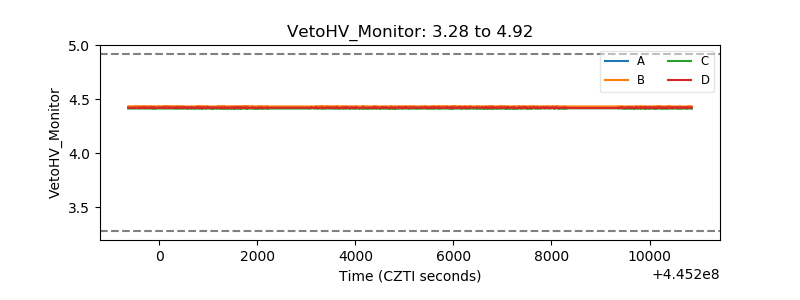 |
| Veto LLD | 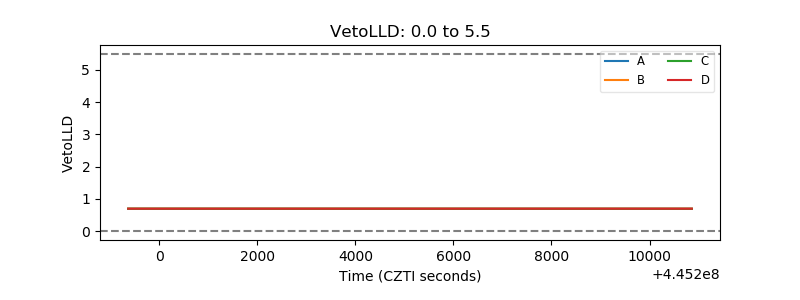 |
| Alpha Counter | 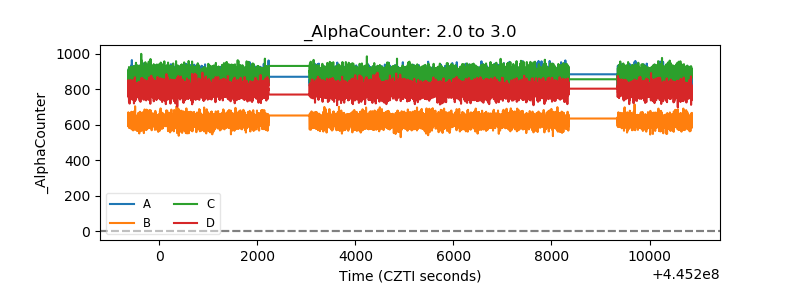 |
| _CPM_Rate | 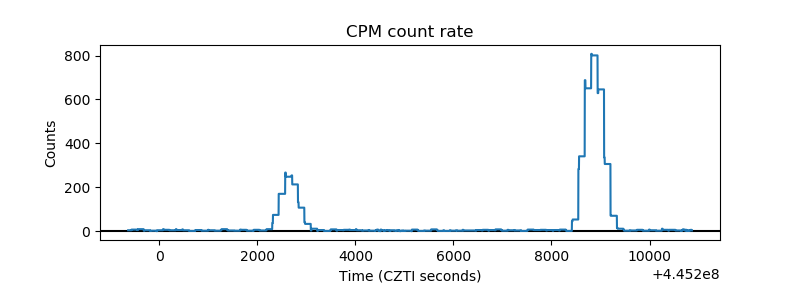 |
| CZT Counter | 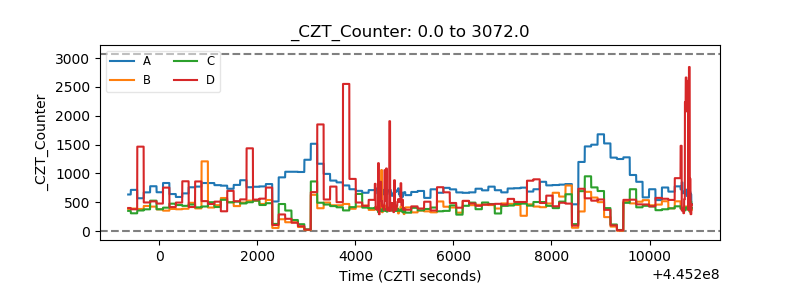 |
| +2.5 Volts monitor |  |
| +5 Volts monitor |  |
| _ROLL_ROT | 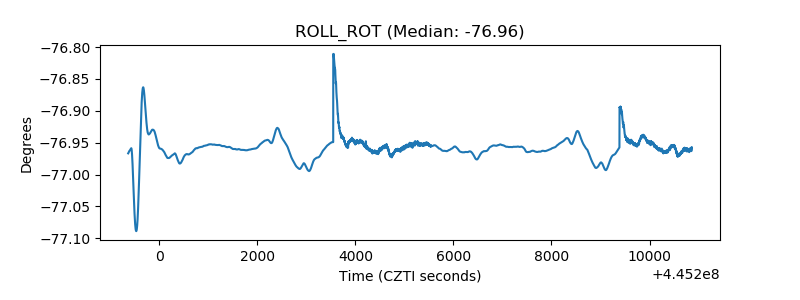 |
| _Roll_DEC | 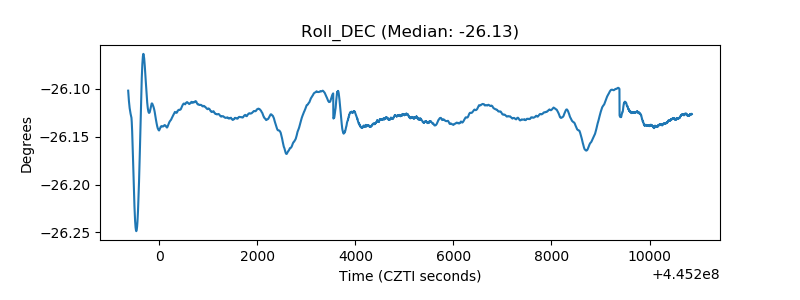 |
| _Roll_RA | 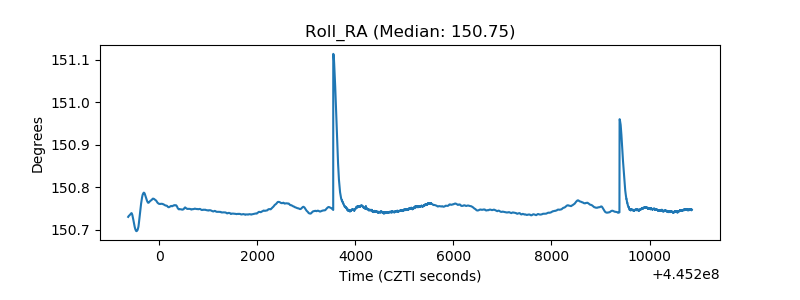 |
| Veto Counter | 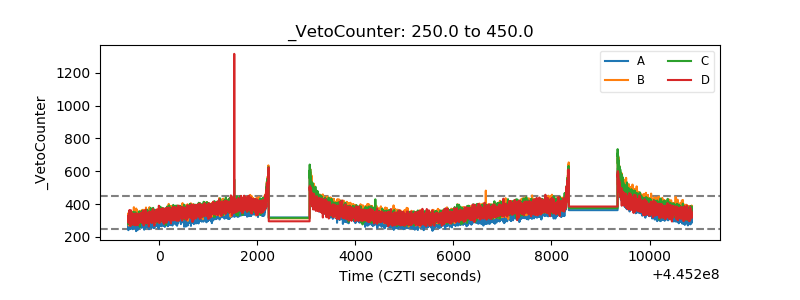 |