| Param | Original file | Final file |
|---|---|---|
| Filename | modeM0/AS1A13_023T05_9000006062_45254cztM0_level2.fits | modeM0/AS1A13_023T05_9000006062_45254cztM0_level2_quad_clean.evt |
| Size (bytes) | 471,035,520 | 110,007,360 |
| Size | 449.2 MB | 104.9 MB |
| Events in quadrant A | 5,707,243 | 723,539 |
| Events in quadrant B | 3,047,281 | 773,518 |
| Events in quadrant C | 3,211,069 | 731,591 |
| Events in quadrant D | 4,955,483 | 639,816 |
| Mode SS | |||
|---|---|---|---|
| Quadrant | BADHDUFLAG | Total packets | Discarded packets |
| A | 0 | 136 | 0 |
| B | 0 | 136 | 0 |
| C | 0 | 136 | 0 |
| D | 0 | 136 | 0 |
| Mode M9 | |||
|---|---|---|---|
| Quadrant | BADHDUFLAG | Total packets | Discarded packets |
| A | 0 | 21 | 0 |
| B | 0 | 21 | 0 |
| C | 0 | 21 | 0 |
| D | 0 | 21 | 0 |
| Mode M0 | |||
|---|---|---|---|
| Quadrant | BADHDUFLAG | Total packets | Discarded packets |
| A | 0 | 22115 | 2 |
| B | 0 | 13652 | 2 |
| C | 0 | 14122 | 2 |
| D | 0 | 19308 | 2 |
| Quadrant | Total seconds | Saturated seconds | Saturation percentage |
|---|---|---|---|
| A | 6635 | 273 | 4.114544% |
| B | 6636 | 52 | 0.783605% |
| C | 6636 | 36 | 0.542495% |
| D | 6636 | 396 | 5.967450% |
Noise dominated data is calculated using 1-second bins in cleaned event files. If a bin has >2000 counts, and if more than 50% of those come from <1% of pixels, then it is considered to be noise-dominated and hence unusable.
| Quadrant | # 1 sec bins | Bins with >0 counts | Bins with >2000 counts | High rate bins dominated by noise | Noise dominated (total time) | Noise dominated (detector-on time) | Marked lightcurve |
|---|---|---|---|---|---|---|---|
| A | 8725 | 6636 | 112 | 112 | 1.28% | 1.69% | 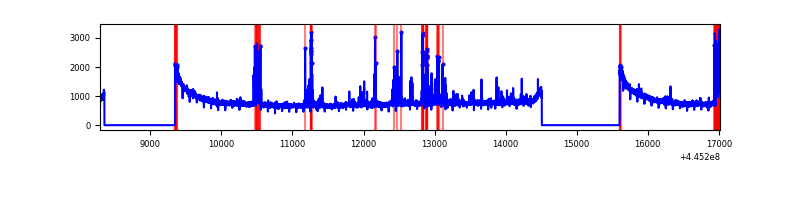 |
| B | 8726 | 6637 | 0 | 0 | 0.00% | 0.00% | 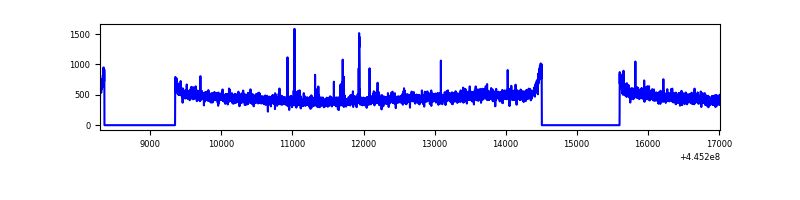 |
| C | 8726 | 6637 | 14 | 14 | 0.16% | 0.21% | 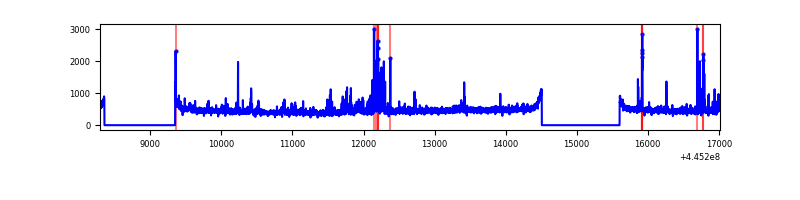 |
| D | 8726 | 6636 | 433 | 433 | 4.96% | 6.53% | 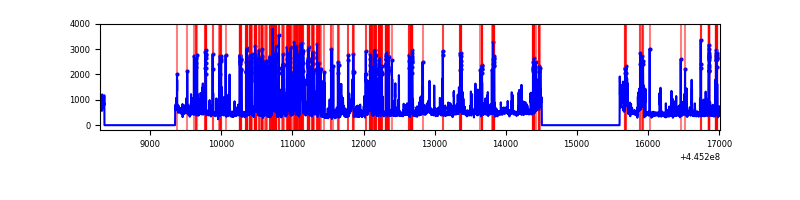 |
Top three noisy pixels from each quadrant. If the there are fewer than three noisy pixels in the level2.evt file, extra rows are filled as -1
| Pixel properties | Quadrant properties | ||||||
|---|---|---|---|---|---|---|---|
| Quadrant | DetID | PixID | Counts | Sigma | Mean | Median | Sigma |
| A | 10 | 83 | 2359206 | 15272.1 | 751 | 736 | 154.4 |
| A | 13 | 248 | 440038 | 2844.67 | 751 | 736 | 154.4 |
| A | 3 | 137 | 8407 | 49.67 | 751 | 736 | 154.4 |
| B | 12 | 111 | 19638 | 126.49 | 761 | 738 | 149.4 |
| B | 14 | 111 | 17889 | 114.78 | 761 | 738 | 149.4 |
| B | 11 | 111 | 17722 | 113.66 | 761 | 738 | 149.4 |
| C | 14 | 254 | 151711 | 854.88 | 747 | 751 | 176.6 |
| C | 12 | 2 | 84056 | 471.76 | 747 | 751 | 176.6 |
| C | 11 | 16 | 28297 | 155.99 | 747 | 751 | 176.6 |
| D | 13 | 249 | 1196502 | 6592.72 | 722 | 699 | 181.4 |
| D | 11 | 241 | 331180 | 1822.01 | 722 | 699 | 181.4 |
| D | 13 | 84 | 206091 | 1132.37 | 722 | 699 | 181.4 |
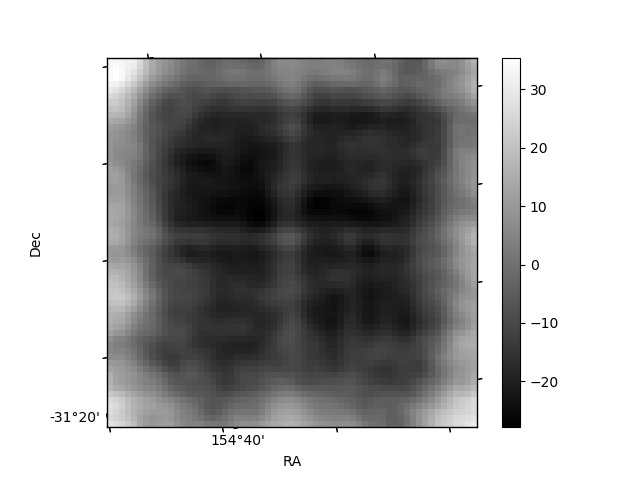
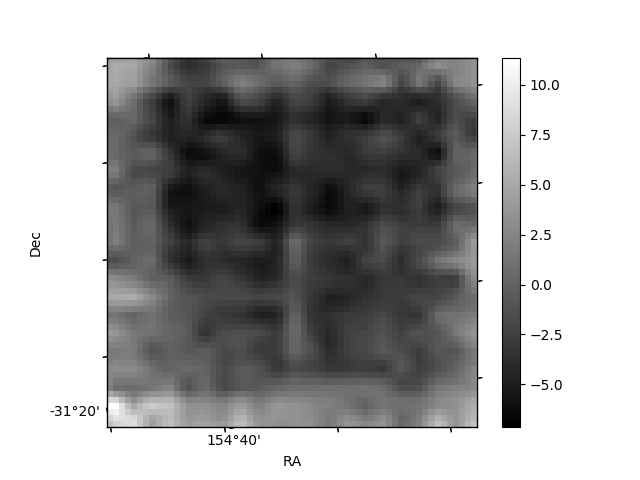
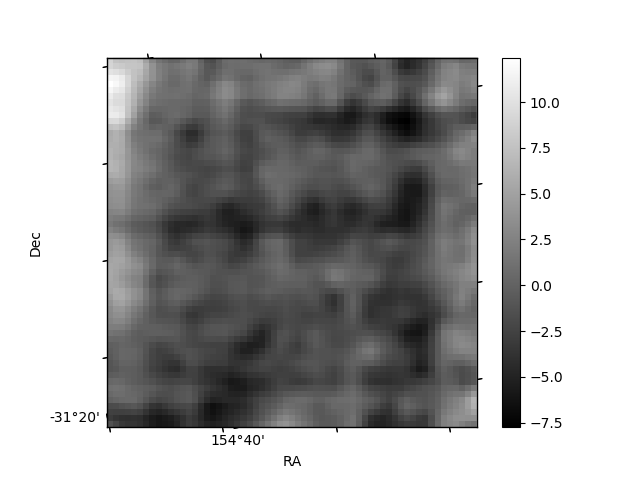
Histogram calculated using DETX and DETY for each event in the final _common_clean file
| Quadrant A | 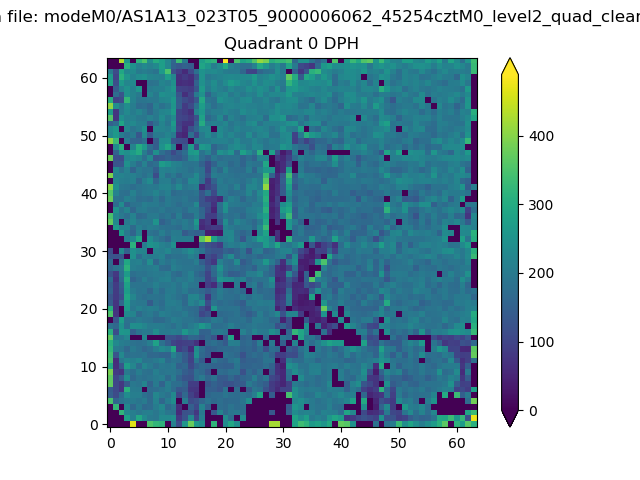 |
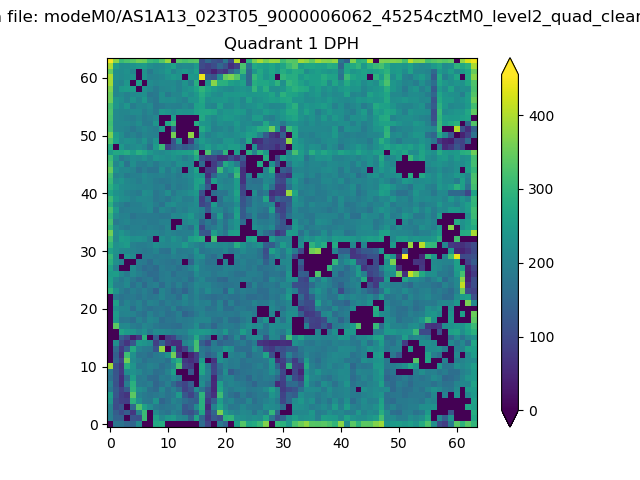 |
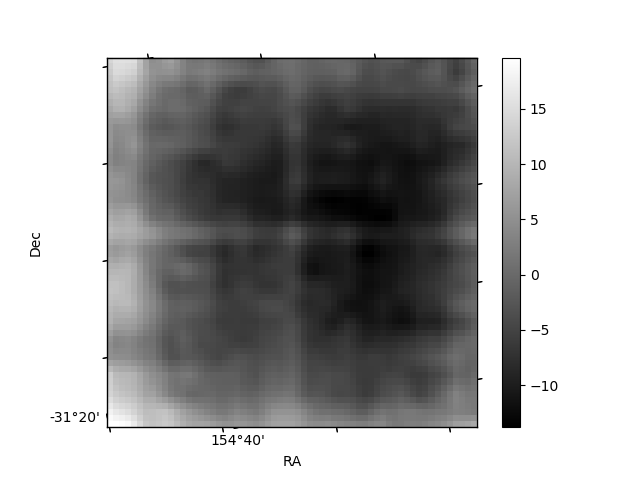
Quadrant B |
|---|---|---|---|
| Quadrant D | 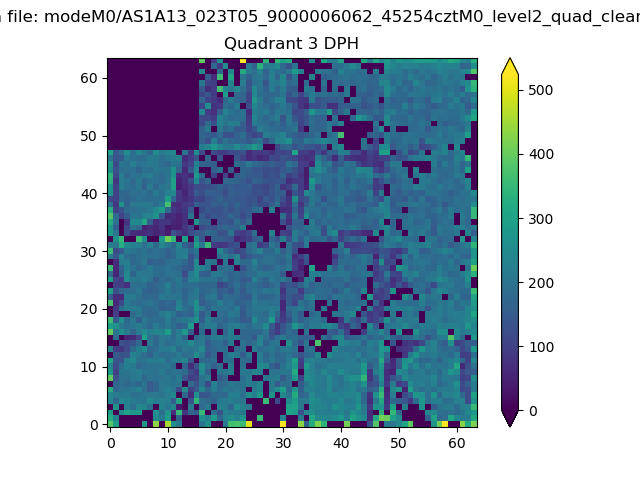 |
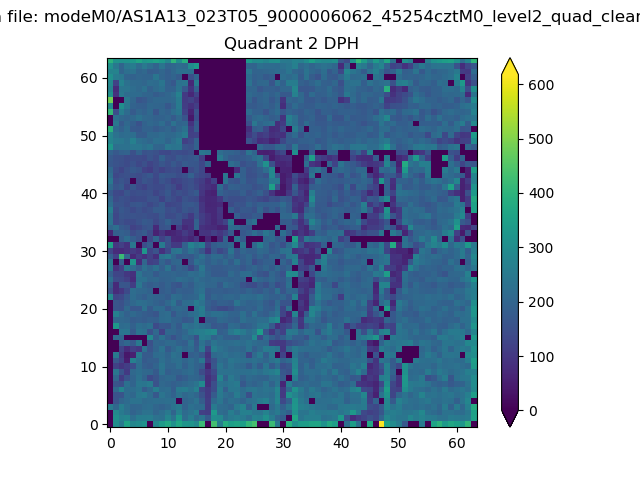 |
Quadrant C |
| Plot type | Count rate plots | Images |
|---|---|---|
| Comparison with Poisson distribution Blue bars denote a histogram of data divided into 1 sec bins. Red curve is a Poisson curve with rate = median count rate of data. |
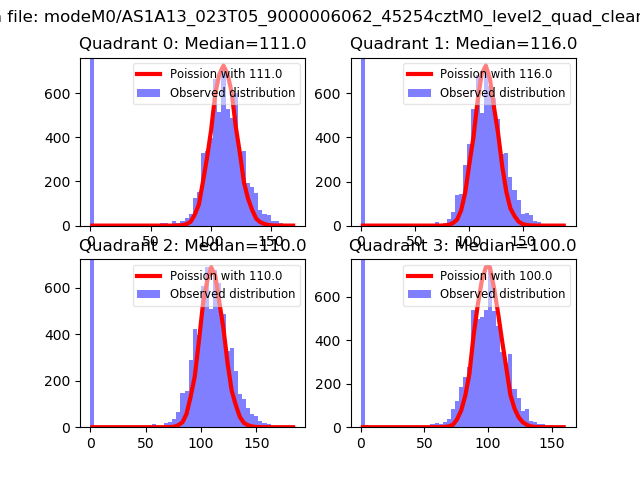 |
 |
| Quadrant-wise count rates Data is divided into 100 sec bins |
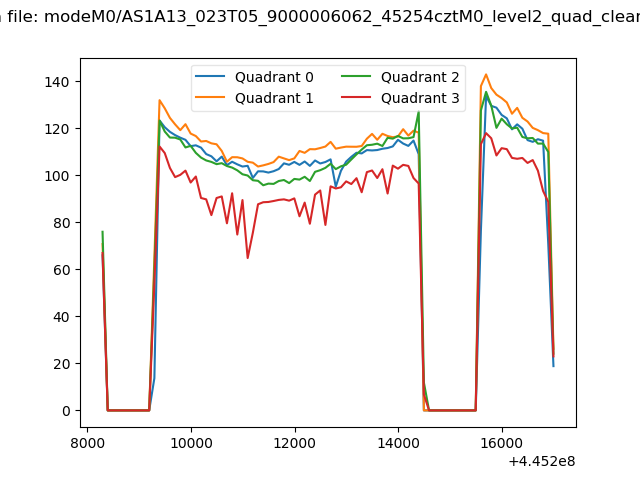 |
|
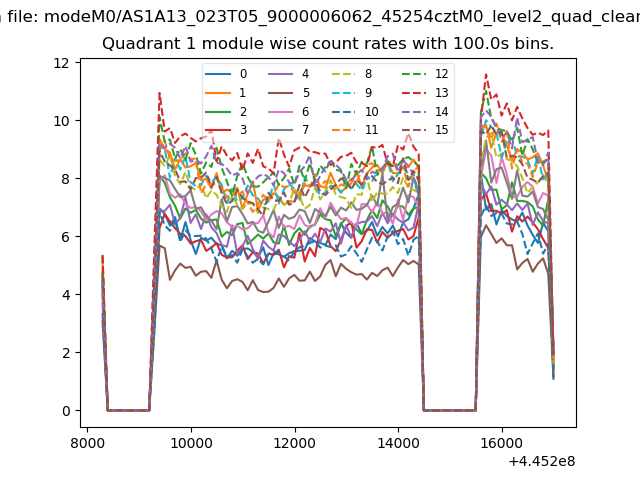
| Module-wise count rates for Quadrant A Data is divided into 100 sec bins |
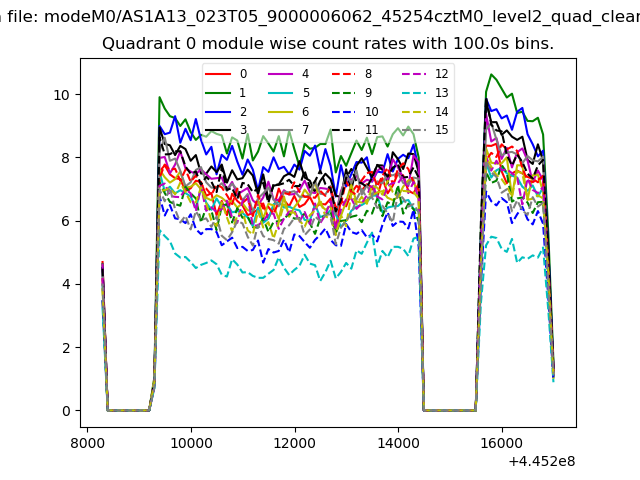 |
 |
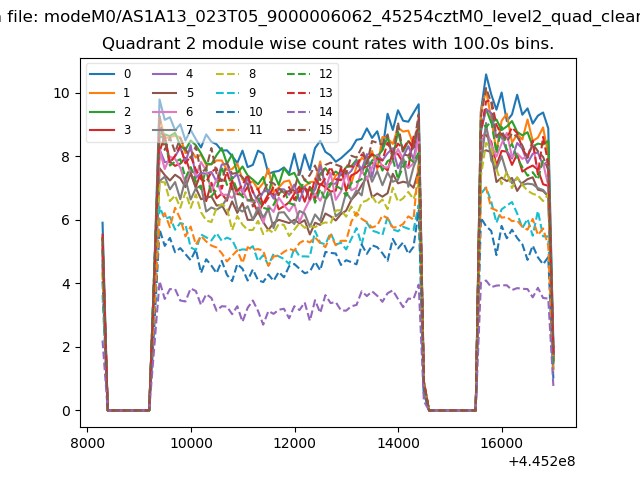
| Module-wise count rates for Quadrant B Data is divided into 100 sec bins |
 |
 |
| Module-wise count rates for Quadrant C Data is divided into 100 sec bins |
 |
 |
| Module-wise count rates for Quadrant D Data is divided into 100 sec bins |
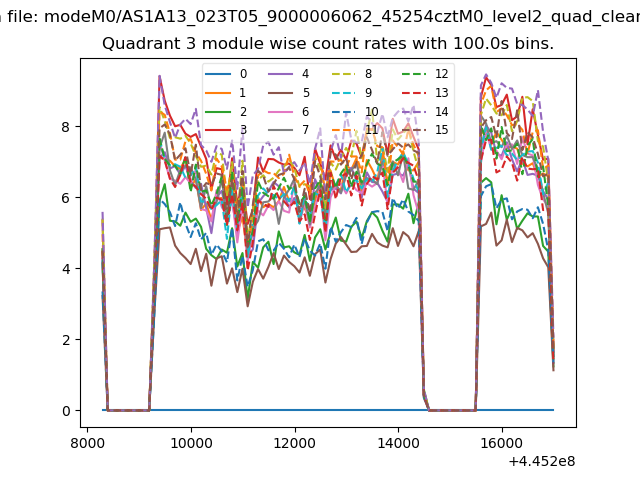 |
 |
| Parameter | Plot |
|---|---|
| CZT HV Monitor | 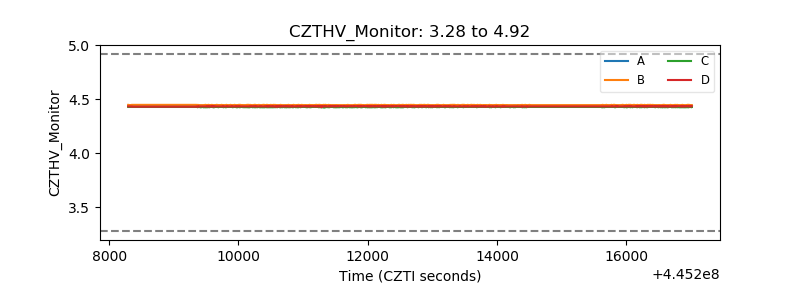 |
| D_VDD | 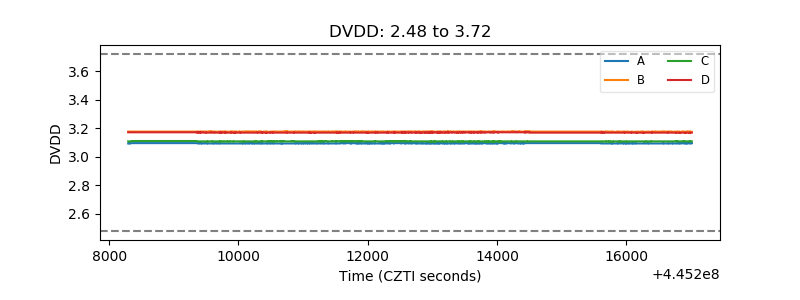 |
| Temperature 1 | 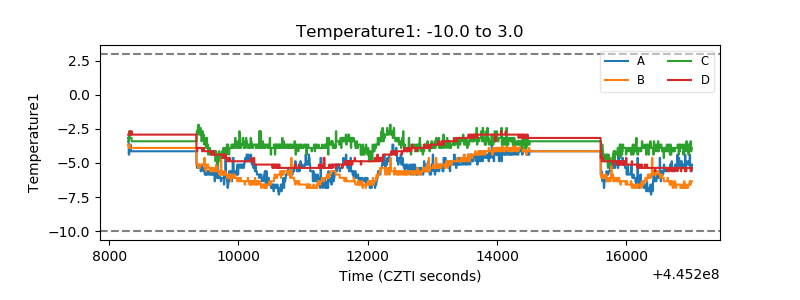 |
| Veto HV Monitor | 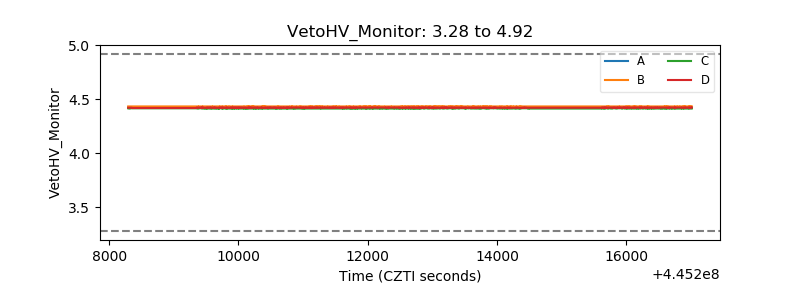 |
| Veto LLD | 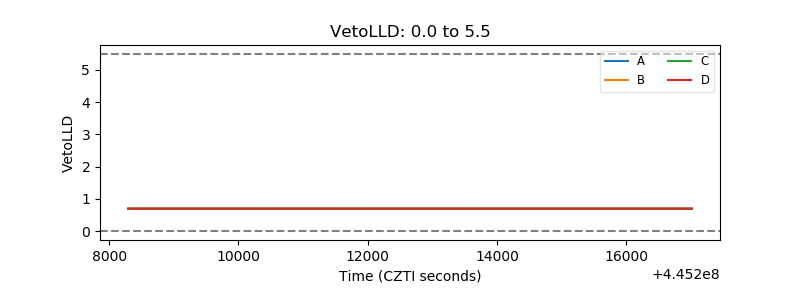 |
| Alpha Counter | 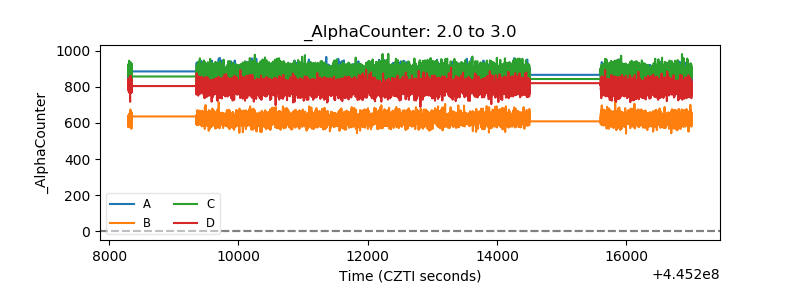 |
| _CPM_Rate | 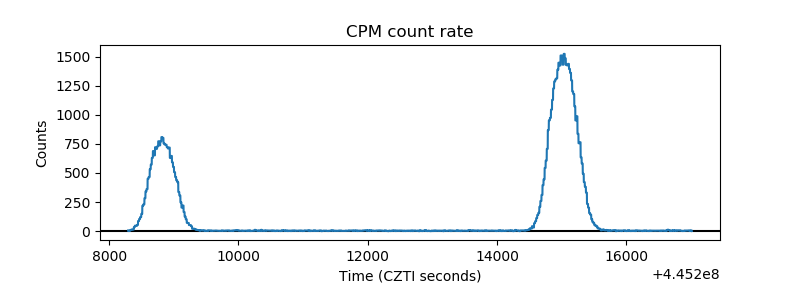 |
| CZT Counter | 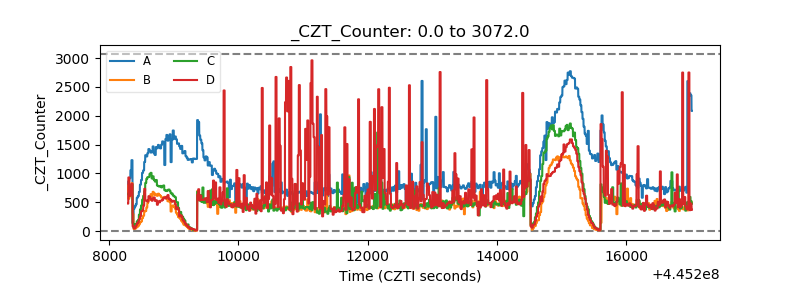 |
| +2.5 Volts monitor | 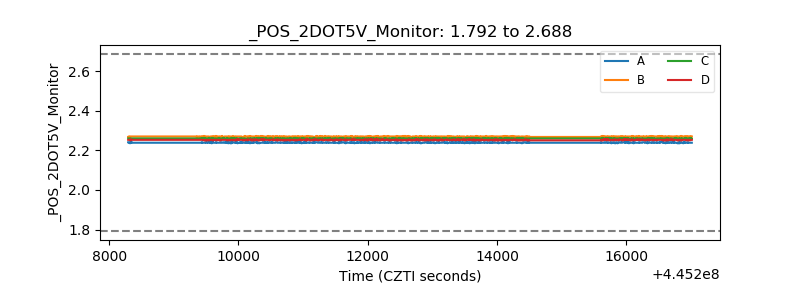 |
| +5 Volts monitor | 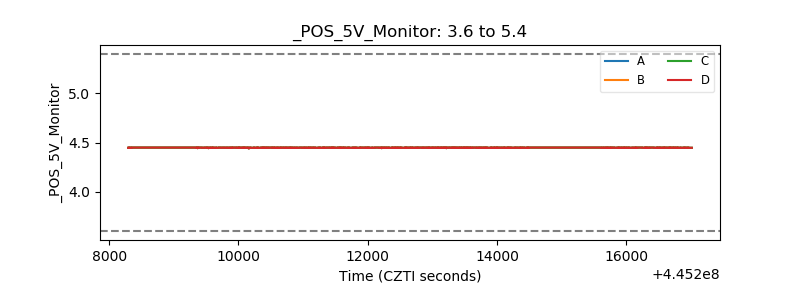 |
| _ROLL_ROT | 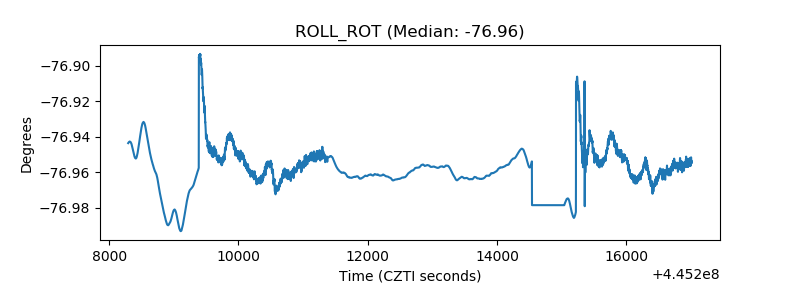 |
| _Roll_DEC | 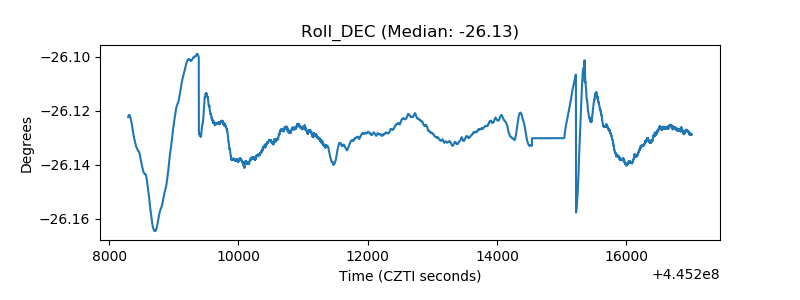 |
| _Roll_RA | 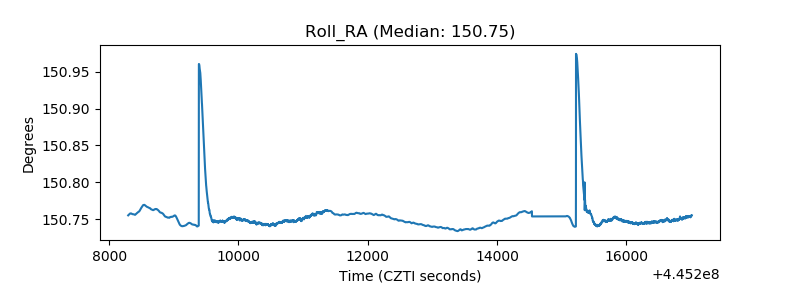 |
| Veto Counter | 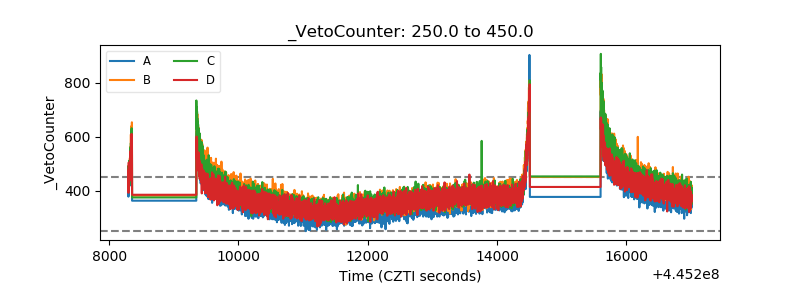 |