| Param | Original file | Final file |
|---|---|---|
| Filename | modeM0/AS1A13_023T05_9000006062_45255cztM0_level2.fits | modeM0/AS1A13_023T05_9000006062_45255cztM0_level2_quad_clean.evt |
| Size (bytes) | 494,726,400 | 109,071,360 |
| Size | 471.8 MB | 104.0 MB |
| Events in quadrant A | 7,129,524 | 672,600 |
| Events in quadrant B | 3,013,369 | 785,793 |
| Events in quadrant C | 3,370,824 | 739,329 |
| Events in quadrant D | 4,305,206 | 660,659 |
| Mode SS | |||
|---|---|---|---|
| Quadrant | BADHDUFLAG | Total packets | Discarded packets |
| A | 0 | 130 | 0 |
| B | 0 | 130 | 0 |
| C | 0 | 130 | 0 |
| D | 0 | 130 | 0 |
| Mode M9 | |||
|---|---|---|---|
| Quadrant | BADHDUFLAG | Total packets | Discarded packets |
| A | 0 | 17 | 0 |
| B | 0 | 18 | 0 |
| C | 0 | 18 | 0 |
| D | 0 | 18 | 0 |
| Mode M0 | |||
|---|---|---|---|
| Quadrant | BADHDUFLAG | Total packets | Discarded packets |
| A | 0 | 25794 | 2 |
| B | 0 | 13170 | 2 |
| C | 0 | 14206 | 2 |
| D | 0 | 17158 | 2 |
| Quadrant | Total seconds | Saturated seconds | Saturation percentage |
|---|---|---|---|
| A | 6368 | 837 | 13.143844% |
| B | 6368 | 20 | 0.314070% |
| C | 6368 | 86 | 1.350503% |
| D | 6368 | 177 | 2.779523% |
Noise dominated data is calculated using 1-second bins in cleaned event files. If a bin has >2000 counts, and if more than 50% of those come from <1% of pixels, then it is considered to be noise-dominated and hence unusable.
| Quadrant | # 1 sec bins | Bins with >0 counts | Bins with >2000 counts | High rate bins dominated by noise | Noise dominated (total time) | Noise dominated (detector-on time) | Marked lightcurve |
|---|---|---|---|---|---|---|---|
| A | 7573 | 6368 | 674 | 674 | 8.90% | 10.58% | 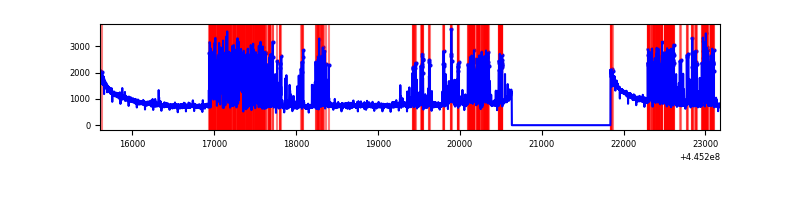 |
| B | 7573 | 6369 | 4 | 4 | 0.05% | 0.06% | 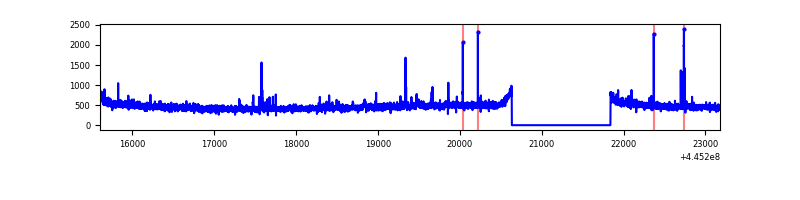 |
| C | 7573 | 6369 | 71 | 71 | 0.94% | 1.11% | 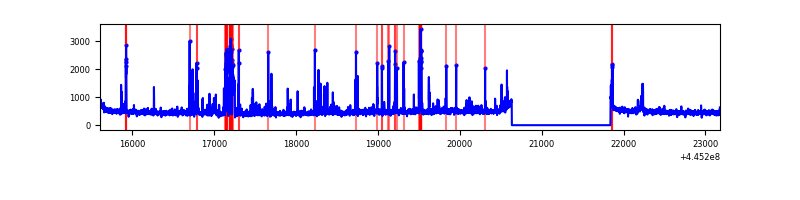 |
| D | 7573 | 6369 | 153 | 153 | 2.02% | 2.40% | 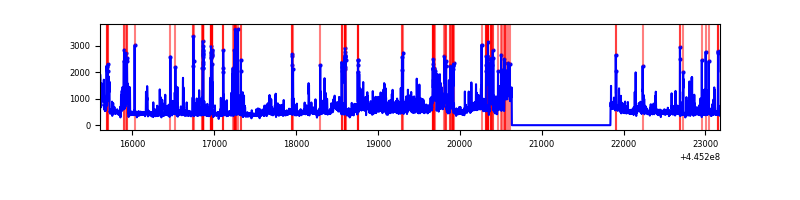 |
Top three noisy pixels from each quadrant. If the there are fewer than three noisy pixels in the level2.evt file, extra rows are filled as -1
| Pixel properties | Quadrant properties | ||||||
|---|---|---|---|---|---|---|---|
| Quadrant | DetID | PixID | Counts | Sigma | Mean | Median | Sigma |
| A | 10 | 83 | 2256607 | 15347.94 | 707 | 694 | 147.0 |
| A | 13 | 248 | 2145742 | 14593.68 | 707 | 694 | 147.0 |
| A | 3 | 137 | 7633 | 47.21 | 707 | 694 | 147.0 |
| B | 5 | 172 | 29778 | 199.73 | 747 | 723 | 145.5 |
| B | 12 | 111 | 18484 | 122.09 | 747 | 723 | 145.5 |
| B | 14 | 111 | 17070 | 112.37 | 747 | 723 | 145.5 |
| C | 14 | 254 | 351591 | 2026.11 | 735 | 740 | 173.2 |
| C | 1 | 3 | 100993 | 578.94 | 735 | 740 | 173.2 |
| C | 15 | 208 | 19002 | 105.46 | 735 | 740 | 173.2 |
| D | 11 | 241 | 750090 | 4129.89 | 721 | 701 | 181.5 |
| D | 13 | 249 | 210050 | 1153.73 | 721 | 701 | 181.5 |
| D | 5 | 222 | 191747 | 1052.86 | 721 | 701 | 181.5 |
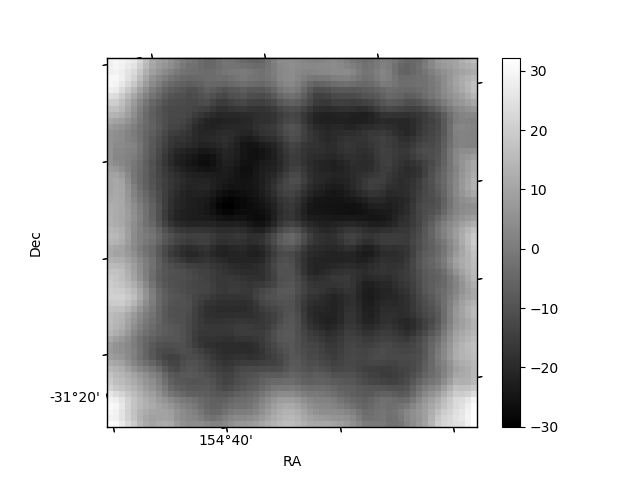
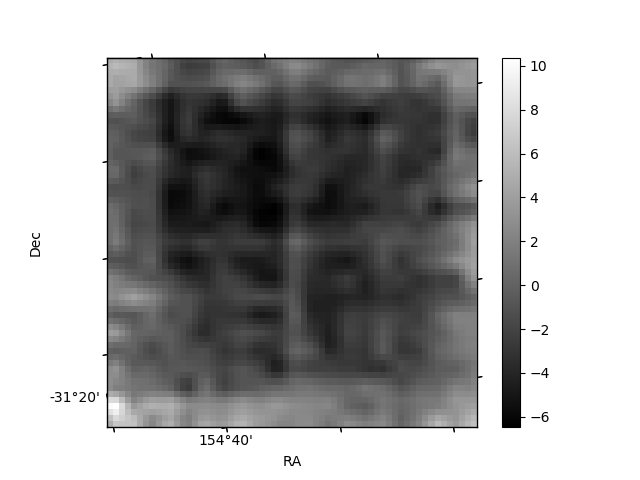
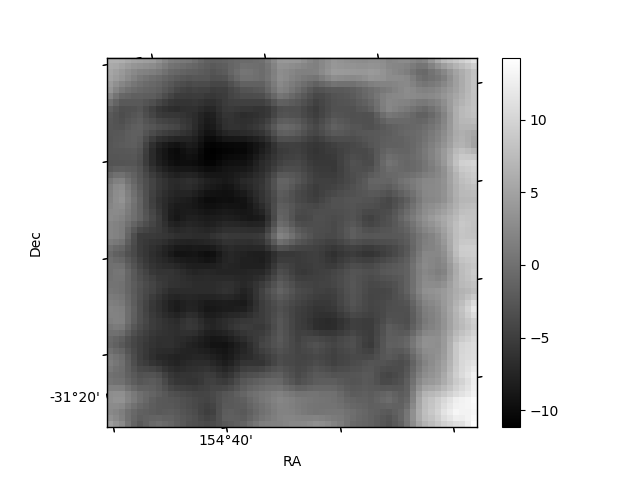
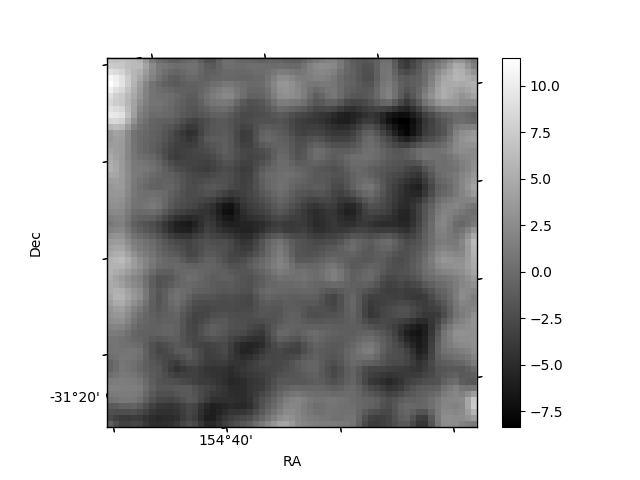
Histogram calculated using DETX and DETY for each event in the final _common_clean file
| Quadrant A | 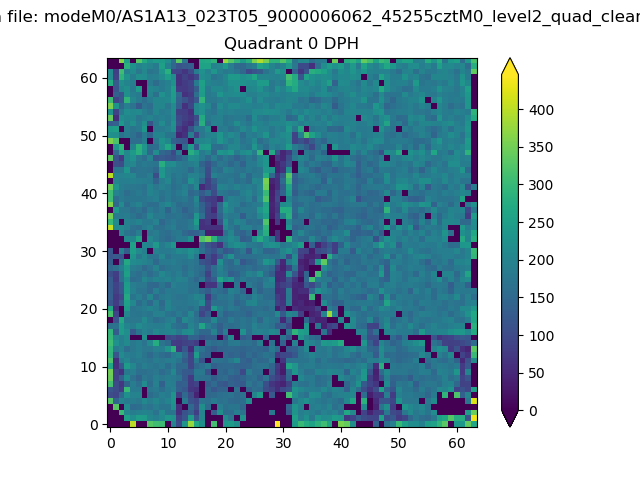 |
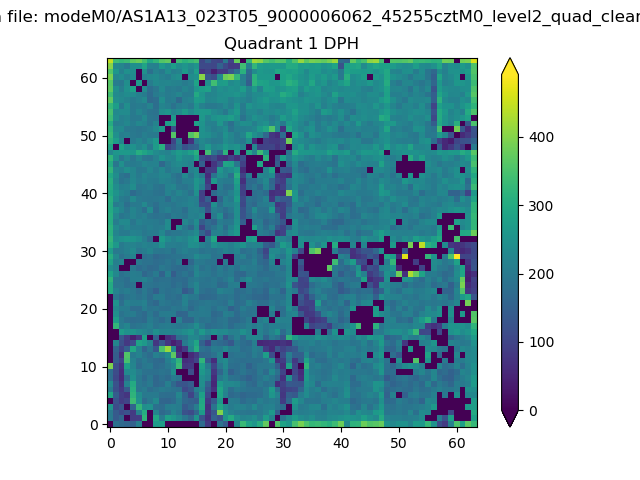 |
Quadrant B |
|---|---|---|---|
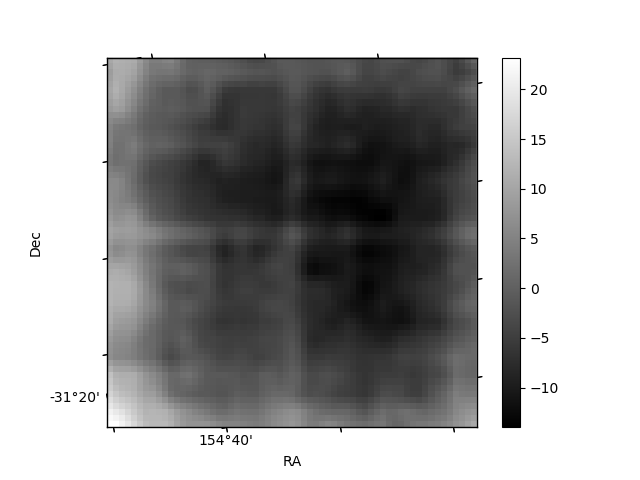
| Quadrant D | 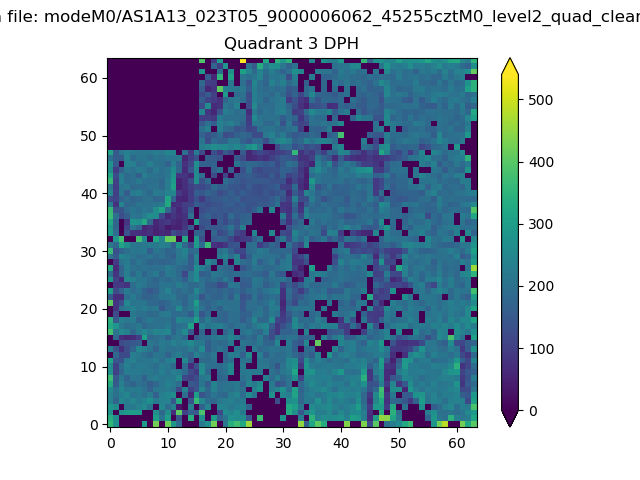 |
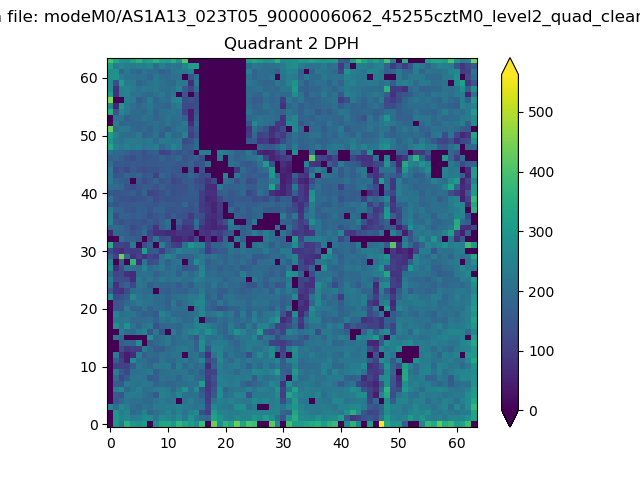 |
Quadrant C |
| Plot type | Count rate plots | Images |
|---|---|---|
| Comparison with Poisson distribution Blue bars denote a histogram of data divided into 1 sec bins. Red curve is a Poisson curve with rate = median count rate of data. |
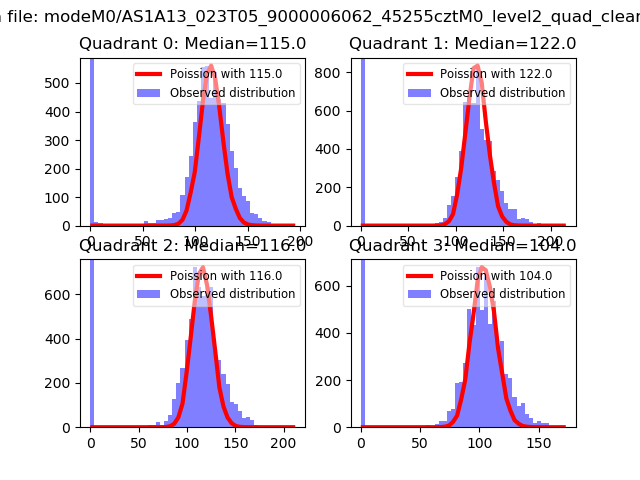 |
 |
| Quadrant-wise count rates Data is divided into 100 sec bins |
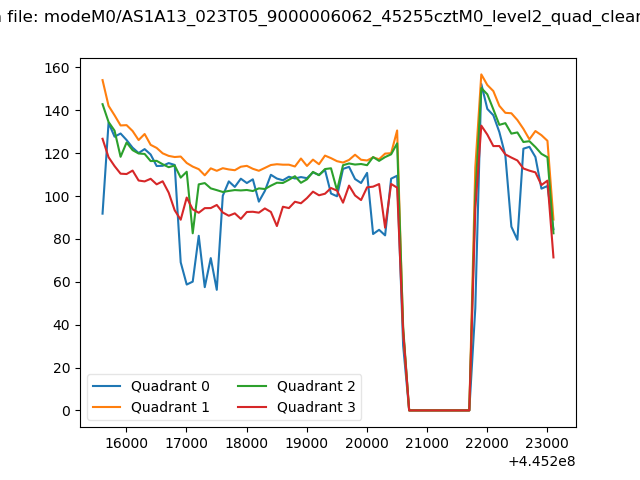 |
|
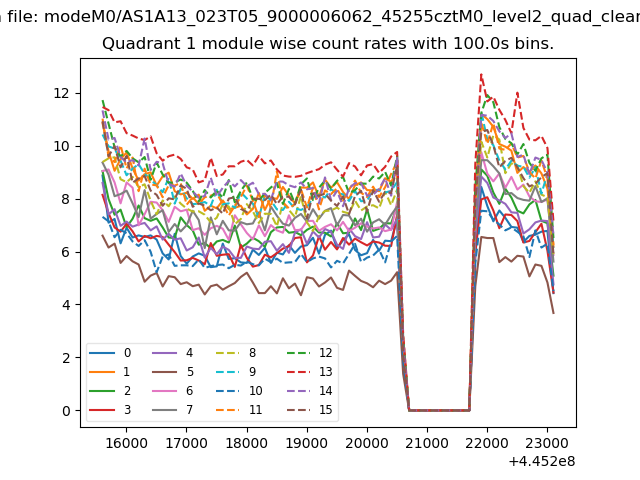
| Module-wise count rates for Quadrant A Data is divided into 100 sec bins |
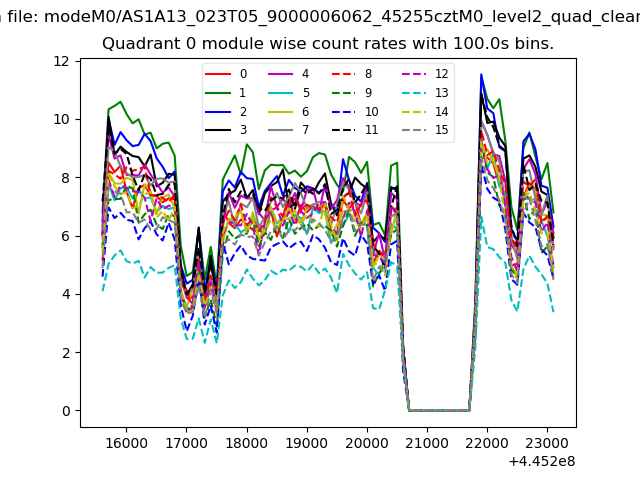 |
 |
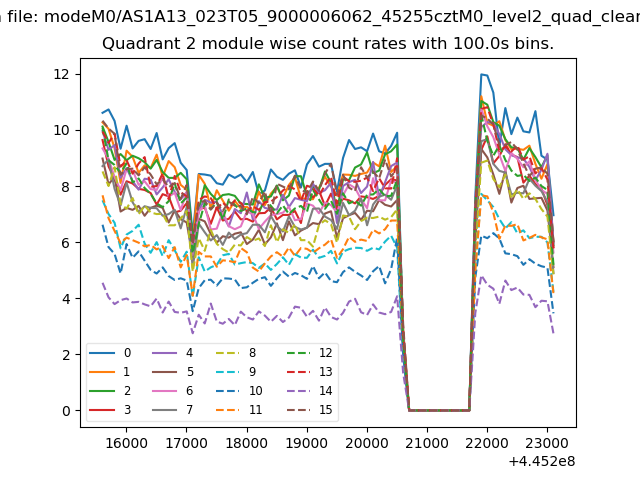
| Module-wise count rates for Quadrant B Data is divided into 100 sec bins |
 |
 |
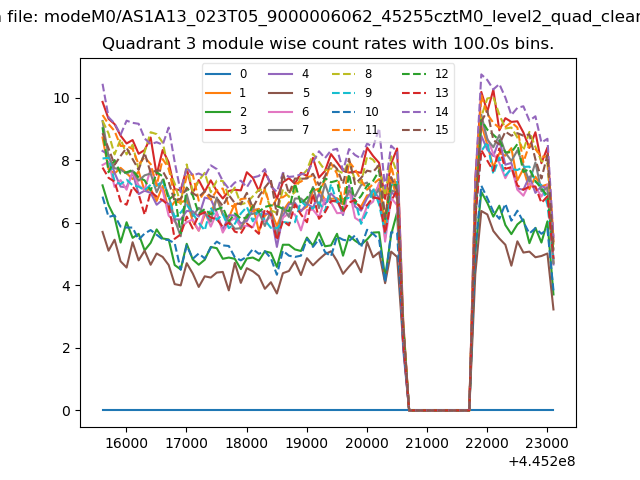
| Module-wise count rates for Quadrant C Data is divided into 100 sec bins |
 |
 |
| Module-wise count rates for Quadrant D Data is divided into 100 sec bins |
 |
 |
| Parameter | Plot |
|---|---|
| CZT HV Monitor | 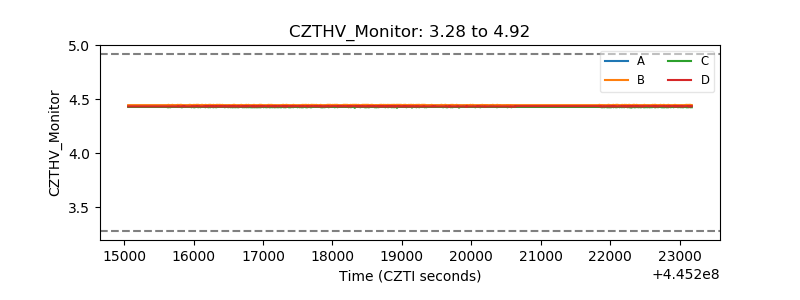 |
| D_VDD | 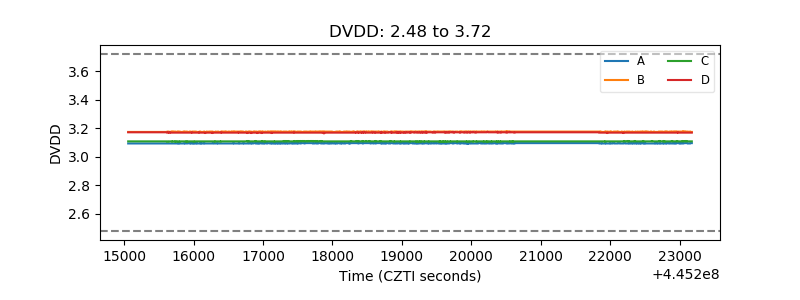 |
| Temperature 1 | 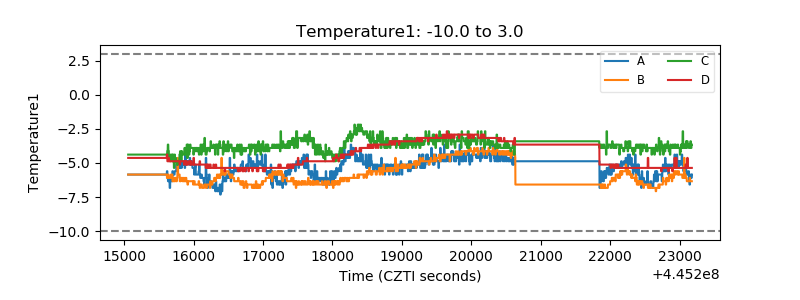 |
| Veto HV Monitor | 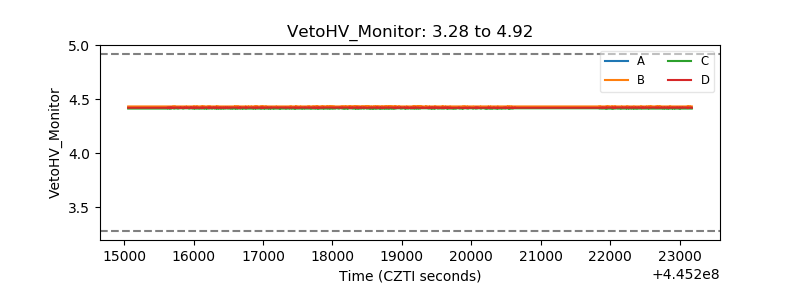 |
| Veto LLD | 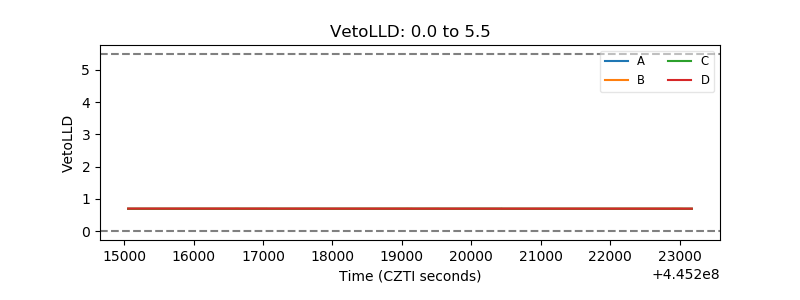 |
| Alpha Counter | 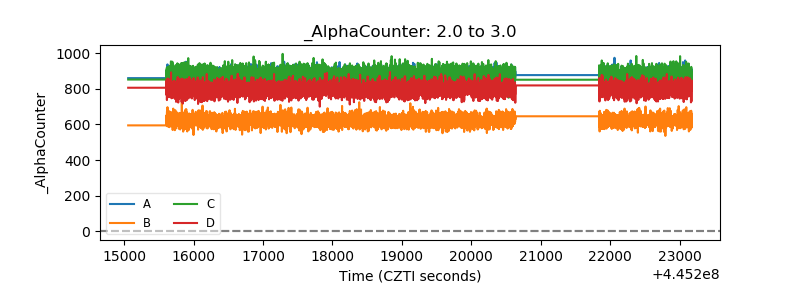 |
| _CPM_Rate | 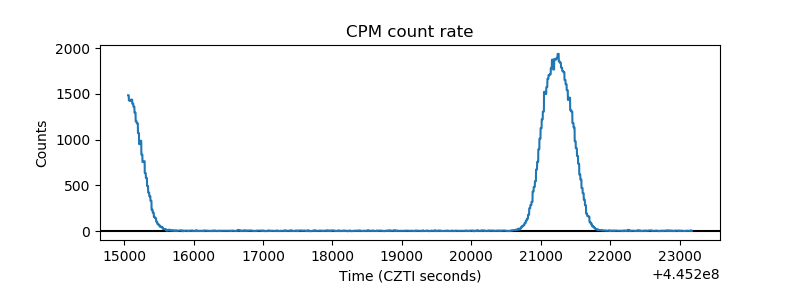 |
| CZT Counter | 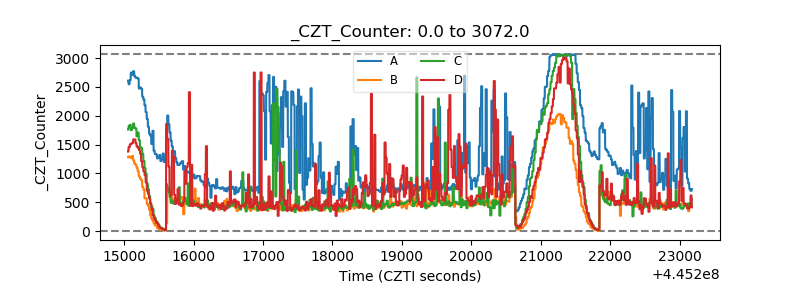 |
| +2.5 Volts monitor | 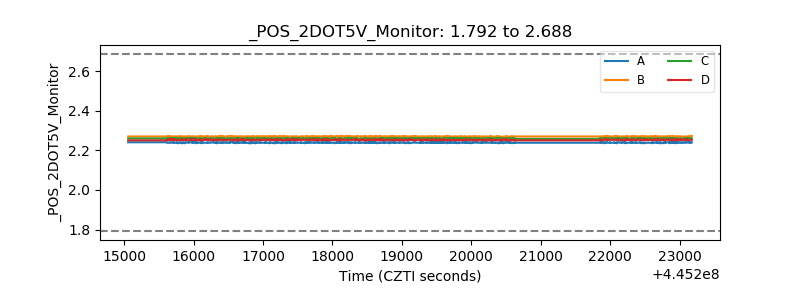 |
| +5 Volts monitor | 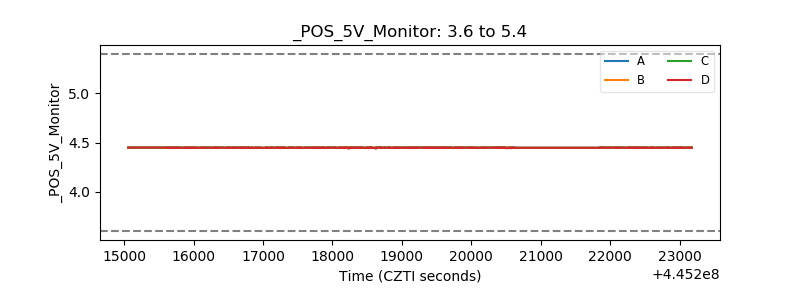 |
| _ROLL_ROT | 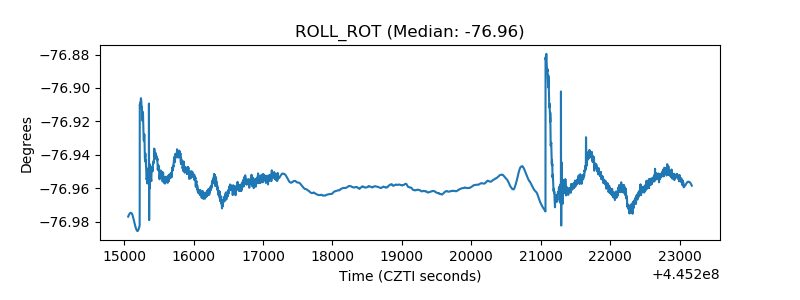 |
| _Roll_DEC | 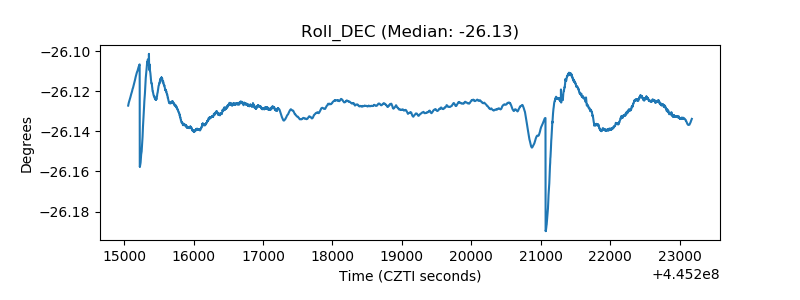 |
| _Roll_RA | 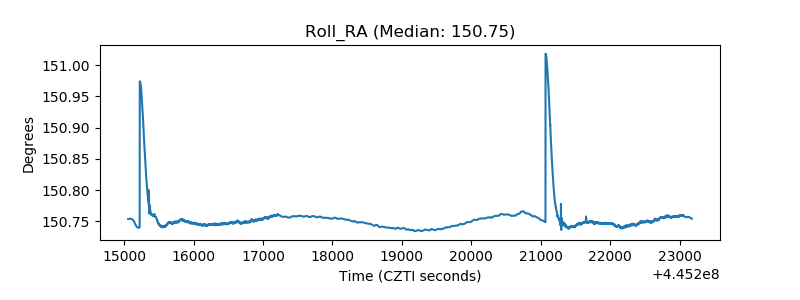 |
| Veto Counter | 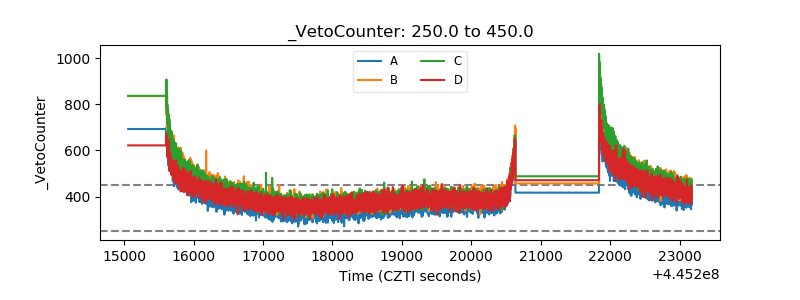 |