| Param | Original file | Final file |
|---|---|---|
| Filename | modeM0/AS1A13_023T05_9000006062_45256cztM0_level2.fits | modeM0/AS1A13_023T05_9000006062_45256cztM0_level2_quad_clean.evt |
| Size (bytes) | 455,405,760 | 114,500,160 |
| Size | 434.3 MB | 109.2 MB |
| Events in quadrant A | 5,797,259 | 749,261 |
| Events in quadrant B | 3,089,943 | 813,864 |
| Events in quadrant C | 3,636,303 | 764,349 |
| Events in quadrant D | 3,839,474 | 695,796 |
| Mode SS | |||
|---|---|---|---|
| Quadrant | BADHDUFLAG | Total packets | Discarded packets |
| A | 0 | 128 | 0 |
| B | 0 | 128 | 0 |
| C | 0 | 128 | 0 |
| D | 0 | 128 | 0 |
| Mode M9 | |||
|---|---|---|---|
| Quadrant | BADHDUFLAG | Total packets | Discarded packets |
| A | 0 | 16 | 0 |
| B | 0 | 16 | 0 |
| C | 0 | 17 | 0 |
| D | 0 | 17 | 0 |
| Mode M0 | |||
|---|---|---|---|
| Quadrant | BADHDUFLAG | Total packets | Discarded packets |
| A | 0 | 22058 | 2 |
| B | 0 | 13218 | 2 |
| C | 0 | 14857 | 2 |
| D | 0 | 15548 | 2 |
| Quadrant | Total seconds | Saturated seconds | Saturation percentage |
|---|---|---|---|
| A | 6369 | 301 | 4.726017% |
| B | 6369 | 56 | 0.879259% |
| C | 6369 | 160 | 2.512168% |
| D | 6369 | 107 | 1.680013% |
Noise dominated data is calculated using 1-second bins in cleaned event files. If a bin has >2000 counts, and if more than 50% of those come from <1% of pixels, then it is considered to be noise-dominated and hence unusable.
| Quadrant | # 1 sec bins | Bins with >0 counts | Bins with >2000 counts | High rate bins dominated by noise | Noise dominated (total time) | Noise dominated (detector-on time) | Marked lightcurve |
|---|---|---|---|---|---|---|---|
| A | 7599 | 6369 | 183 | 183 | 2.41% | 2.87% | 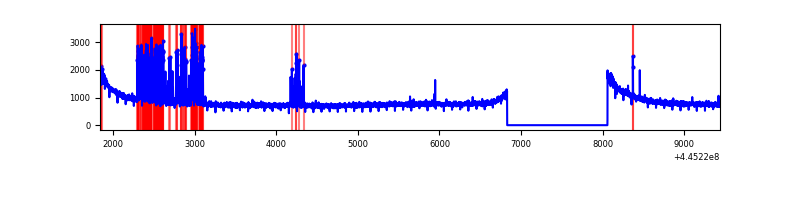 |
| B | 7599 | 6370 | 2 | 2 | 0.03% | 0.03% | 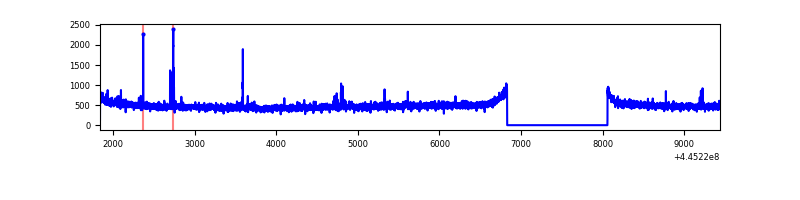 |
| C | 7599 | 6369 | 122 | 122 | 1.61% | 1.92% | 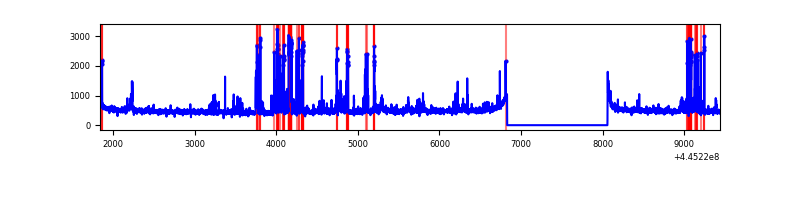 |
| D | 7599 | 6370 | 84 | 84 | 1.11% | 1.32% | 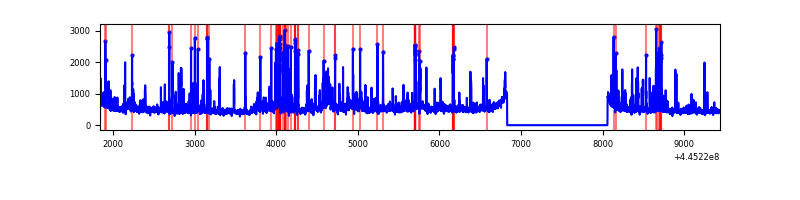 |
Top three noisy pixels from each quadrant. If the there are fewer than three noisy pixels in the level2.evt file, extra rows are filled as -1
| Pixel properties | Quadrant properties | ||||||
|---|---|---|---|---|---|---|---|
| Quadrant | DetID | PixID | Counts | Sigma | Mean | Median | Sigma |
| A | 10 | 83 | 2288631 | 14790.89 | 751 | 738 | 154.7 |
| A | 13 | 248 | 599176 | 3868.81 | 751 | 738 | 154.7 |
| A | 3 | 137 | 8189 | 48.17 | 751 | 738 | 154.7 |
| B | 5 | 172 | 28917 | 188.69 | 770 | 747 | 149.3 |
| B | 12 | 111 | 19246 | 123.91 | 770 | 747 | 149.3 |
| B | 0 | 246 | 18576 | 119.42 | 770 | 747 | 149.3 |
| C | 1 | 3 | 536433 | 2996.73 | 761 | 769 | 178.7 |
| C | 14 | 254 | 94693 | 525.45 | 761 | 769 | 178.7 |
| C | 3 | 233 | 18251 | 97.8 | 761 | 769 | 178.7 |
| D | 11 | 241 | 473476 | 2541.71 | 751 | 731 | 186.0 |
| D | 2 | 249 | 184881 | 990.08 | 751 | 731 | 186.0 |
| D | 13 | 249 | 152387 | 815.38 | 751 | 731 | 186.0 |
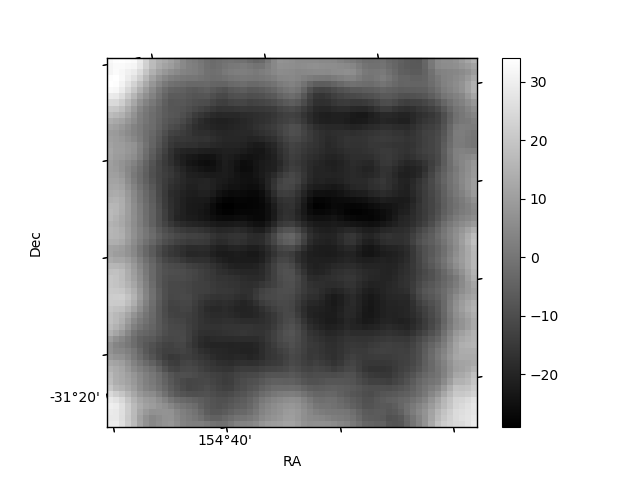
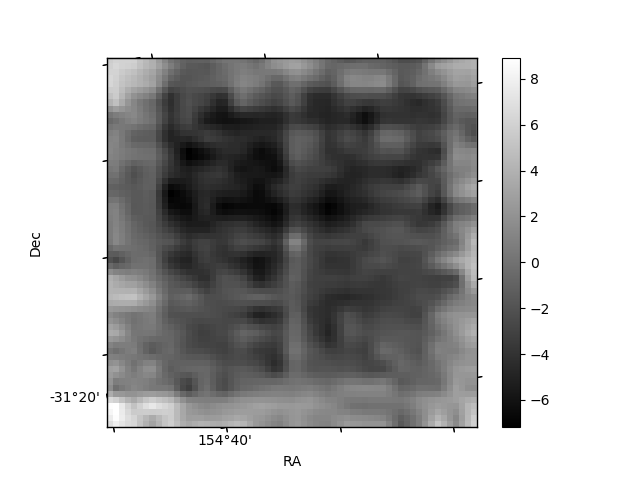
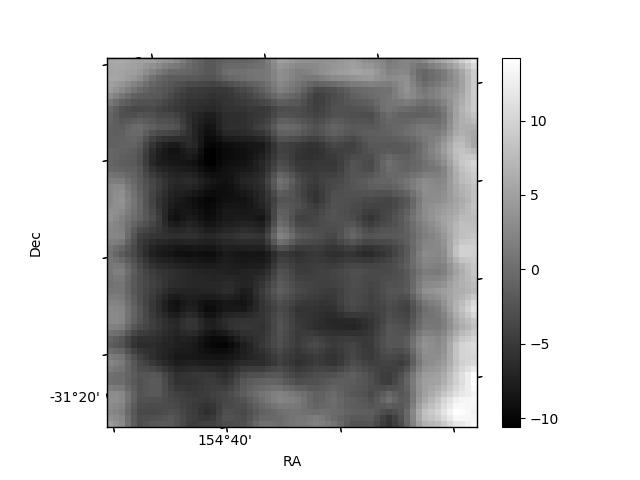
Histogram calculated using DETX and DETY for each event in the final _common_clean file
| Quadrant A | 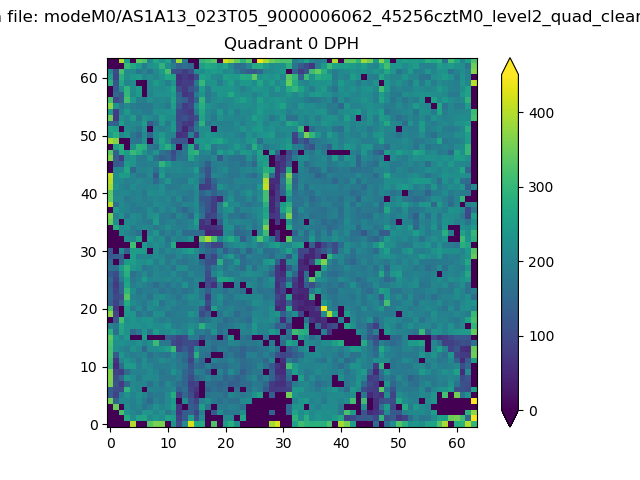 |
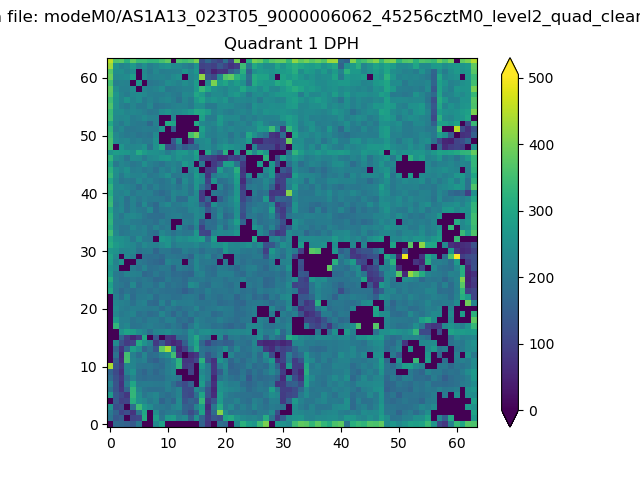 |
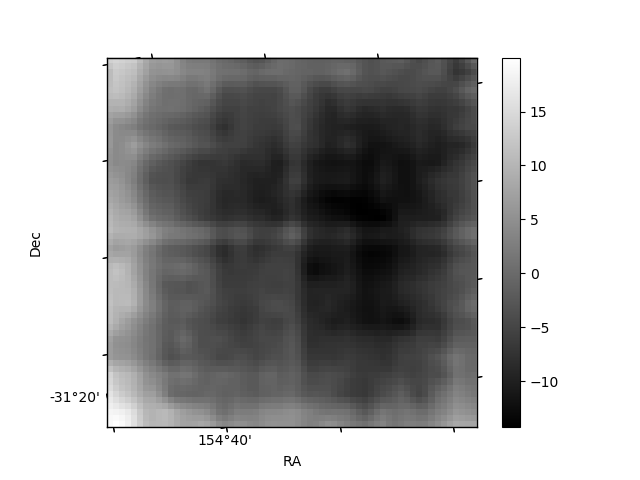
Quadrant B |
|---|---|---|---|
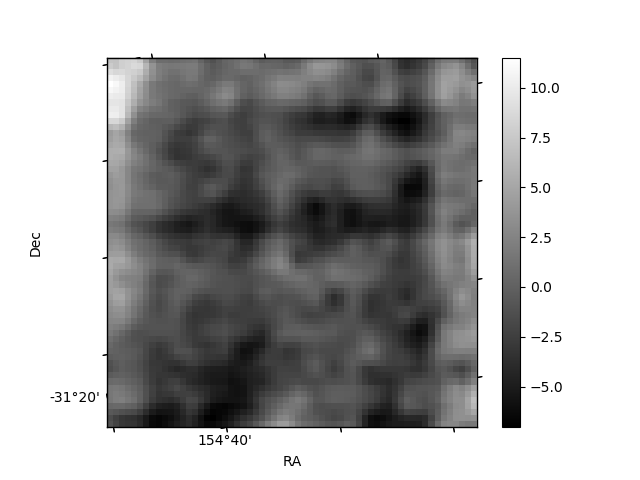
| Quadrant D | 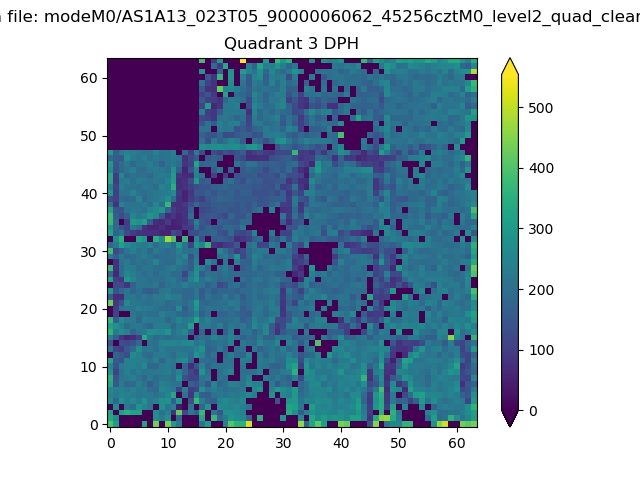 |
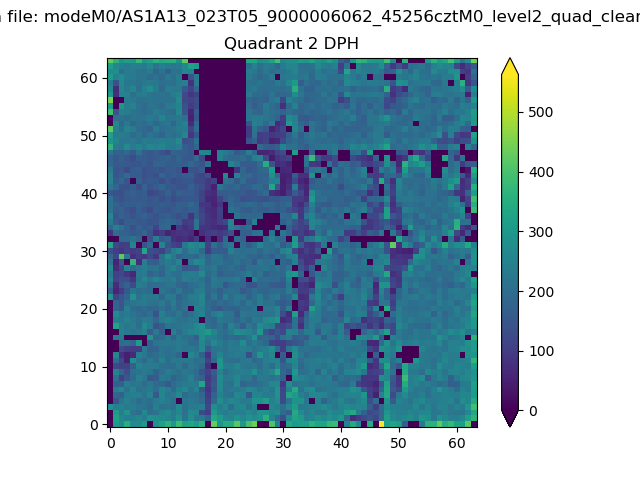 |
Quadrant C |
| Plot type | Count rate plots | Images |
|---|---|---|
| Comparison with Poisson distribution Blue bars denote a histogram of data divided into 1 sec bins. Red curve is a Poisson curve with rate = median count rate of data. |
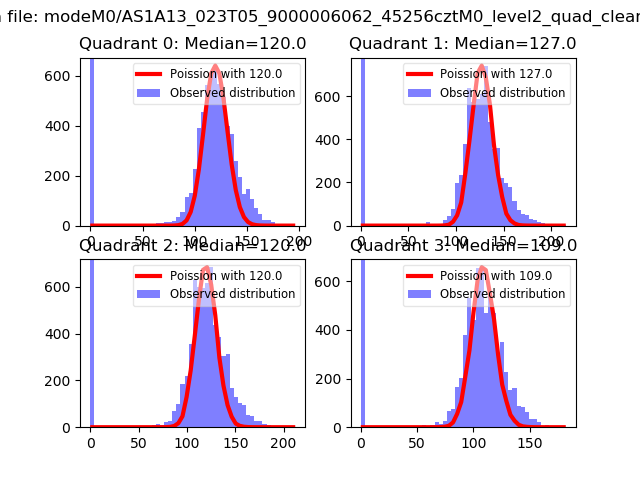 |
 |
| Quadrant-wise count rates Data is divided into 100 sec bins |
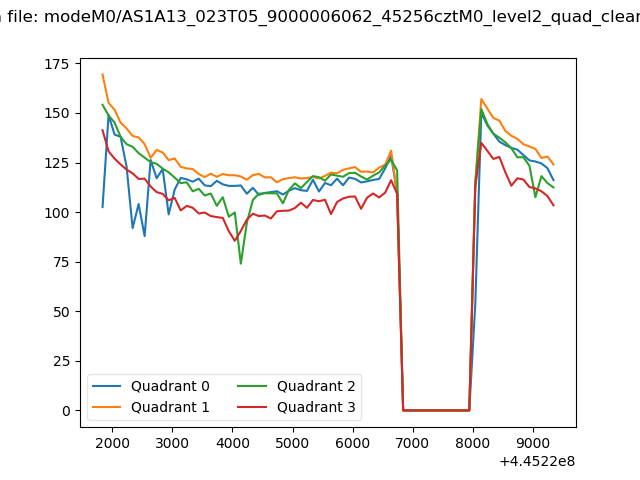 |
|
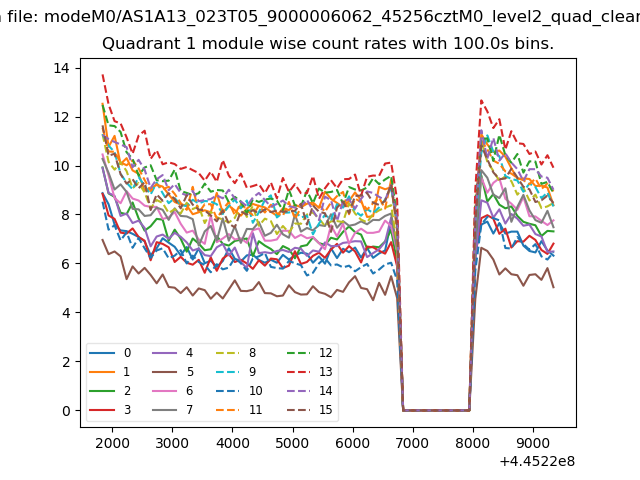
| Module-wise count rates for Quadrant A Data is divided into 100 sec bins |
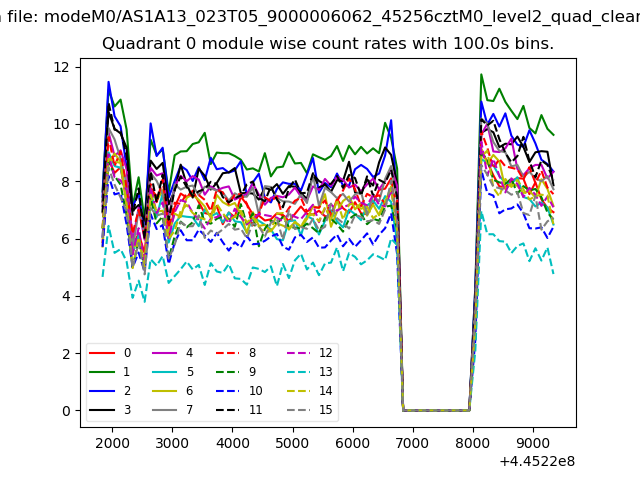 |
 |
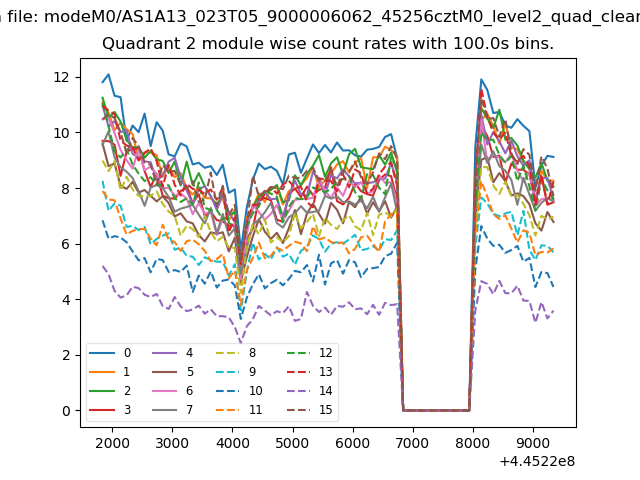
| Module-wise count rates for Quadrant B Data is divided into 100 sec bins |
 |
 |
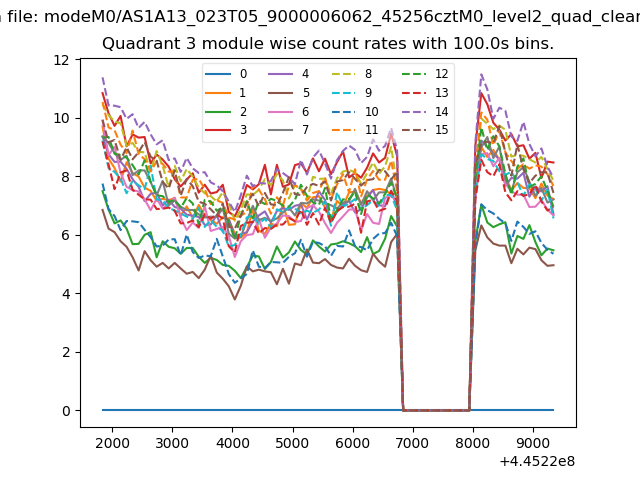
| Module-wise count rates for Quadrant C Data is divided into 100 sec bins |
 |
 |
| Module-wise count rates for Quadrant D Data is divided into 100 sec bins |
 |
 |
| Parameter | Plot |
|---|---|
| CZT HV Monitor | 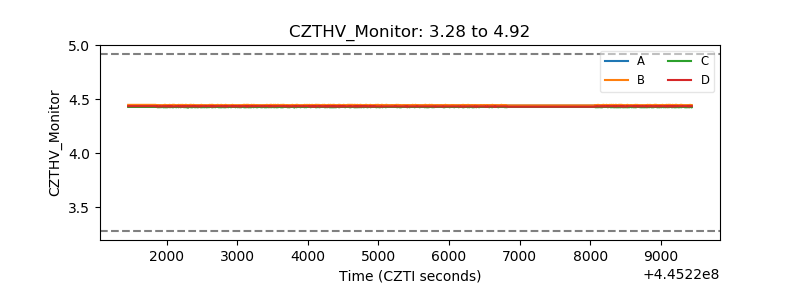 |
| D_VDD | 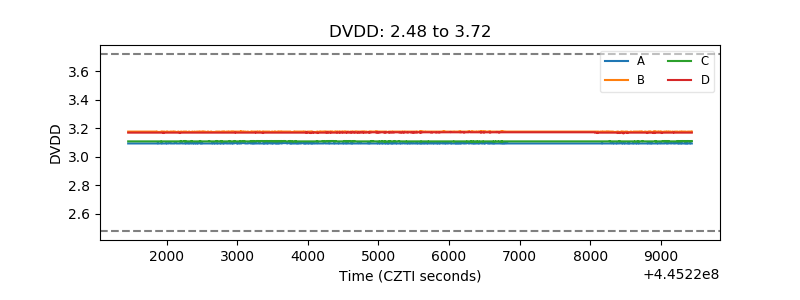 |
| Temperature 1 | 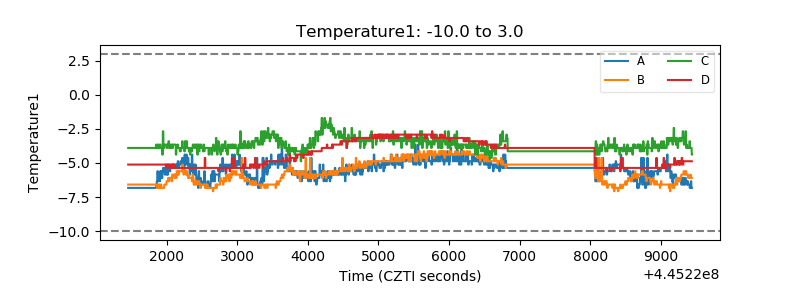 |
| Veto HV Monitor | 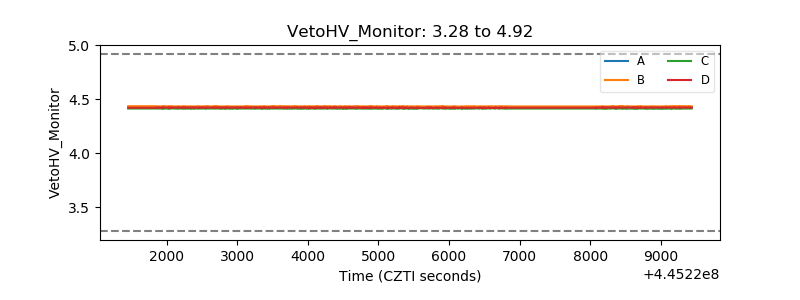 |
| Veto LLD | 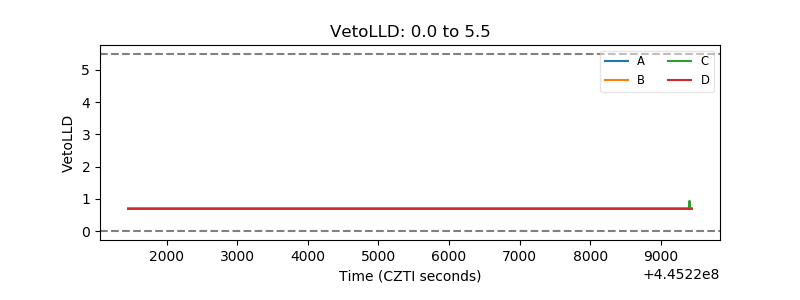 |
| Alpha Counter | 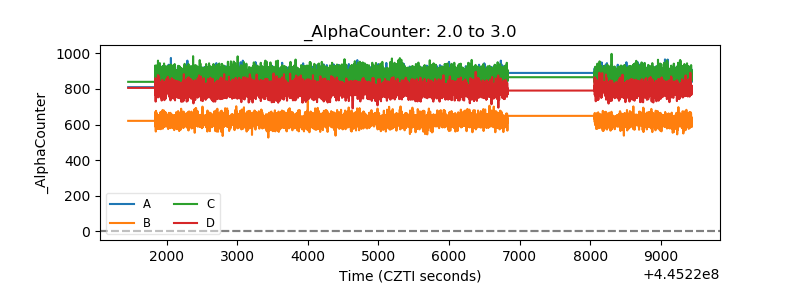 |
| _CPM_Rate | 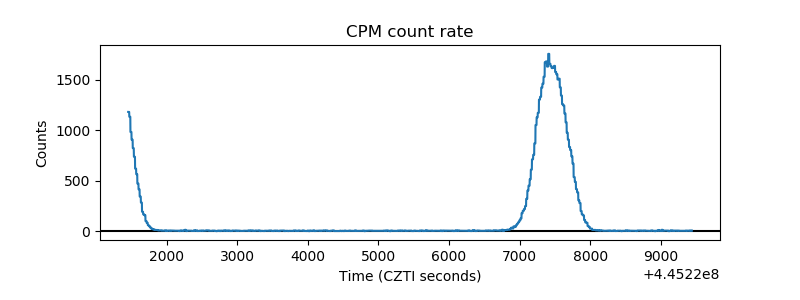 |
| CZT Counter | 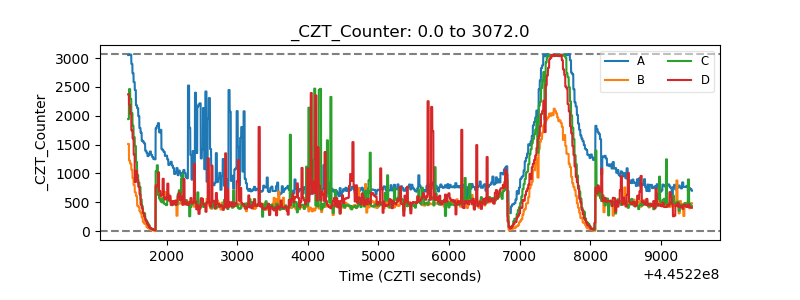 |
| +2.5 Volts monitor | 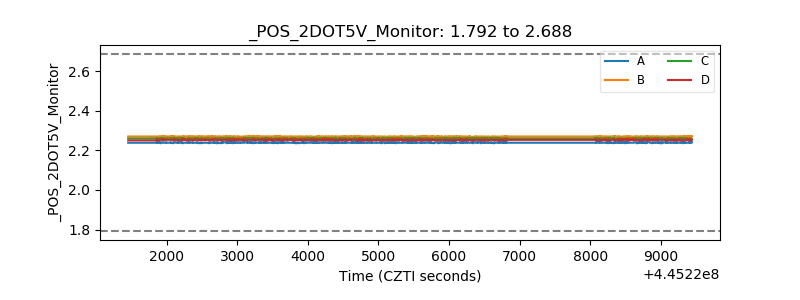 |
| +5 Volts monitor | 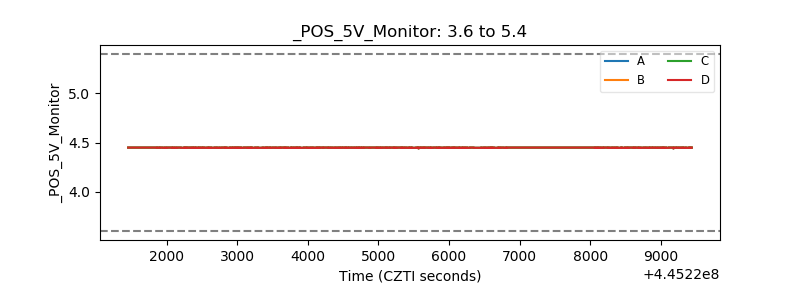 |
| _ROLL_ROT | 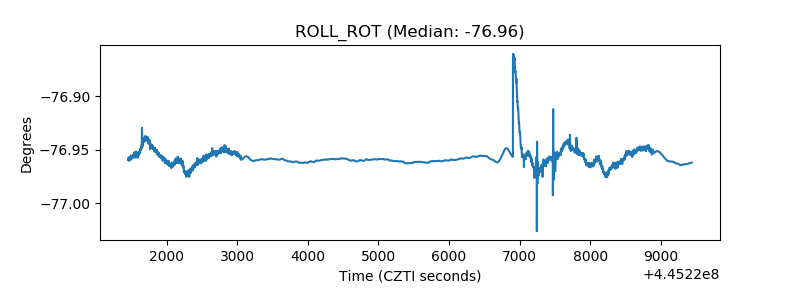 |
| _Roll_DEC | 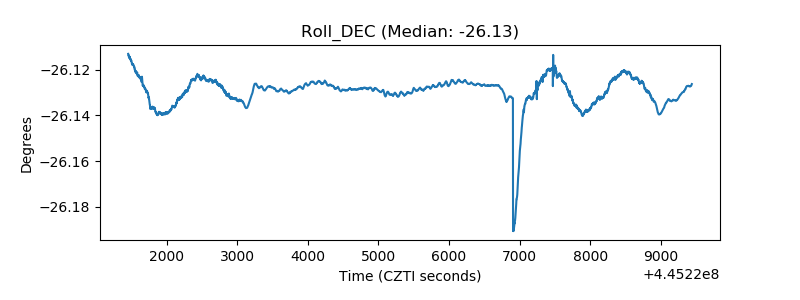 |
| _Roll_RA | 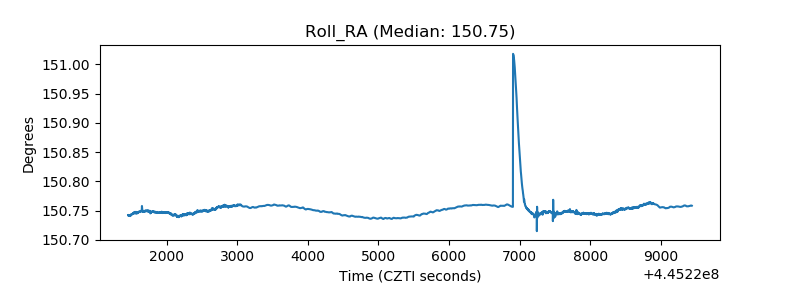 |
| Veto Counter | 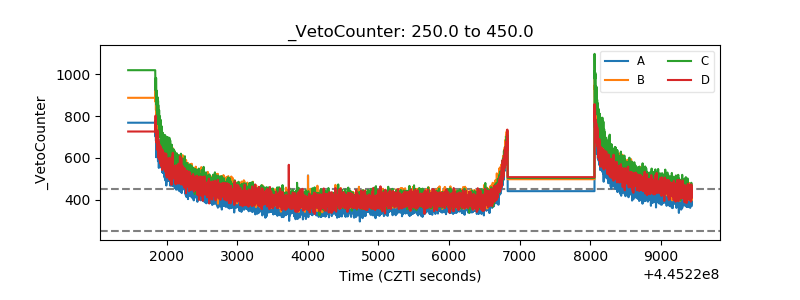 |