| Param | Original file | Final file |
|---|---|---|
| Filename | modeM0/AS1A13_023T05_9000006062_45258cztM0_level2.fits | modeM0/AS1A13_023T05_9000006062_45258cztM0_level2_quad_clean.evt |
| Size (bytes) | 452,157,120 | 105,534,720 |
| Size | 431.2 MB | 100.6 MB |
| Events in quadrant A | 4,909,668 | 710,560 |
| Events in quadrant B | 2,982,926 | 747,338 |
| Events in quadrant C | 2,958,503 | 712,651 |
| Events in quadrant D | 5,403,373 | 590,948 |
| Mode SS | |||
|---|---|---|---|
| Quadrant | BADHDUFLAG | Total packets | Discarded packets |
| A | 0 | 128 | 0 |
| B | 0 | 128 | 0 |
| C | 0 | 128 | 0 |
| D | 0 | 128 | 0 |
| Mode M9 | |||
|---|---|---|---|
| Quadrant | BADHDUFLAG | Total packets | Discarded packets |
| A | 0 | 10 | 0 |
| B | 0 | 10 | 0 |
| C | 0 | 10 | 0 |
| D | 0 | 10 | 0 |
| Mode M0 | |||
|---|---|---|---|
| Quadrant | BADHDUFLAG | Total packets | Discarded packets |
| A | 0 | 19388 | 1 |
| B | 0 | 12952 | 1 |
| C | 0 | 12941 | 1 |
| D | 0 | 20149 | 1 |
| Quadrant | Total seconds | Saturated seconds | Saturation percentage |
|---|---|---|---|
| A | 6216 | 145 | 2.332690% |
| B | 6216 | 110 | 1.769627% |
| C | 6217 | 89 | 1.431559% |
| D | 6217 | 691 | 11.114686% |
Noise dominated data is calculated using 1-second bins in cleaned event files. If a bin has >2000 counts, and if more than 50% of those come from <1% of pixels, then it is considered to be noise-dominated and hence unusable.
| Quadrant | # 1 sec bins | Bins with >0 counts | Bins with >2000 counts | High rate bins dominated by noise | Noise dominated (total time) | Noise dominated (detector-on time) | Marked lightcurve |
|---|---|---|---|---|---|---|---|
| A | 7291 | 6216 | 7 | 7 | 0.10% | 0.11% | 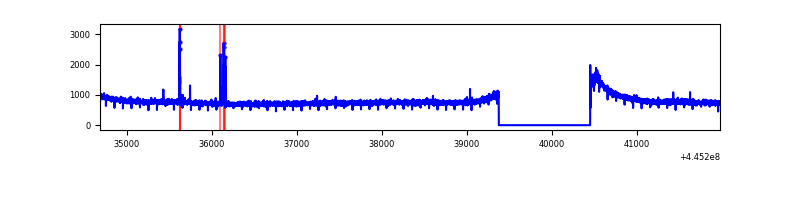 |
| B | 7291 | 6217 | 6 | 6 | 0.08% | 0.10% | 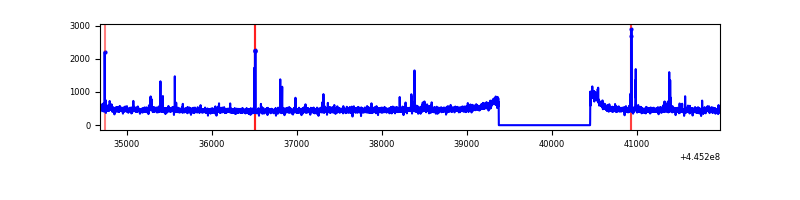 |
| C | 7292 | 6217 | 4 | 4 | 0.05% | 0.06% | 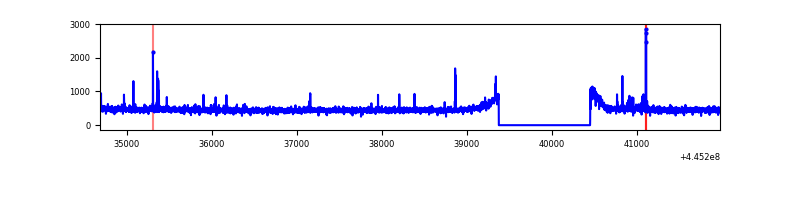 |
| D | 7292 | 6217 | 614 | 614 | 8.42% | 9.88% | 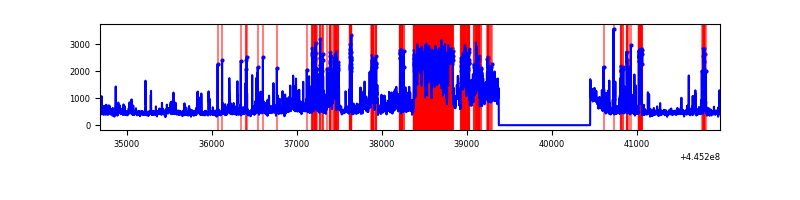 |
Top three noisy pixels from each quadrant. If the there are fewer than three noisy pixels in the level2.evt file, extra rows are filled as -1
| Pixel properties | Quadrant properties | ||||||
|---|---|---|---|---|---|---|---|
| Quadrant | DetID | PixID | Counts | Sigma | Mean | Median | Sigma |
| A | 10 | 83 | 2036650 | 13408.18 | 733 | 716 | 151.8 |
| A | 13 | 248 | 42981 | 278.35 | 733 | 716 | 151.8 |
| A | 3 | 137 | 8555 | 51.63 | 733 | 716 | 151.8 |
| B | 12 | 111 | 18829 | 125.98 | 736 | 713 | 143.8 |
| B | 5 | 172 | 17950 | 119.87 | 736 | 713 | 143.8 |
| B | 14 | 111 | 17172 | 114.46 | 736 | 713 | 143.8 |
| C | 2 | 14 | 24564 | 137.14 | 739 | 744 | 173.7 |
| C | 12 | 249 | 20960 | 116.39 | 739 | 744 | 173.7 |
| C | 1 | 3 | 16849 | 92.72 | 739 | 744 | 173.7 |
| D | 5 | 222 | 1706990 | 9695.19 | 710 | 691 | 176.0 |
| D | 13 | 249 | 369191 | 2093.82 | 710 | 691 | 176.0 |
| D | 11 | 241 | 261178 | 1480.09 | 710 | 691 | 176.0 |
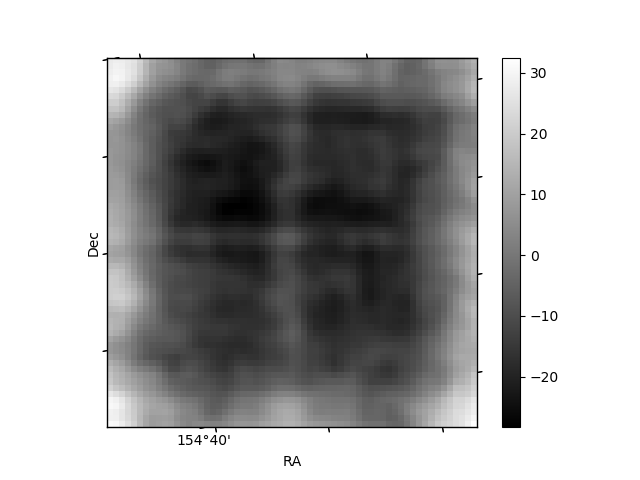
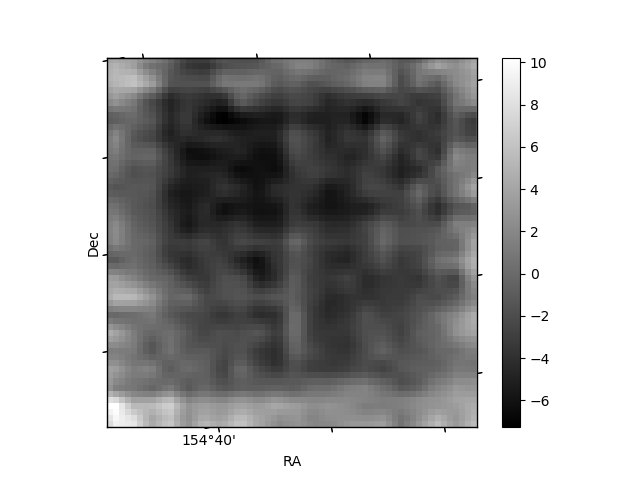
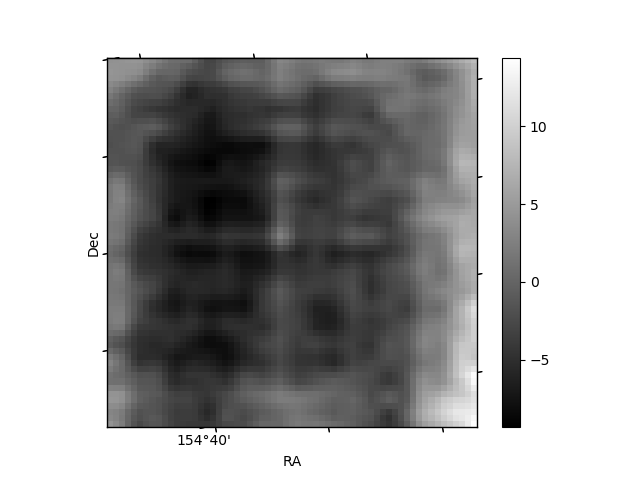
Histogram calculated using DETX and DETY for each event in the final _common_clean file
| Quadrant A | 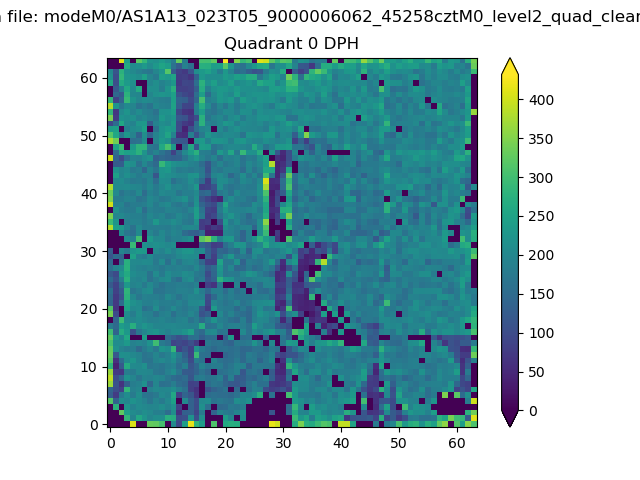 |
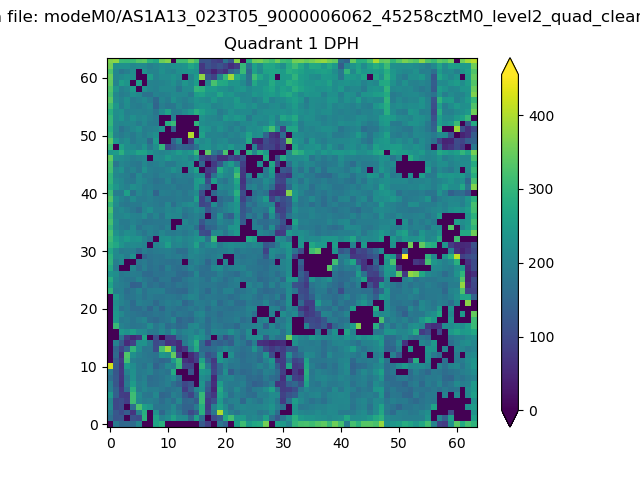 |
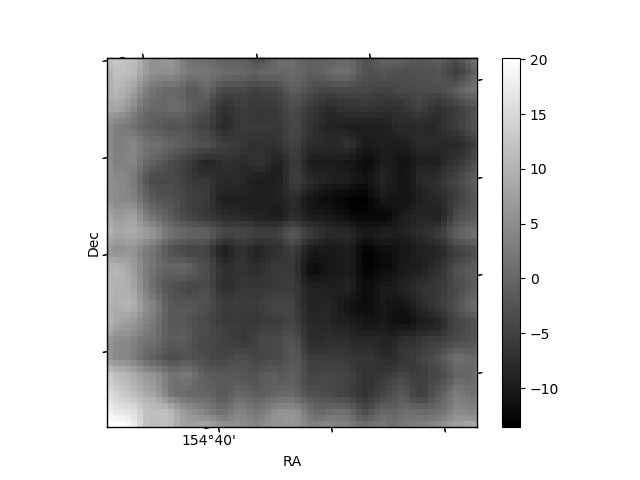
Quadrant B |
|---|---|---|---|
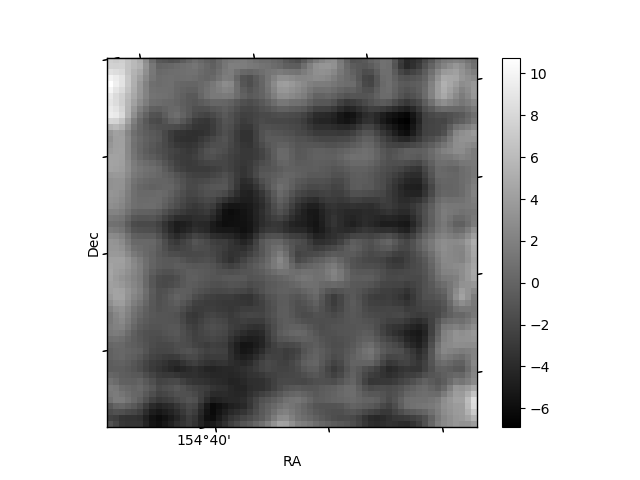
| Quadrant D | 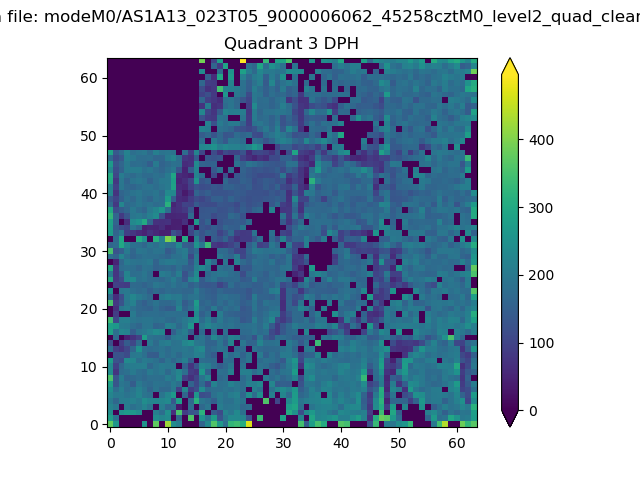 |
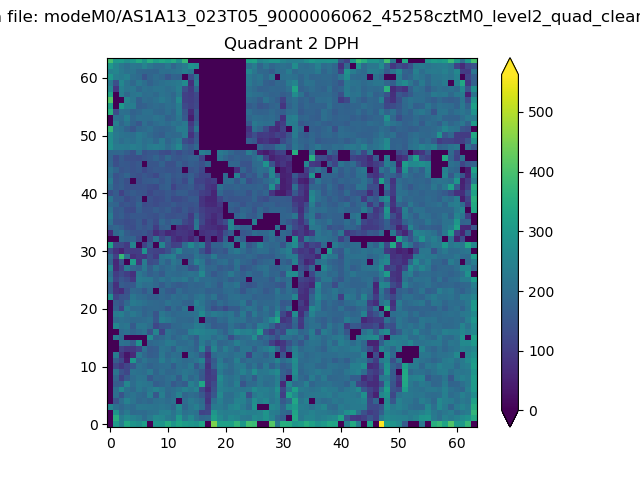 |
Quadrant C |
| Plot type | Count rate plots | Images |
|---|---|---|
| Comparison with Poisson distribution Blue bars denote a histogram of data divided into 1 sec bins. Red curve is a Poisson curve with rate = median count rate of data. |
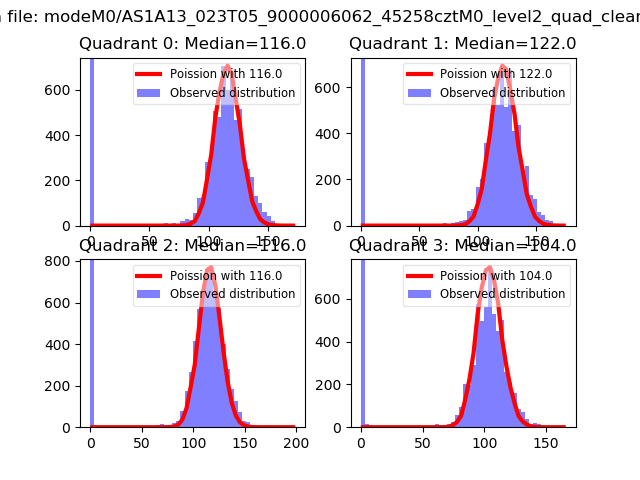 |
 |
| Quadrant-wise count rates Data is divided into 100 sec bins |
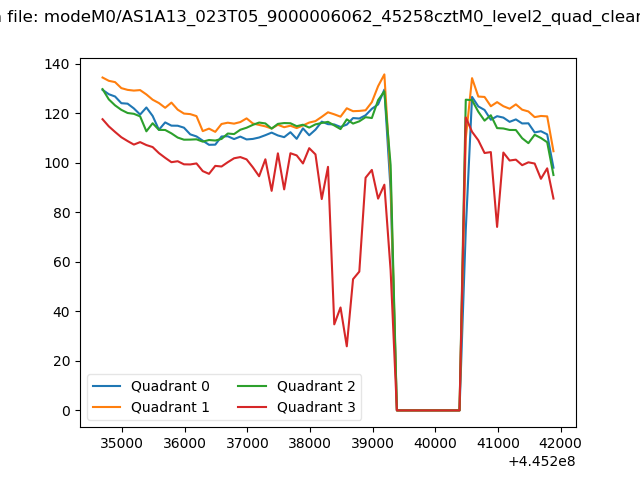 |
|
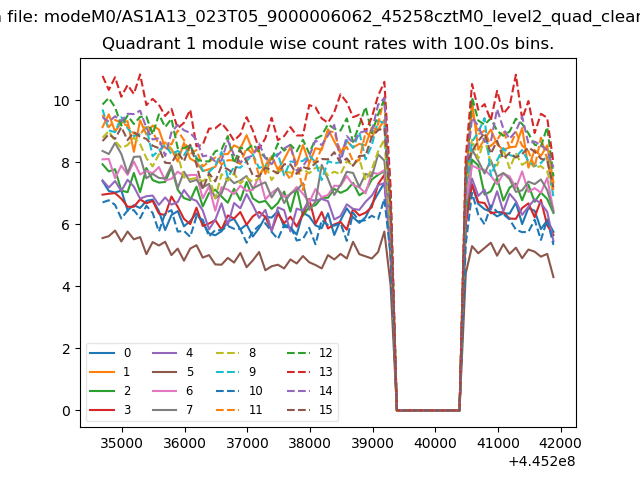
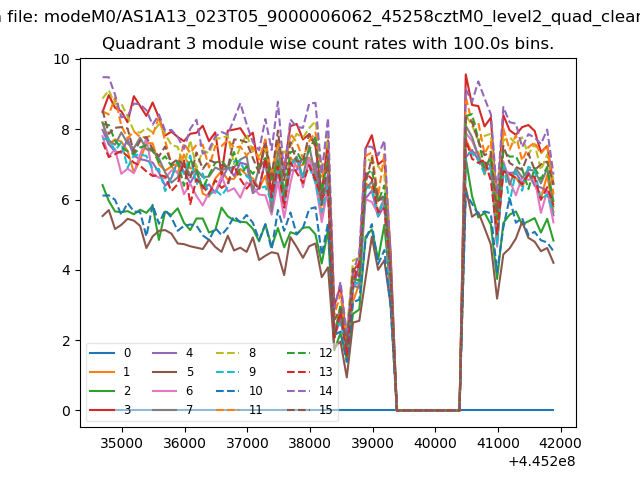
| Module-wise count rates for Quadrant A Data is divided into 100 sec bins |
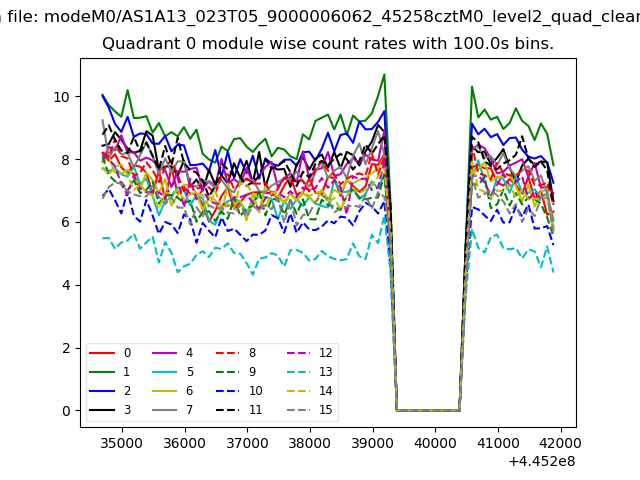 |
 |
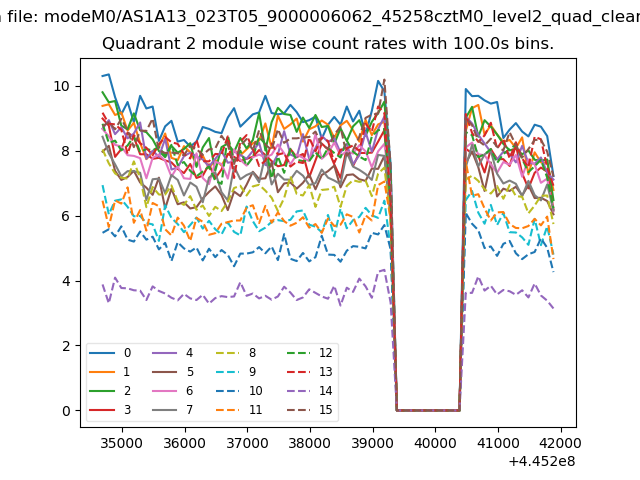
| Module-wise count rates for Quadrant B Data is divided into 100 sec bins |
 |
 |
| Module-wise count rates for Quadrant C Data is divided into 100 sec bins |
 |
 |
| Module-wise count rates for Quadrant D Data is divided into 100 sec bins |
 |
 |
| Parameter | Plot |
|---|---|
| CZT HV Monitor | 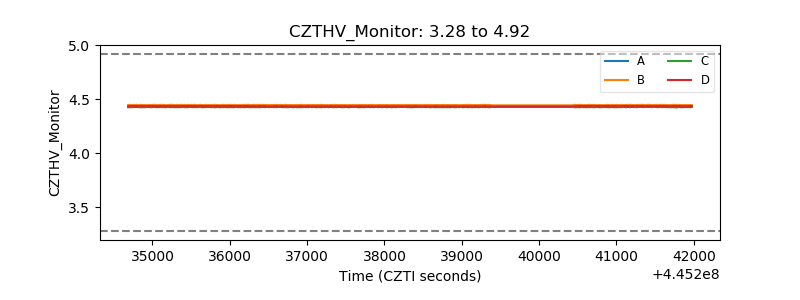 |
| D_VDD | 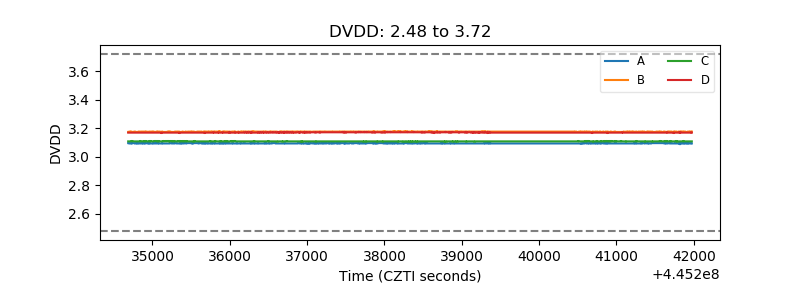 |
| Temperature 1 | 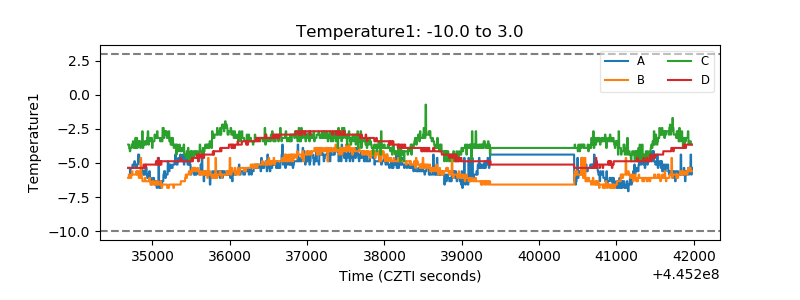 |
| Veto HV Monitor | 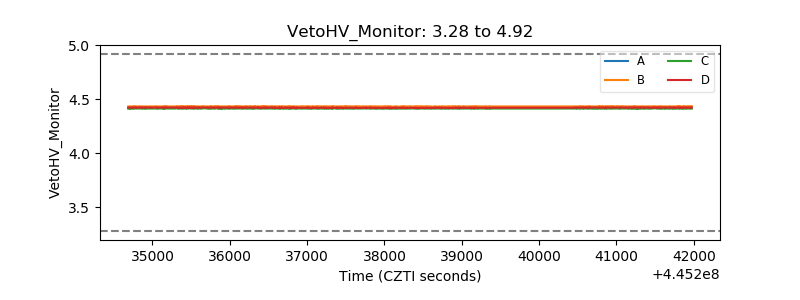 |
| Veto LLD | 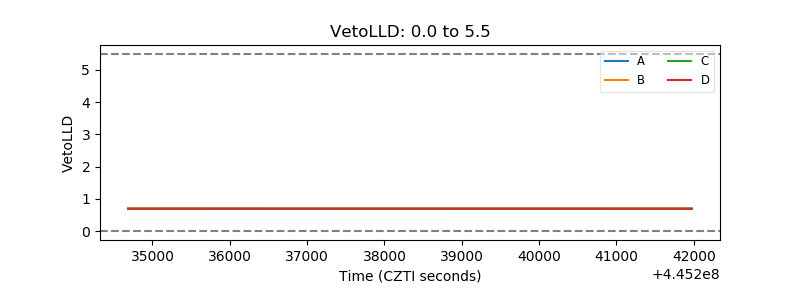 |
| Alpha Counter | 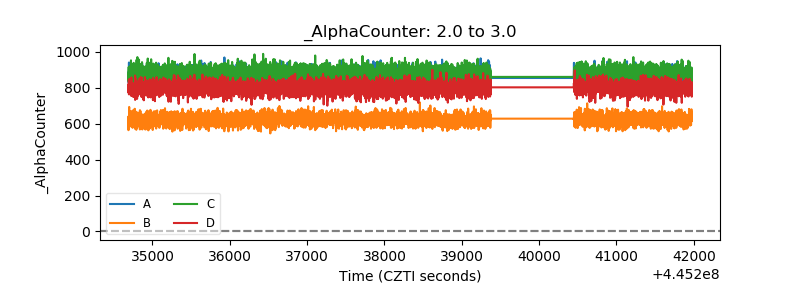 |
| _CPM_Rate | 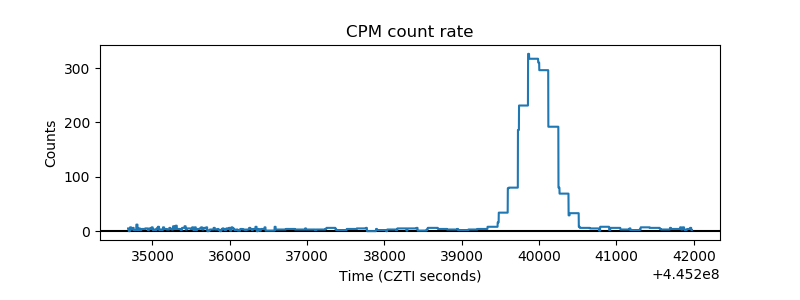 |
| CZT Counter | 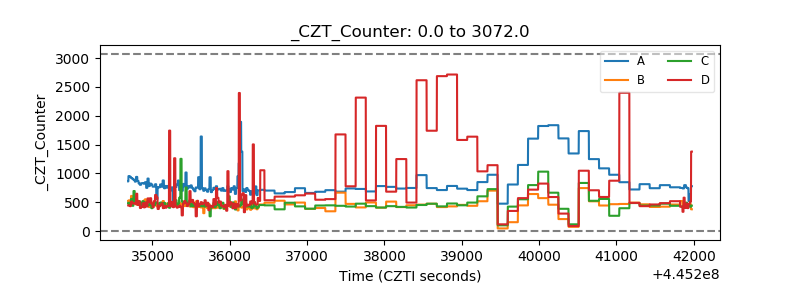 |
| +2.5 Volts monitor | 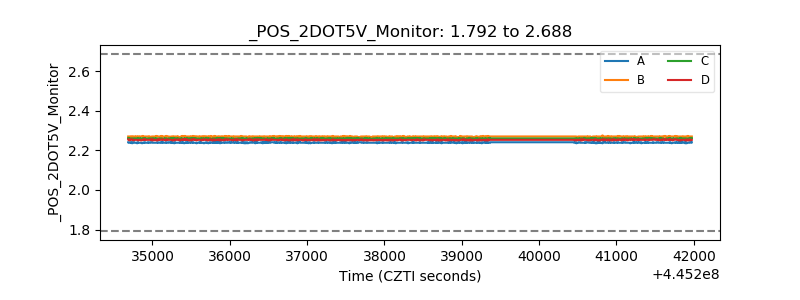 |
| +5 Volts monitor | 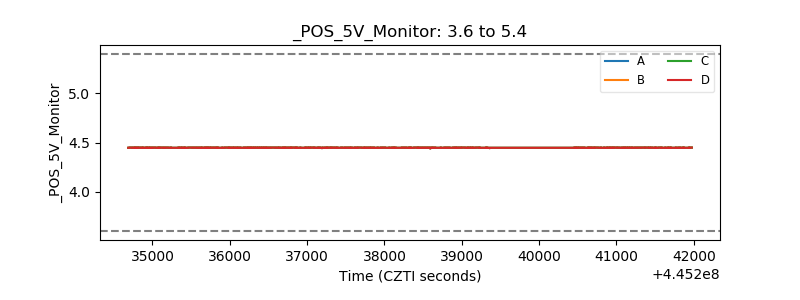 |
| _ROLL_ROT | 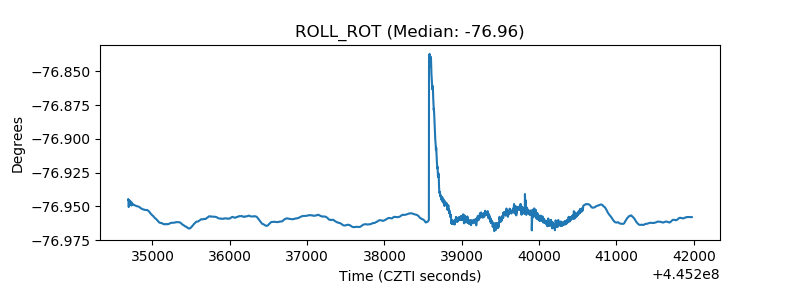 |
| _Roll_DEC | 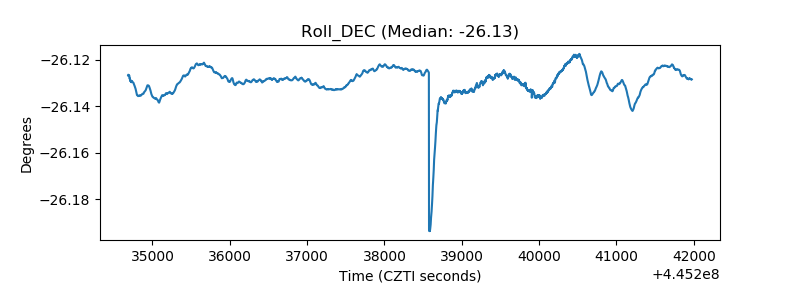 |
| _Roll_RA | 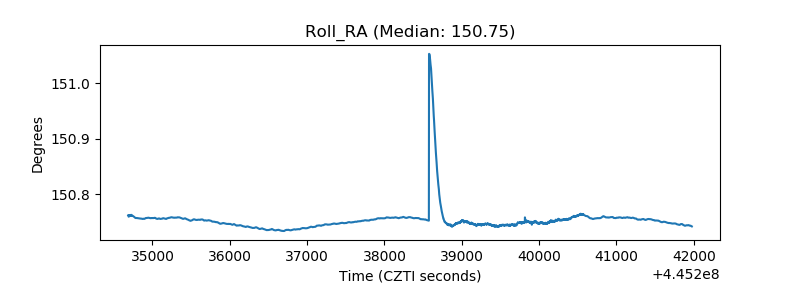 |
| Veto Counter | 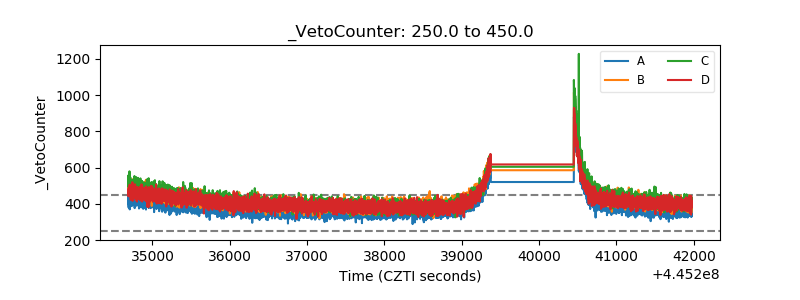 |