| Param | Original file | Final file |
|---|---|---|
| Filename | modeM0/AS1A13_023T05_9000006062_45259cztM0_level2.fits | modeM0/AS1A13_023T05_9000006062_45259cztM0_level2_quad_clean.evt |
| Size (bytes) | 331,490,880 | 77,273,280 |
| Size | 316.1 MB | 73.7 MB |
| Events in quadrant A | 3,866,317 | 508,189 |
| Events in quadrant B | 2,158,535 | 537,001 |
| Events in quadrant C | 2,147,998 | 517,731 |
| Events in quadrant D | 3,733,193 | 448,003 |
| Mode SS | |||
|---|---|---|---|
| Quadrant | BADHDUFLAG | Total packets | Discarded packets |
| A | 0 | 94 | 0 |
| B | 0 | 94 | 0 |
| C | 0 | 94 | 0 |
| D | 0 | 94 | 0 |
| Mode M9 | |||
|---|---|---|---|
| Quadrant | BADHDUFLAG | Total packets | Discarded packets |
| A | 0 | 4 | 0 |
| B | 0 | 4 | 0 |
| C | 0 | 5 | 0 |
| D | 0 | 5 | 0 |
| Mode M0 | |||
|---|---|---|---|
| Quadrant | BADHDUFLAG | Total packets | Discarded packets |
| A | 0 | 15274 | 1 |
| B | 0 | 9669 | 1 |
| C | 0 | 9681 | 1 |
| D | 0 | 14207 | 1 |
| Quadrant | Total seconds | Saturated seconds | Saturation percentage |
|---|---|---|---|
| A | 4681 | 167 | 3.567614% |
| B | 4681 | 75 | 1.602222% |
| C | 4681 | 63 | 1.345866% |
| D | 4681 | 332 | 7.092502% |
Noise dominated data is calculated using 1-second bins in cleaned event files. If a bin has >2000 counts, and if more than 50% of those come from <1% of pixels, then it is considered to be noise-dominated and hence unusable.
| Quadrant | # 1 sec bins | Bins with >0 counts | Bins with >2000 counts | High rate bins dominated by noise | Noise dominated (total time) | Noise dominated (detector-on time) | Marked lightcurve |
|---|---|---|---|---|---|---|---|
| A | 4681 | 4681 | 69 | 69 | 1.47% | 1.47% | 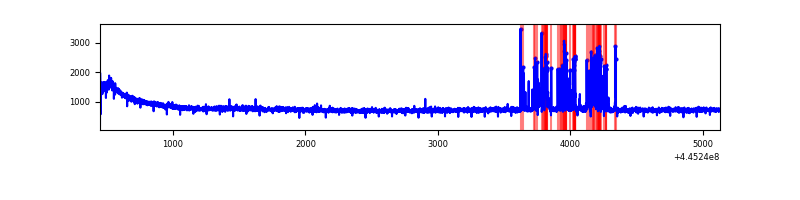 |
| B | 4681 | 4681 | 4 | 4 | 0.09% | 0.09% | 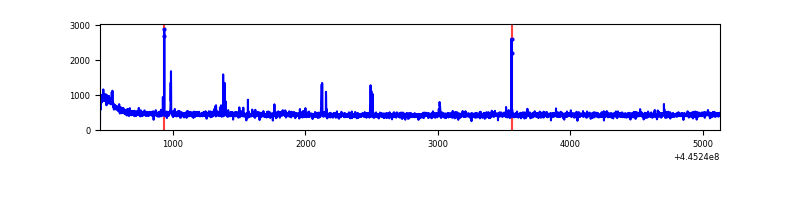 |
| C | 4681 | 4681 | 5 | 5 | 0.11% | 0.11% | 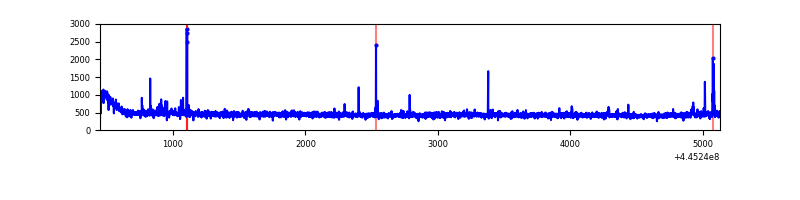 |
| D | 4681 | 4681 | 293 | 293 | 6.26% | 6.26% | 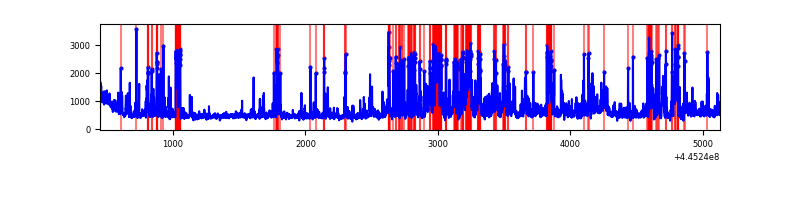 |
Top three noisy pixels from each quadrant. If the there are fewer than three noisy pixels in the level2.evt file, extra rows are filled as -1
| Pixel properties | Quadrant properties | ||||||
|---|---|---|---|---|---|---|---|
| Quadrant | DetID | PixID | Counts | Sigma | Mean | Median | Sigma |
| A | 10 | 83 | 1541705 | 13913.02 | 530 | 518 | 110.8 |
| A | 13 | 248 | 274713 | 2475.29 | 530 | 518 | 110.8 |
| A | 3 | 137 | 6143 | 50.78 | 530 | 518 | 110.8 |
| B | 5 | 172 | 19880 | 182.93 | 534 | 519 | 105.8 |
| B | 5 | 207 | 14605 | 133.09 | 534 | 519 | 105.8 |
| B | 12 | 111 | 13739 | 124.91 | 534 | 519 | 105.8 |
| C | 2 | 14 | 36700 | 284.86 | 534 | 537 | 127.0 |
| C | 14 | 254 | 9885 | 73.63 | 534 | 537 | 127.0 |
| C | 1 | 3 | 8750 | 64.69 | 534 | 537 | 127.0 |
| D | 13 | 249 | 859993 | 6638.79 | 515 | 501 | 129.5 |
| D | 11 | 241 | 427040 | 3294.62 | 515 | 501 | 129.5 |
| D | 5 | 222 | 199027 | 1533.43 | 515 | 501 | 129.5 |
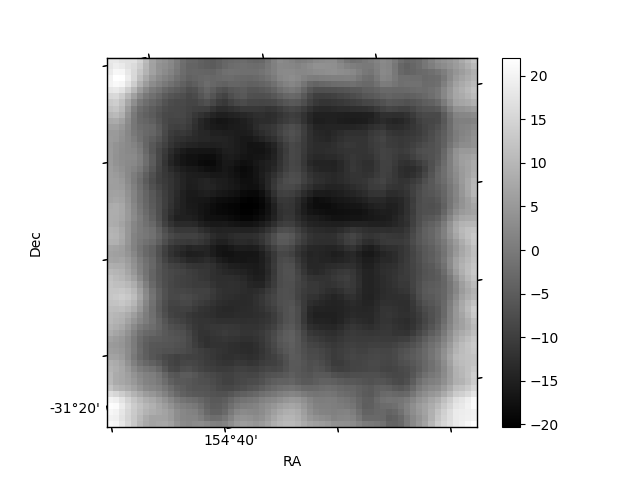
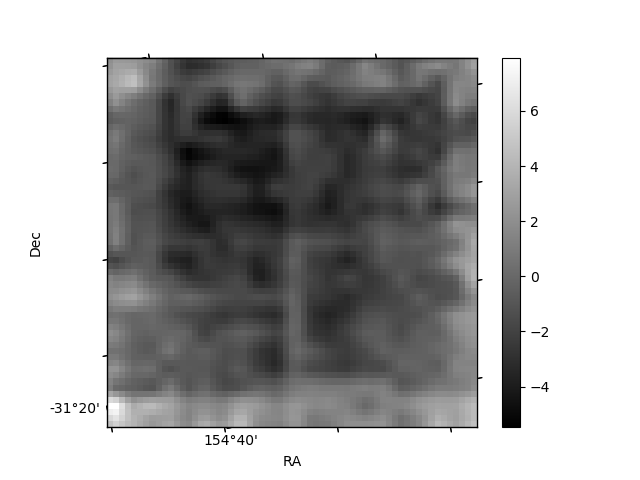
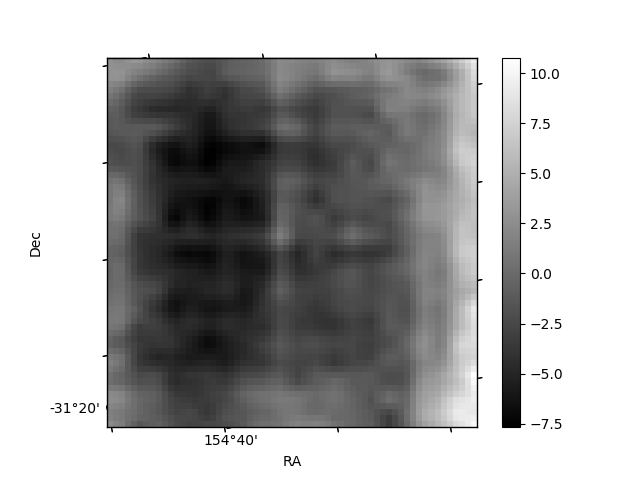
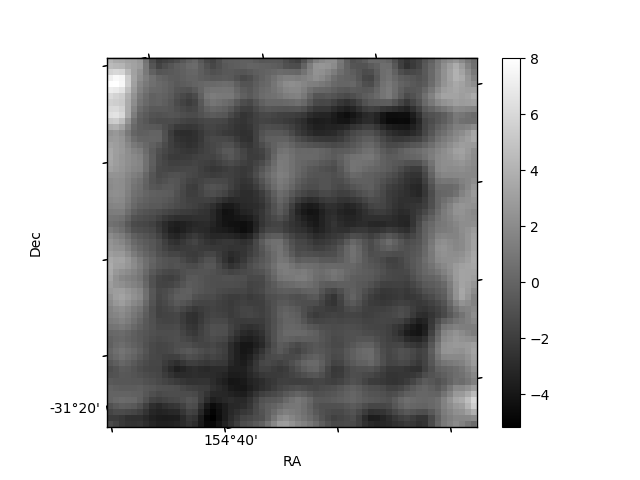
Histogram calculated using DETX and DETY for each event in the final _common_clean file
| Quadrant A | 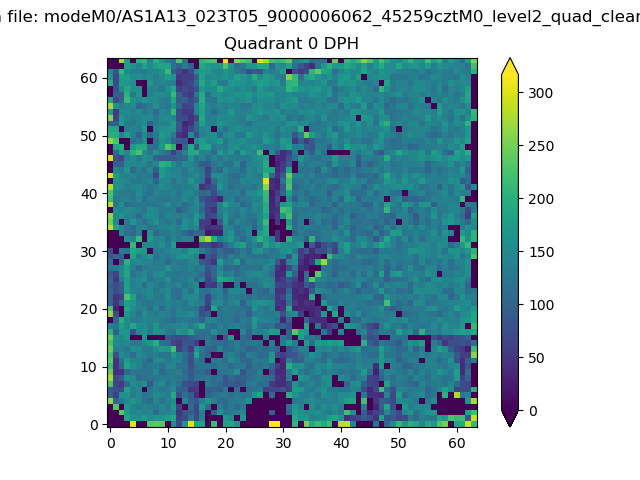 |
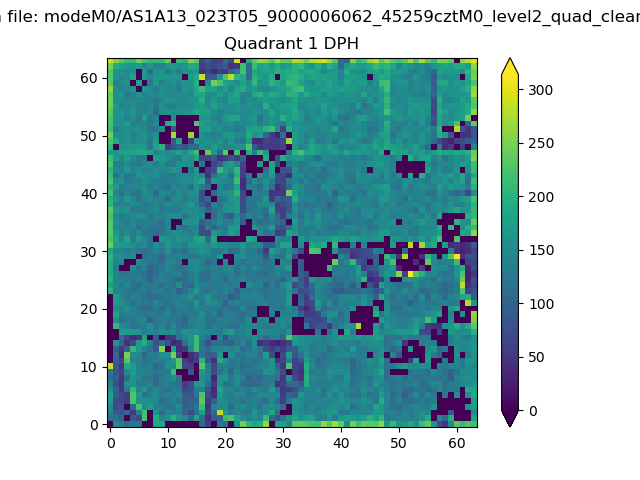 |
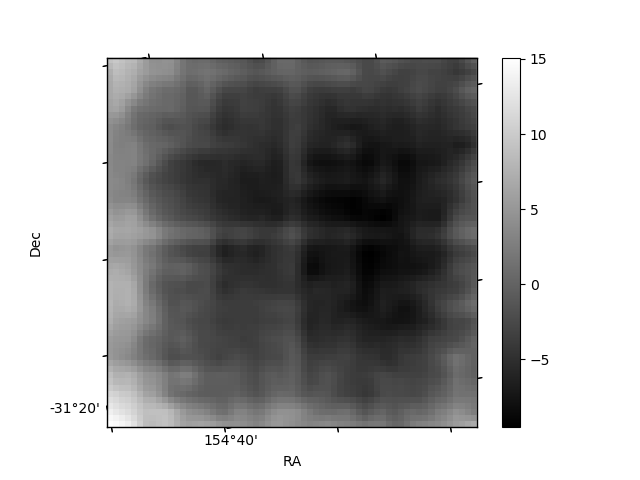
Quadrant B |
|---|---|---|---|
| Quadrant D | 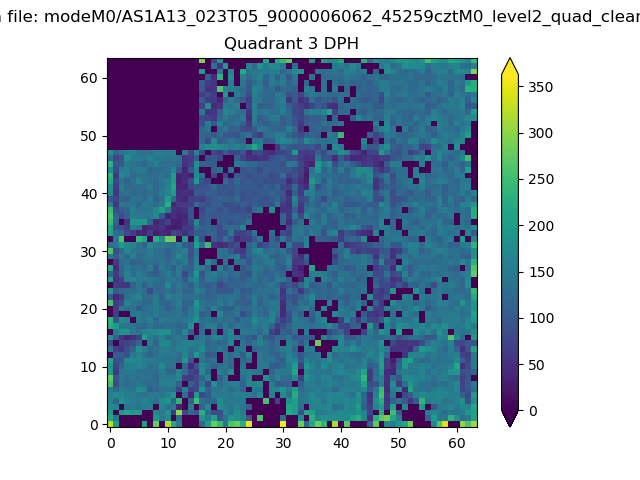 |
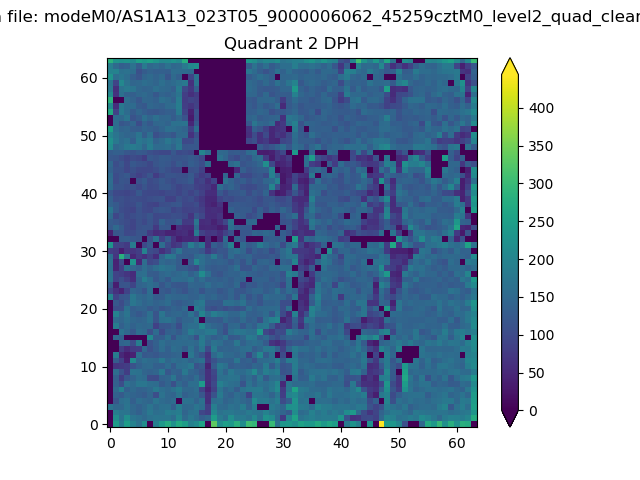 |
Quadrant C |
| Plot type | Count rate plots | Images |
|---|---|---|
| Comparison with Poisson distribution Blue bars denote a histogram of data divided into 1 sec bins. Red curve is a Poisson curve with rate = median count rate of data. |
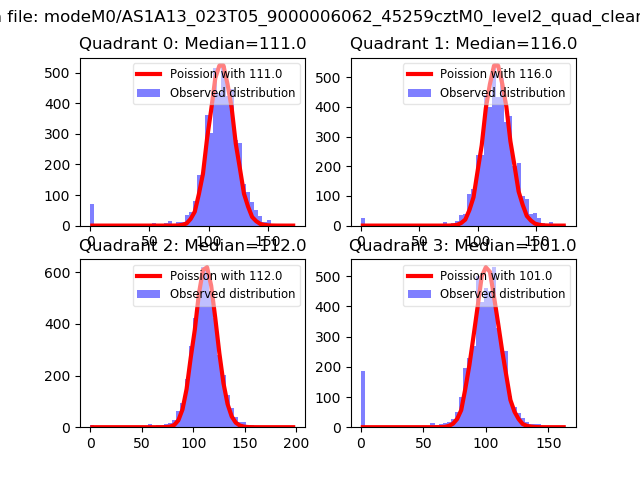 |
 |
| Quadrant-wise count rates Data is divided into 100 sec bins |
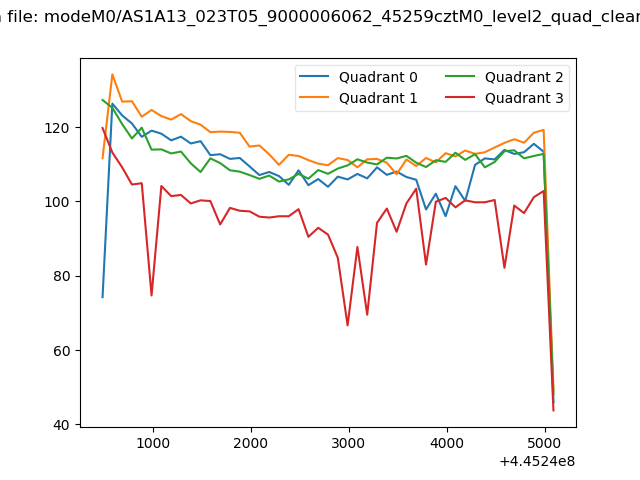 |
|
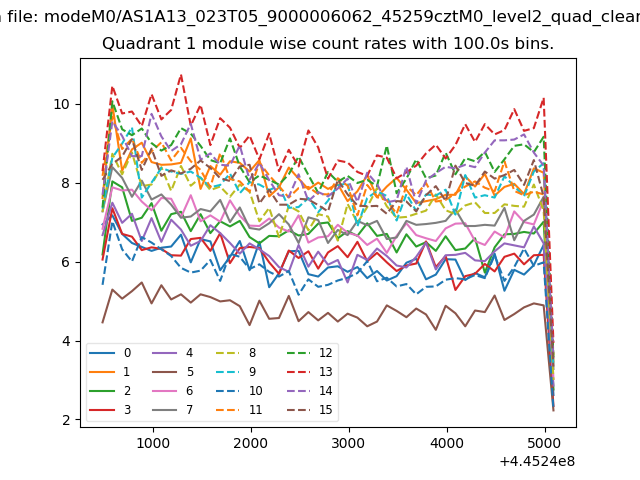
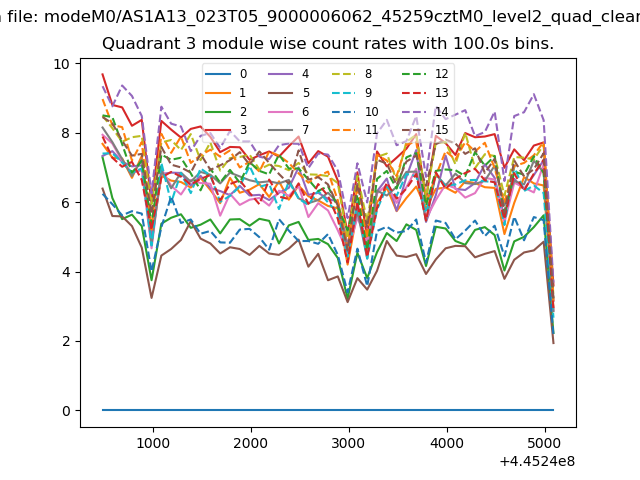
| Module-wise count rates for Quadrant A Data is divided into 100 sec bins |
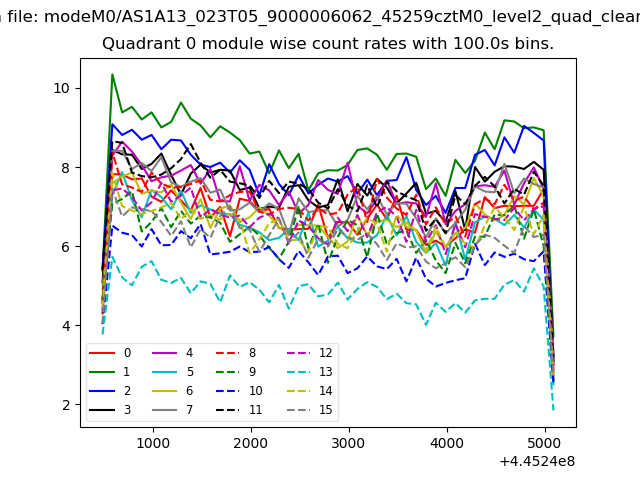 |
 |
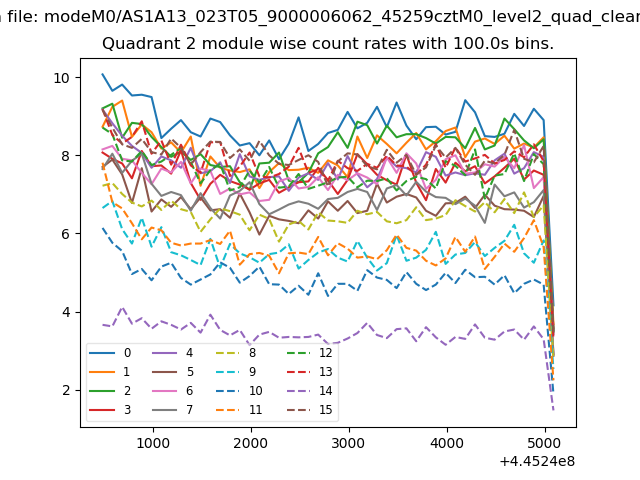
| Module-wise count rates for Quadrant B Data is divided into 100 sec bins |
 |
 |
| Module-wise count rates for Quadrant C Data is divided into 100 sec bins |
 |
 |
| Module-wise count rates for Quadrant D Data is divided into 100 sec bins |
 |
 |
| Parameter | Plot |
|---|---|
| CZT HV Monitor | 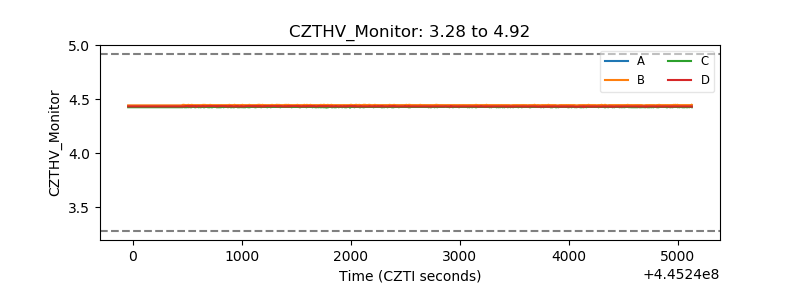 |
| D_VDD | 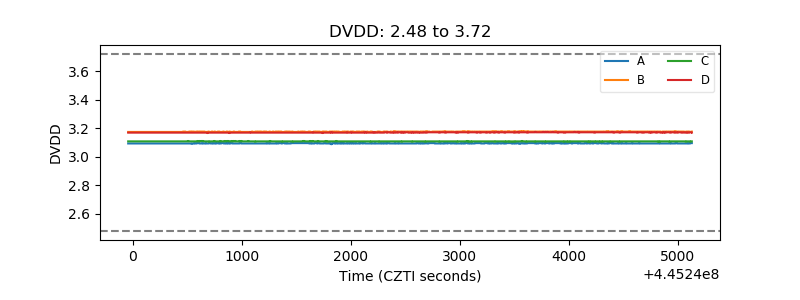 |
| Temperature 1 | 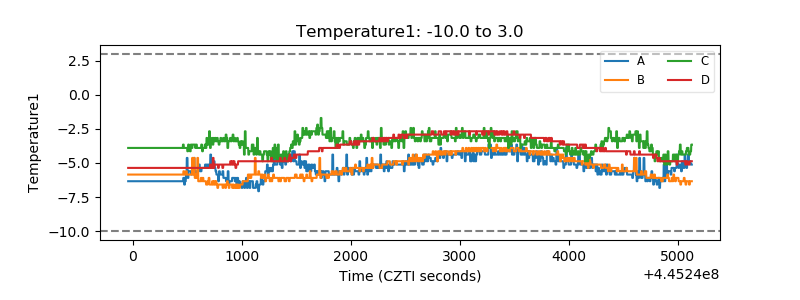 |
| Veto HV Monitor | 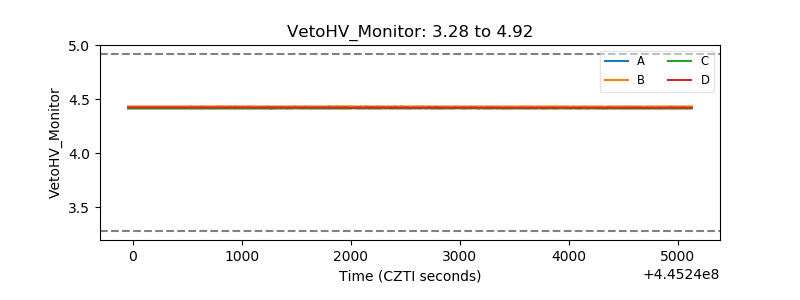 |
| Veto LLD | 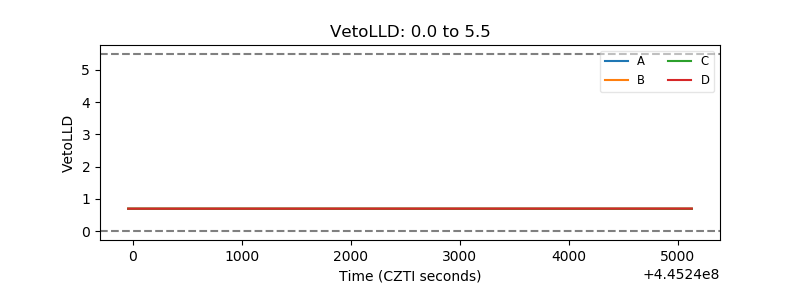 |
| Alpha Counter | 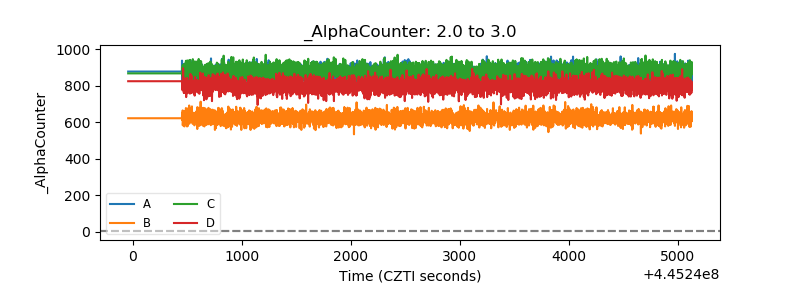 |
| _CPM_Rate | 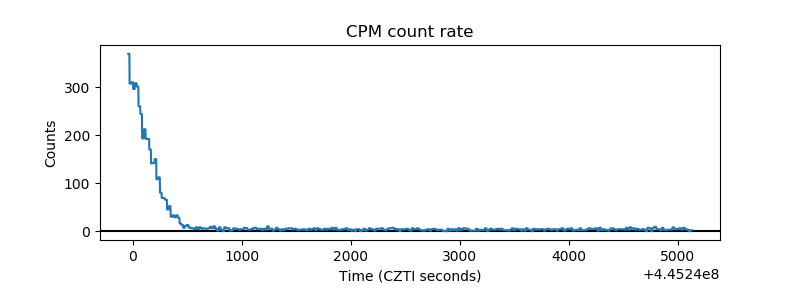 |
| CZT Counter | 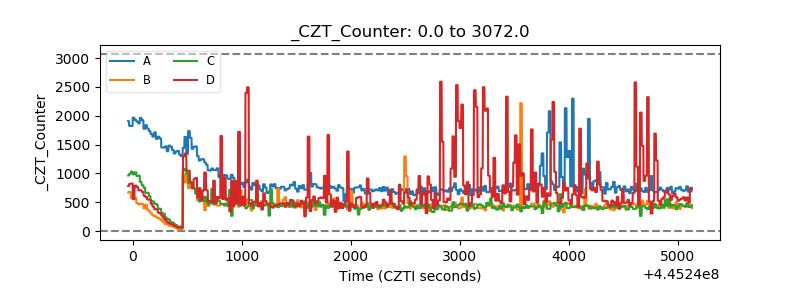 |
| +2.5 Volts monitor | 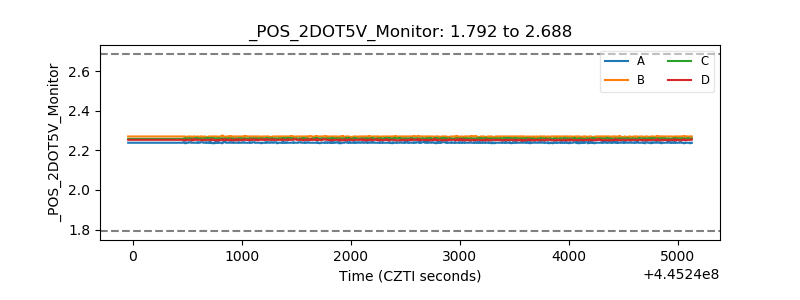 |
| +5 Volts monitor | 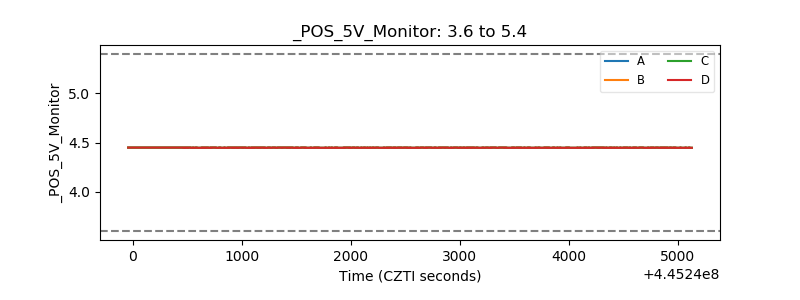 |
| _ROLL_ROT | 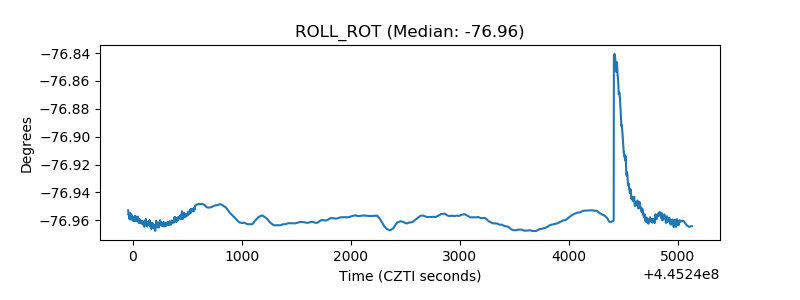 |
| _Roll_DEC | 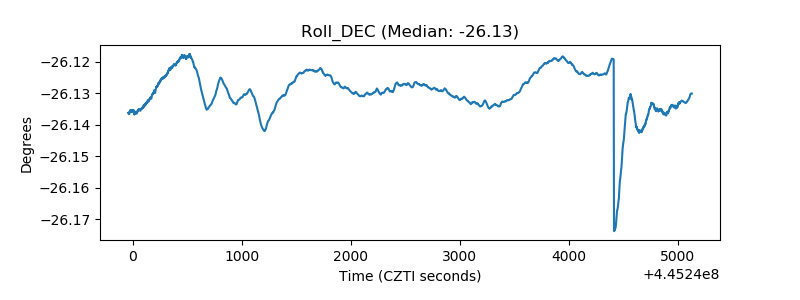 |
| _Roll_RA | 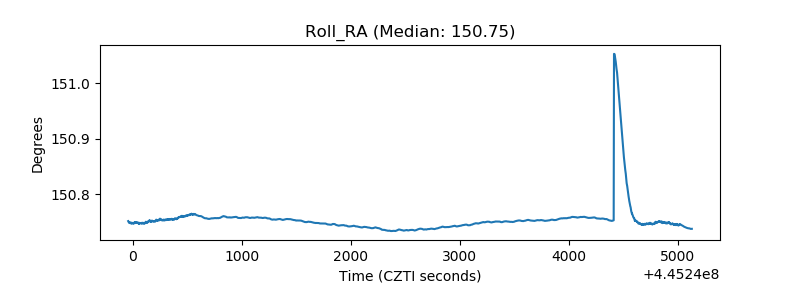 |
| Veto Counter | 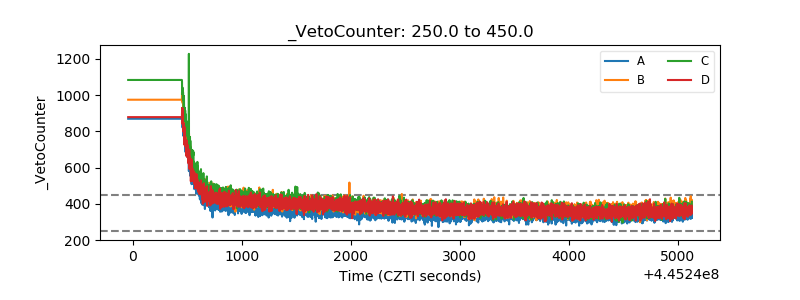 |