| Param | Original file | Final file |
|---|---|---|
| Filename | modeM0/AS1A13_023T05_9000006062_45431cztM0_level2.fits | modeM0/AS1A13_023T05_9000006062_45431cztM0_level2_quad_clean.evt |
| Size (bytes) | 121,429,440 | 23,846,400 |
| Size | 115.8 MB | 22.7 MB |
| Events in quadrant A | 1,546,105 | 149,694 |
| Events in quadrant B | 776,378 | 168,124 |
| Events in quadrant C | 687,673 | 165,682 |
| Events in quadrant D | 1,374,599 | 135,847 |
| Mode SS | |||
|---|---|---|---|
| Quadrant | BADHDUFLAG | Total packets | Discarded packets |
| A | 0 | 26 | 0 |
| B | 0 | 26 | 0 |
| C | 0 | 26 | 0 |
| D | 0 | 26 | 0 |
| Mode M9 | |||
|---|---|---|---|
| Quadrant | BADHDUFLAG | Total packets | Discarded packets |
| A | 0 | 6 | 0 |
| B | 0 | 6 | 0 |
| C | 0 | 6 | 0 |
| D | 0 | 6 | 0 |
| Mode M0 | |||
|---|---|---|---|
| Quadrant | BADHDUFLAG | Total packets | Discarded packets |
| A | 0 | 5543 | 1 |
| B | 0 | 3201 | 1 |
| C | 0 | 2986 | 1 |
| D | 0 | 5036 | 1 |
| Quadrant | Total seconds | Saturated seconds | Saturation percentage |
|---|---|---|---|
| A | 1383 | 180 | 13.015184% |
| B | 1383 | 44 | 3.181490% |
| C | 1383 | 14 | 1.012292% |
| D | 1383 | 177 | 12.798265% |
Noise dominated data is calculated using 1-second bins in cleaned event files. If a bin has >2000 counts, and if more than 50% of those come from <1% of pixels, then it is considered to be noise-dominated and hence unusable.
| Quadrant | # 1 sec bins | Bins with >0 counts | Bins with >2000 counts | High rate bins dominated by noise | Noise dominated (total time) | Noise dominated (detector-on time) | Marked lightcurve |
|---|---|---|---|---|---|---|---|
| A | 1383 | 1383 | 124 | 124 | 8.97% | 8.97% | 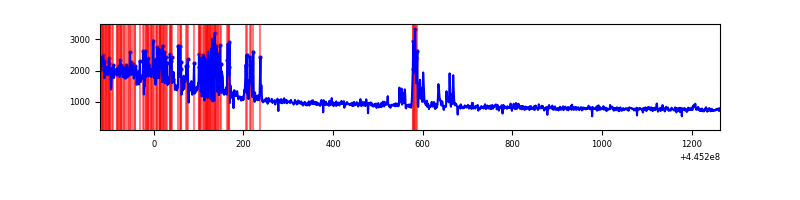 |
| B | 1383 | 1383 | 19 | 19 | 1.37% | 1.37% | 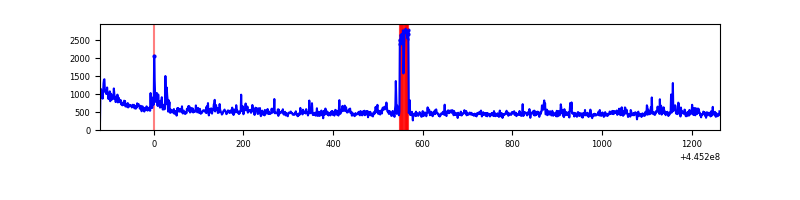 |
| C | 1383 | 1383 | 5 | 5 | 0.36% | 0.36% | 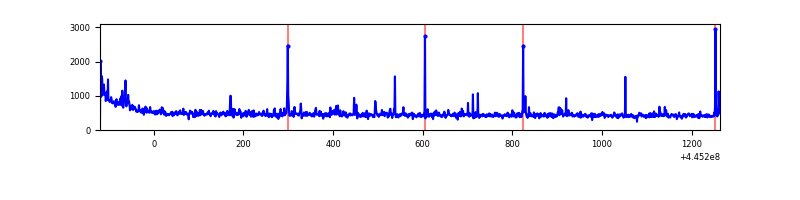 |
| D | 1383 | 1383 | 155 | 155 | 11.21% | 11.21% | 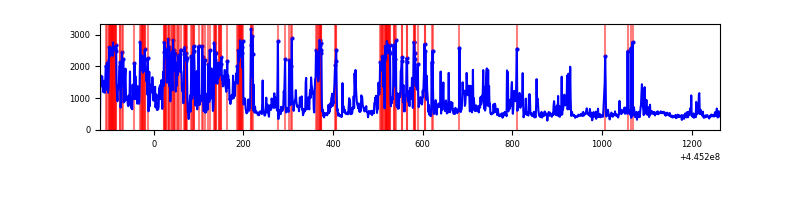 |
Top three noisy pixels from each quadrant. If the there are fewer than three noisy pixels in the level2.evt file, extra rows are filled as -1
| Pixel properties | Quadrant properties | ||||||
|---|---|---|---|---|---|---|---|
| Quadrant | DetID | PixID | Counts | Sigma | Mean | Median | Sigma |
| A | 10 | 83 | 713863 | 20947.74 | 155 | 152 | 34.1 |
| A | 13 | 248 | 189730 | 5564.2 | 155 | 152 | 34.1 |
| A | 9 | 191 | 27612 | 805.96 | 155 | 152 | 34.1 |
| B | 15 | 201 | 49603 | 1436.76 | 164 | 160 | 34.4 |
| B | 0 | 186 | 19589 | 564.59 | 164 | 160 | 34.4 |
| B | 0 | 171 | 14459 | 415.51 | 164 | 160 | 34.4 |
| C | 14 | 254 | 28964 | 723.99 | 161 | 163 | 39.8 |
| C | 12 | 2 | 14284 | 354.97 | 161 | 163 | 39.8 |
| C | 0 | 239 | 7105 | 174.51 | 161 | 163 | 39.8 |
| D | 2 | 249 | 343019 | 8521.25 | 150 | 145 | 40.2 |
| D | 1 | 52 | 216138 | 5367.95 | 150 | 145 | 40.2 |
| D | 13 | 171 | 66460 | 1648.09 | 150 | 145 | 40.2 |
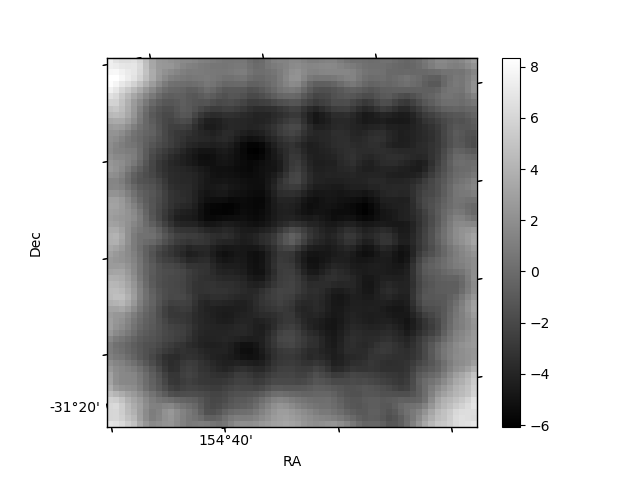
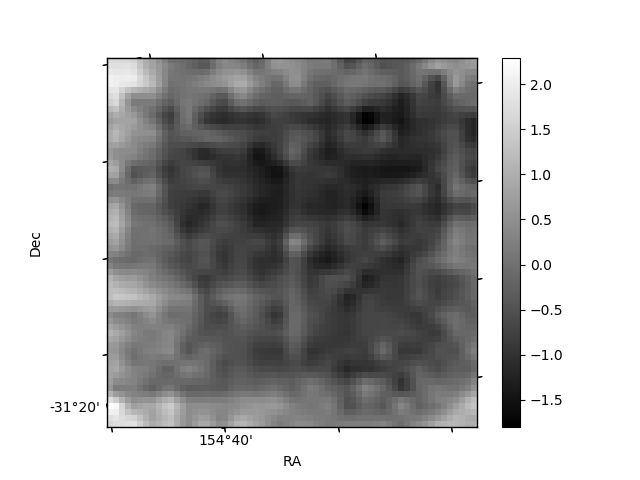
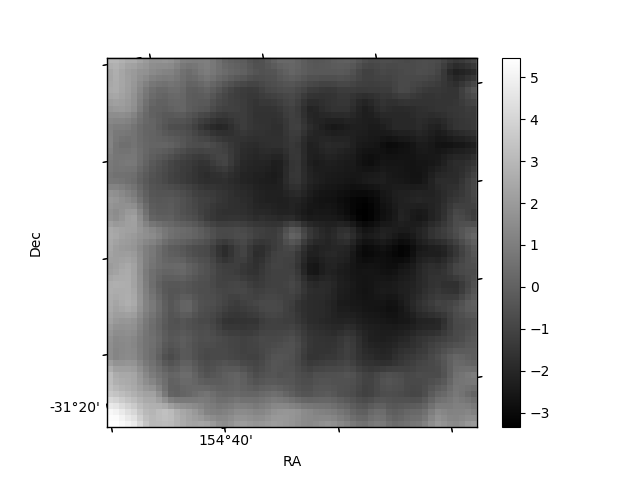
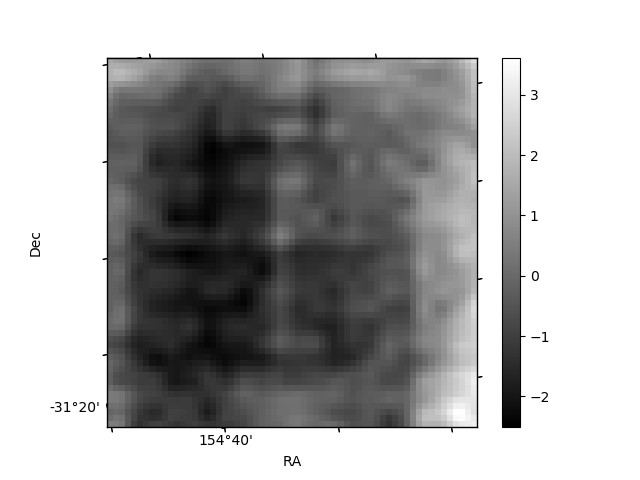
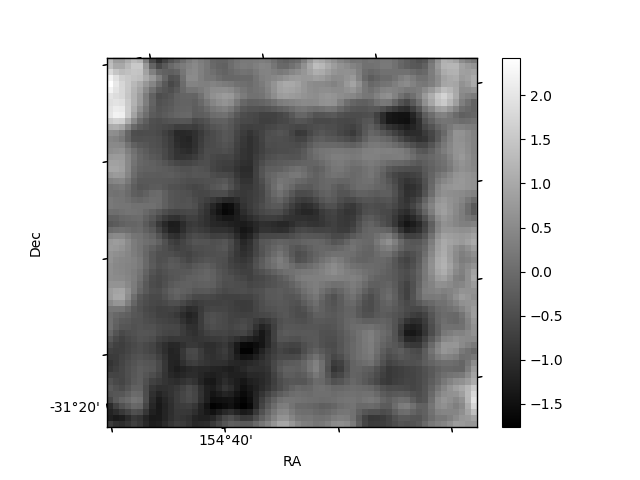
Histogram calculated using DETX and DETY for each event in the final _common_clean file
| Quadrant A | 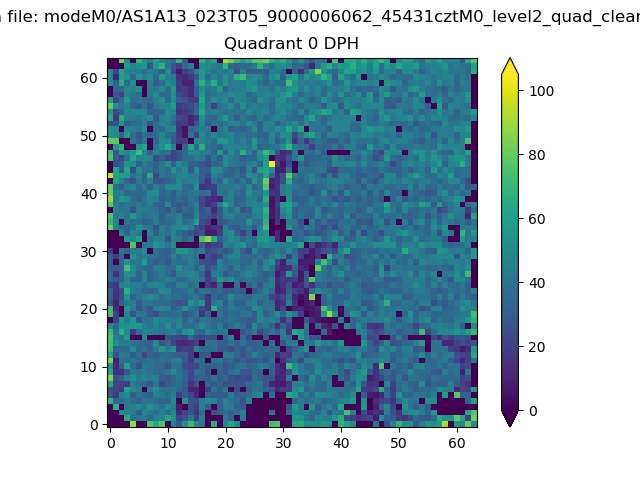 |
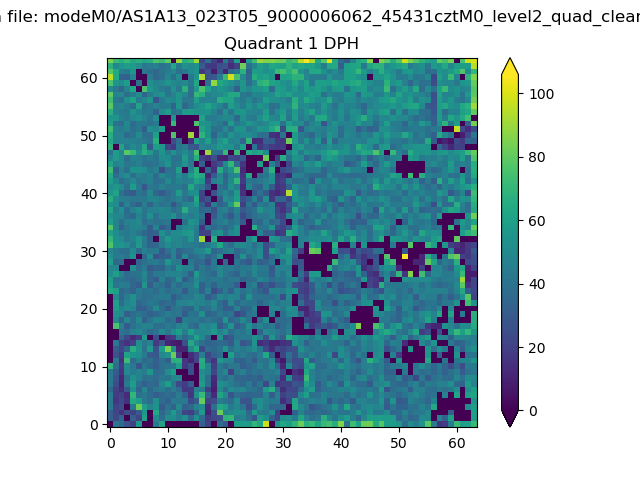 |
Quadrant B |
|---|---|---|---|
| Quadrant D | 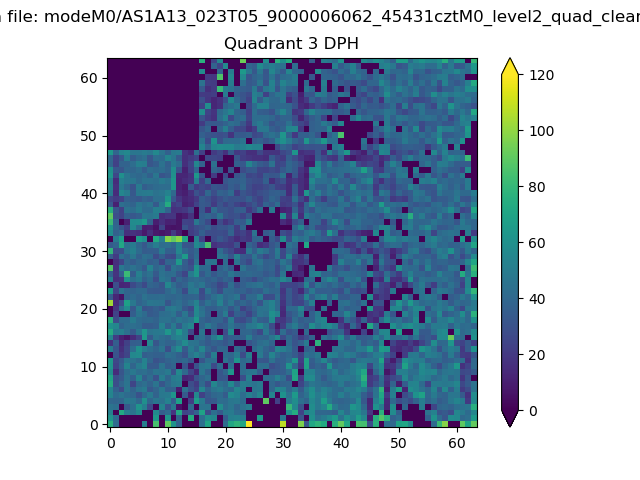 |
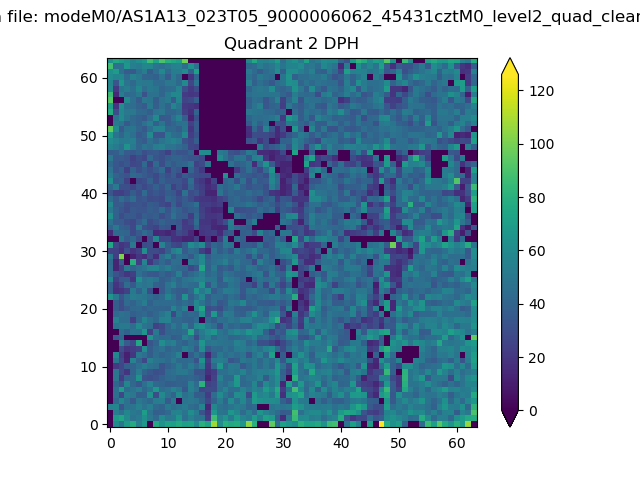 |
Quadrant C |
| Plot type | Count rate plots | Images |
|---|---|---|
| Comparison with Poisson distribution Blue bars denote a histogram of data divided into 1 sec bins. Red curve is a Poisson curve with rate = median count rate of data. |
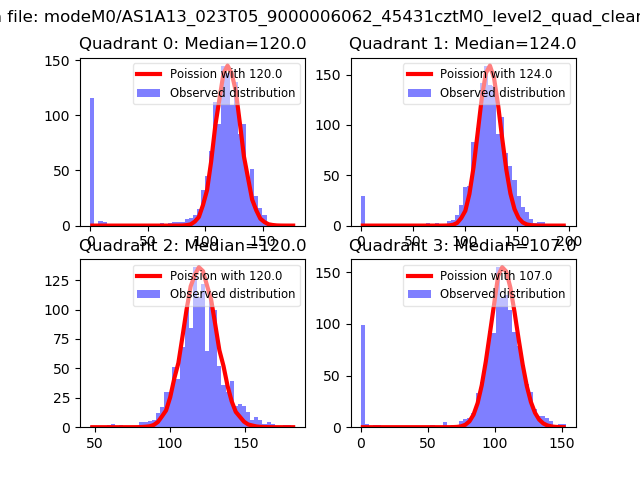 |
 |
| Quadrant-wise count rates Data is divided into 100 sec bins |
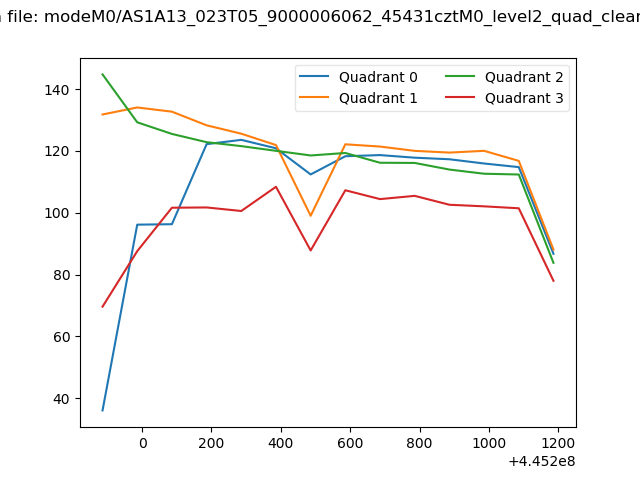 |
|
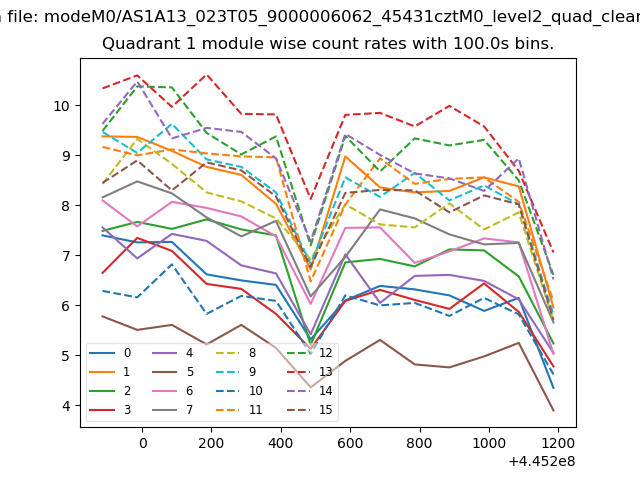
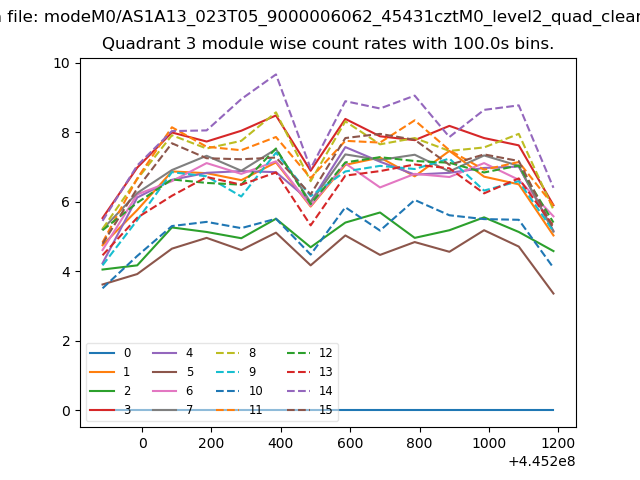
| Module-wise count rates for Quadrant A Data is divided into 100 sec bins |
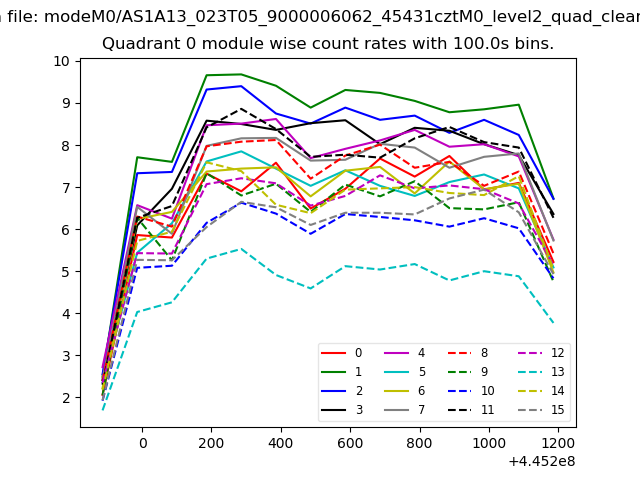 |
 |
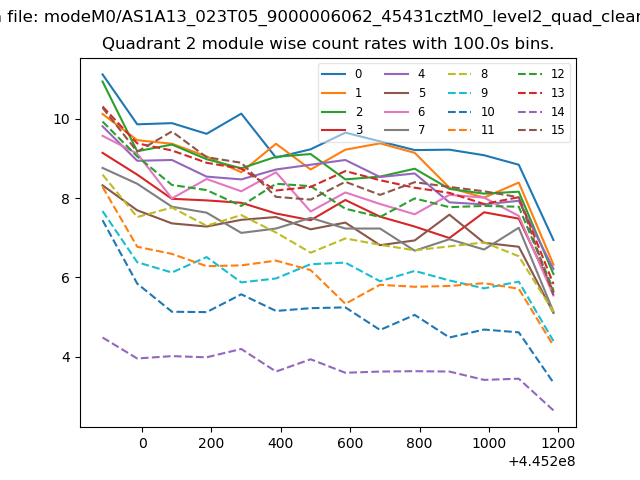
| Module-wise count rates for Quadrant B Data is divided into 100 sec bins |
 |
 |
| Module-wise count rates for Quadrant C Data is divided into 100 sec bins |
 |
 |
| Module-wise count rates for Quadrant D Data is divided into 100 sec bins |
 |
 |
| Parameter | Plot |
|---|---|
| CZT HV Monitor | 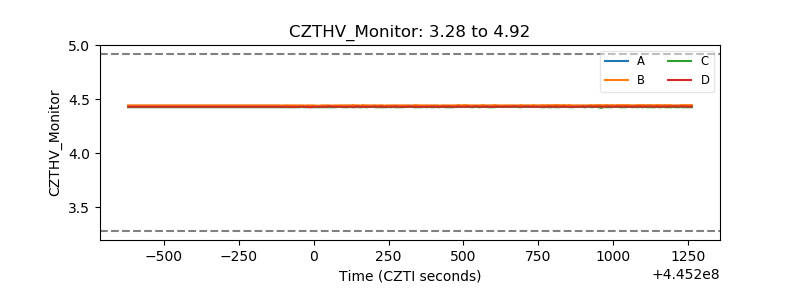 |
| D_VDD | 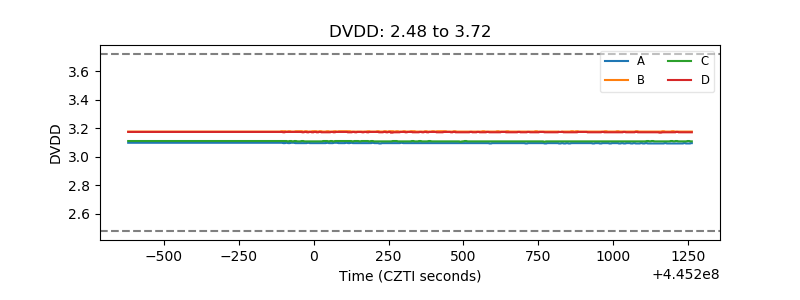 |
| Temperature 1 | 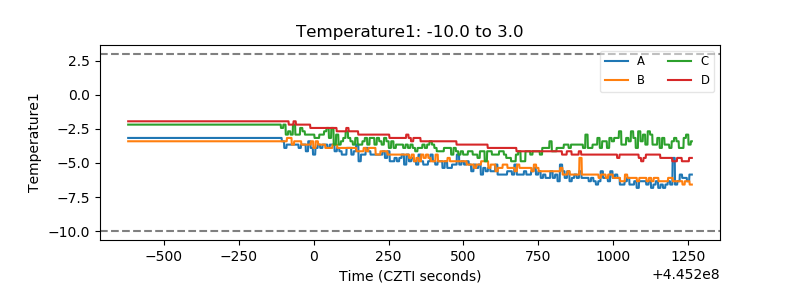 |
| Veto HV Monitor | 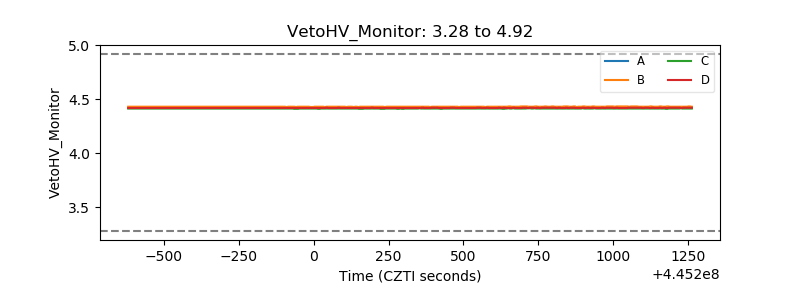 |
| Veto LLD | 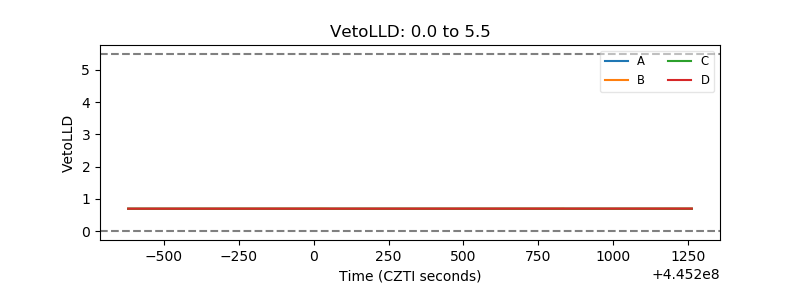 |
| Alpha Counter | 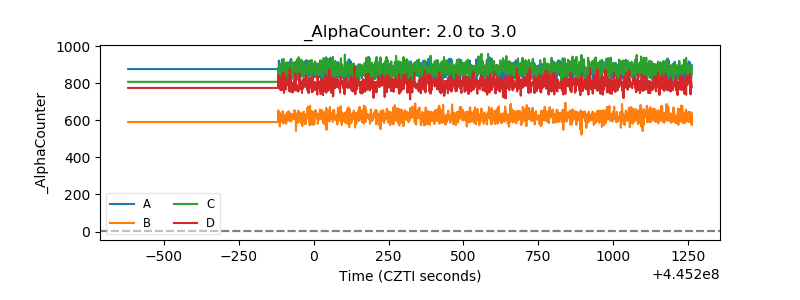 |
| _CPM_Rate | 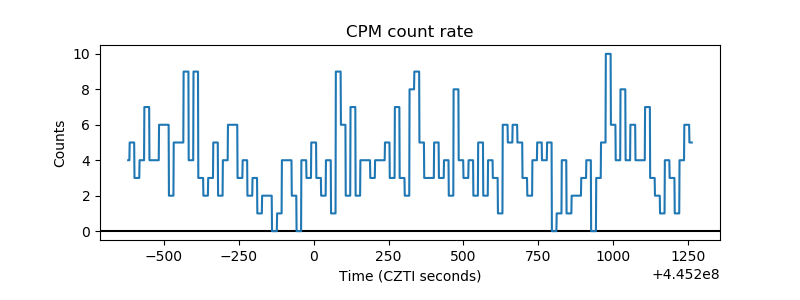 |
| CZT Counter | 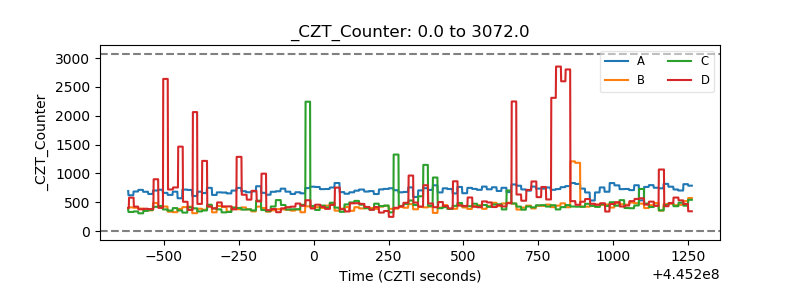 |
| +2.5 Volts monitor | 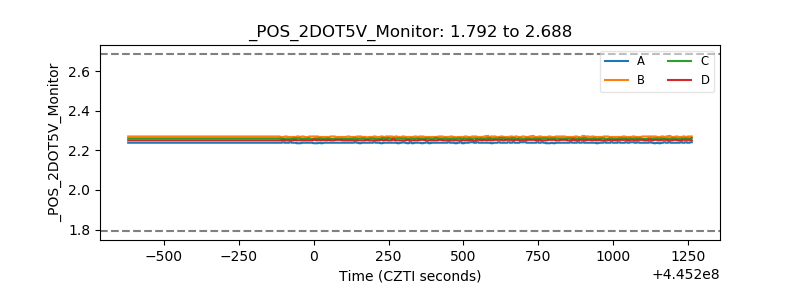 |
| +5 Volts monitor | 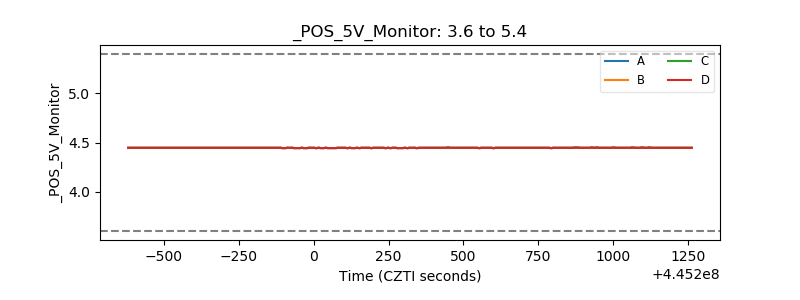 |
| _ROLL_ROT | 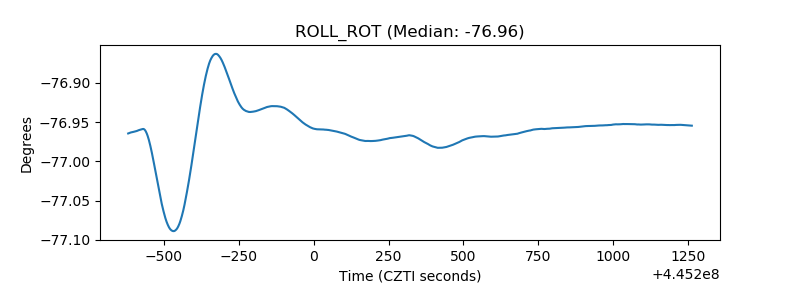 |
| _Roll_DEC | 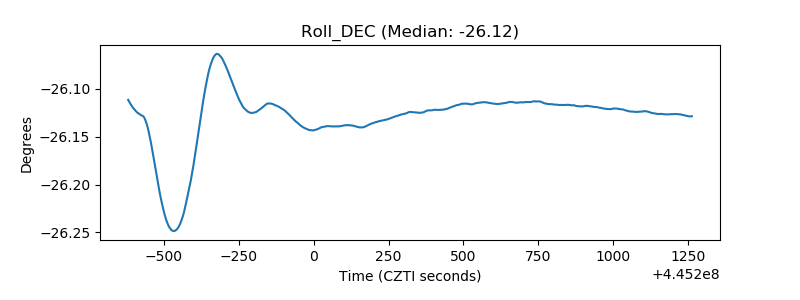 |
| _Roll_RA | 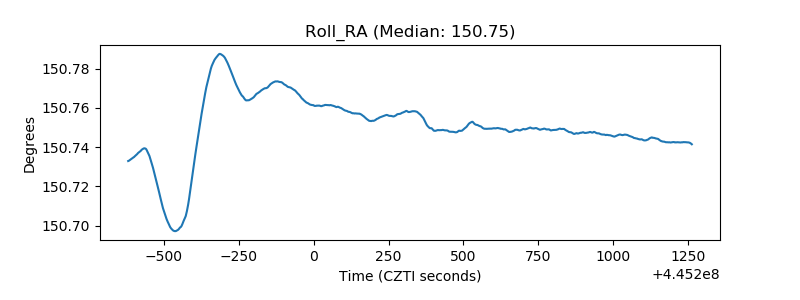 |
| Veto Counter | 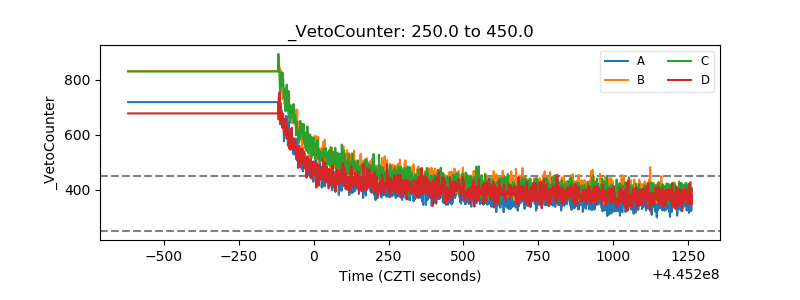 |