| Param | Original file | Final file |
|---|---|---|
| Filename | modeM0/AS1A13_023T05_9000006062_45432cztM0_level2.fits | modeM0/AS1A13_023T05_9000006062_45432cztM0_level2_quad_clean.evt |
| Size (bytes) | 496,653,120 | 113,817,600 |
| Size | 473.6 MB | 108.5 MB |
| Events in quadrant A | 6,108,340 | 744,643 |
| Events in quadrant B | 3,610,777 | 791,152 |
| Events in quadrant C | 3,402,962 | 762,890 |
| Events in quadrant D | 4,735,176 | 674,409 |
| Mode SS | |||
|---|---|---|---|
| Quadrant | BADHDUFLAG | Total packets | Discarded packets |
| A | 0 | 136 | 0 |
| B | 0 | 136 | 0 |
| C | 0 | 136 | 0 |
| D | 0 | 136 | 0 |
| Mode M9 | |||
|---|---|---|---|
| Quadrant | BADHDUFLAG | Total packets | Discarded packets |
| A | 0 | 18 | 0 |
| B | 0 | 18 | 0 |
| C | 0 | 18 | 0 |
| D | 0 | 18 | 0 |
| Mode M0 | |||
|---|---|---|---|
| Quadrant | BADHDUFLAG | Total packets | Discarded packets |
| A | 0 | 23030 | 2 |
| B | 0 | 15343 | 2 |
| C | 0 | 14799 | 3 |
| D | 0 | 18750 | 2 |
| Quadrant | Total seconds | Saturated seconds | Saturation percentage |
|---|---|---|---|
| A | 6796 | 319 | 4.693938% |
| B | 6796 | 140 | 2.060035% |
| C | 6795 | 94 | 1.383370% |
| D | 6795 | 268 | 3.944077% |
Noise dominated data is calculated using 1-second bins in cleaned event files. If a bin has >2000 counts, and if more than 50% of those come from <1% of pixels, then it is considered to be noise-dominated and hence unusable.
| Quadrant | # 1 sec bins | Bins with >0 counts | Bins with >2000 counts | High rate bins dominated by noise | Noise dominated (total time) | Noise dominated (detector-on time) | Marked lightcurve |
|---|---|---|---|---|---|---|---|
| A | 7951 | 6797 | 146 | 146 | 1.84% | 2.15% | 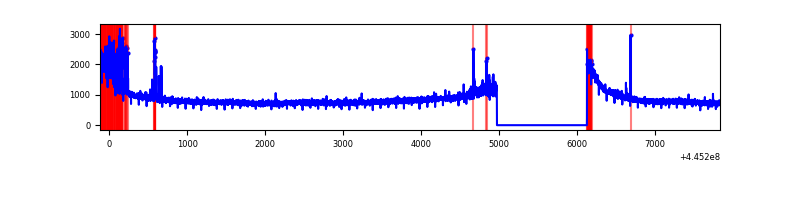 |
| B | 7951 | 6797 | 58 | 58 | 0.73% | 0.85% | 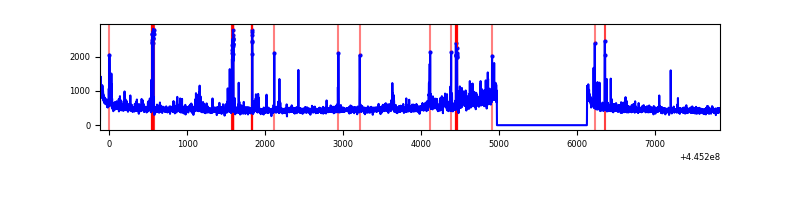 |
| C | 7950 | 6796 | 69 | 69 | 0.87% | 1.02% | 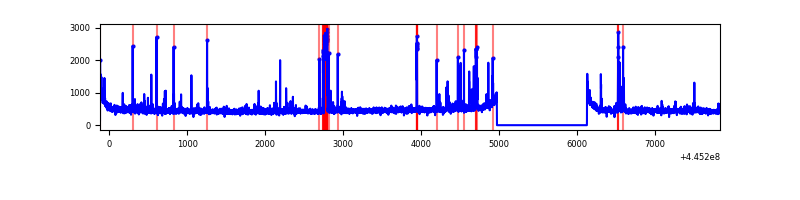 |
| D | 7950 | 6796 | 219 | 219 | 2.75% | 3.22% | 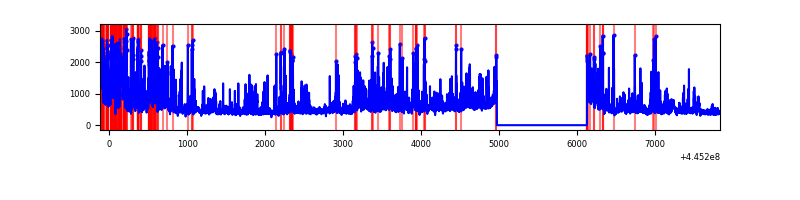 |
Top three noisy pixels from each quadrant. If the there are fewer than three noisy pixels in the level2.evt file, extra rows are filled as -1
| Pixel properties | Quadrant properties | ||||||
|---|---|---|---|---|---|---|---|
| Quadrant | DetID | PixID | Counts | Sigma | Mean | Median | Sigma |
| A | 10 | 83 | 2807834 | 17491.26 | 773 | 758 | 160.5 |
| A | 13 | 248 | 228518 | 1419.2 | 773 | 758 | 160.5 |
| A | 9 | 191 | 47940 | 294.0 | 773 | 758 | 160.5 |
| B | 15 | 201 | 81395 | 521.18 | 788 | 766 | 154.7 |
| B | 0 | 155 | 74476 | 476.46 | 788 | 766 | 154.7 |
| B | 0 | 186 | 55346 | 352.8 | 788 | 766 | 154.7 |
| C | 14 | 254 | 239389 | 1294.99 | 772 | 777 | 184.3 |
| C | 0 | 239 | 42322 | 225.47 | 772 | 777 | 184.3 |
| C | 12 | 2 | 30988 | 163.96 | 772 | 777 | 184.3 |
| D | 1 | 52 | 712645 | 3712.81 | 754 | 732 | 191.7 |
| D | 2 | 249 | 400727 | 2086.08 | 754 | 732 | 191.7 |
| D | 5 | 222 | 166378 | 863.89 | 754 | 732 | 191.7 |
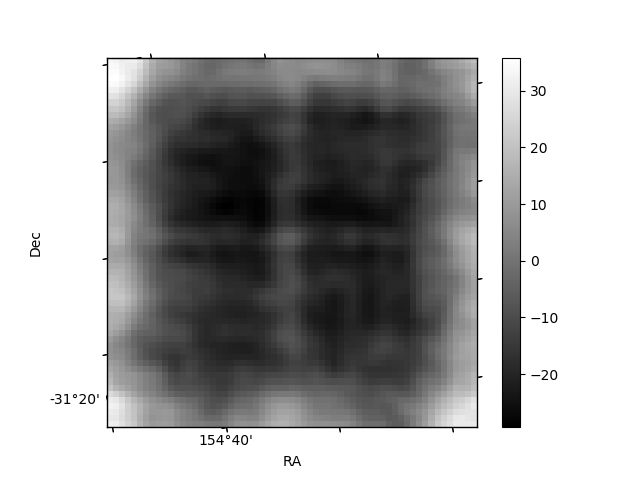
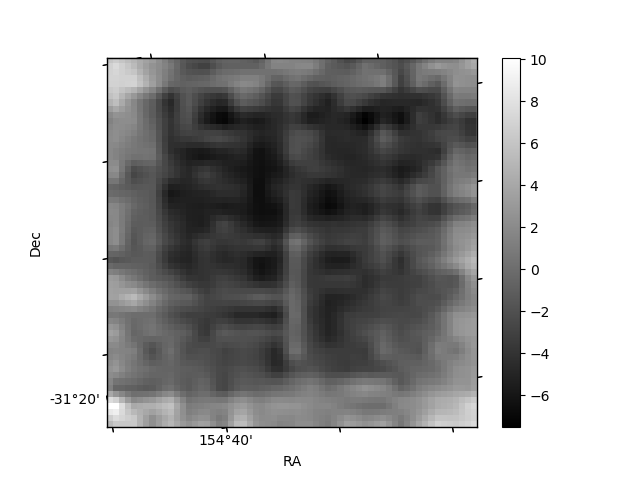
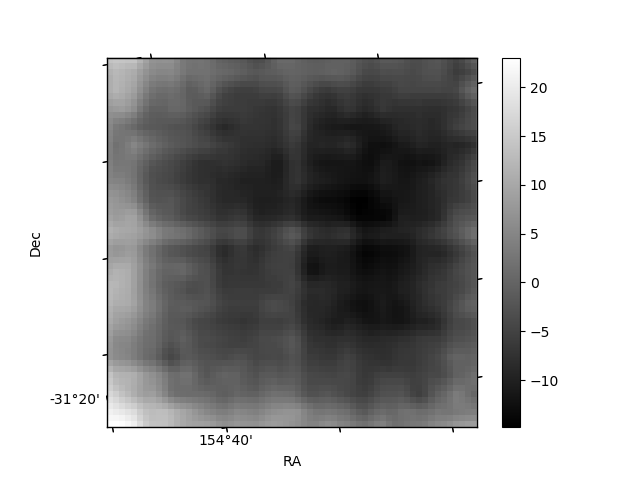
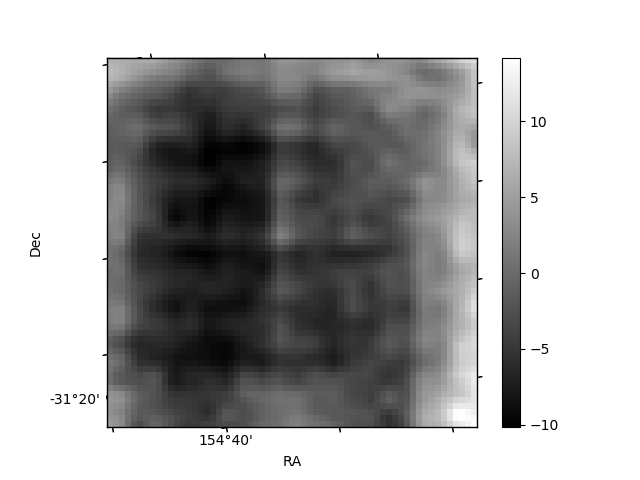
Histogram calculated using DETX and DETY for each event in the final _common_clean file
| Quadrant A | 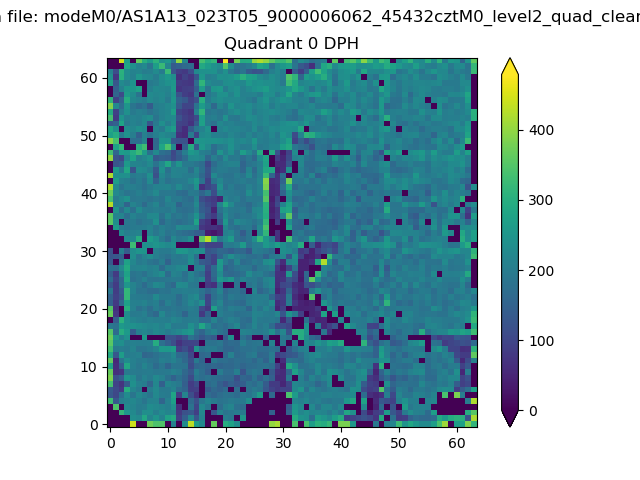 |
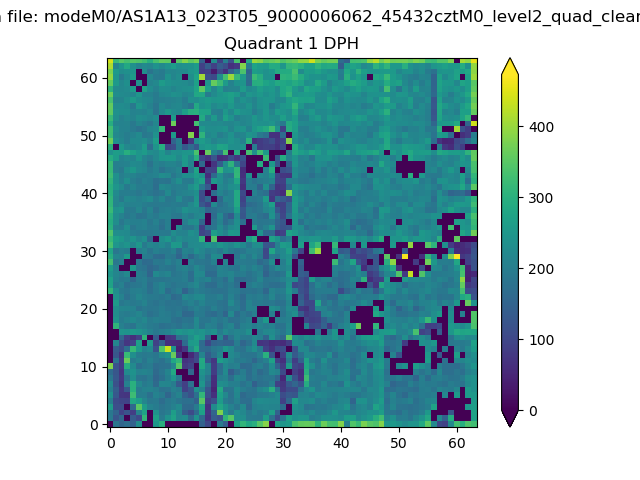 |
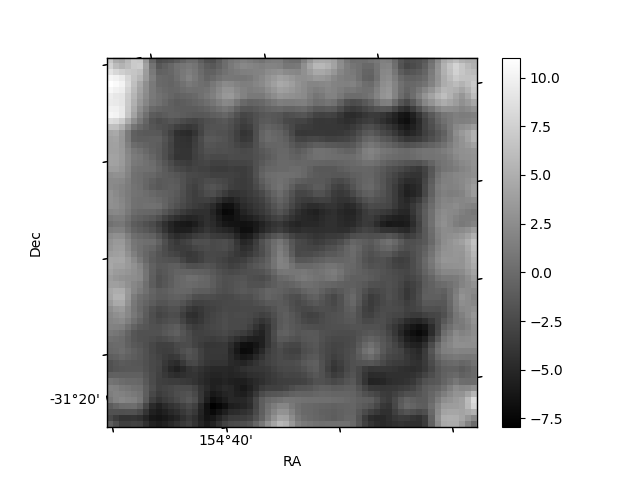
Quadrant B |
|---|---|---|---|
| Quadrant D | 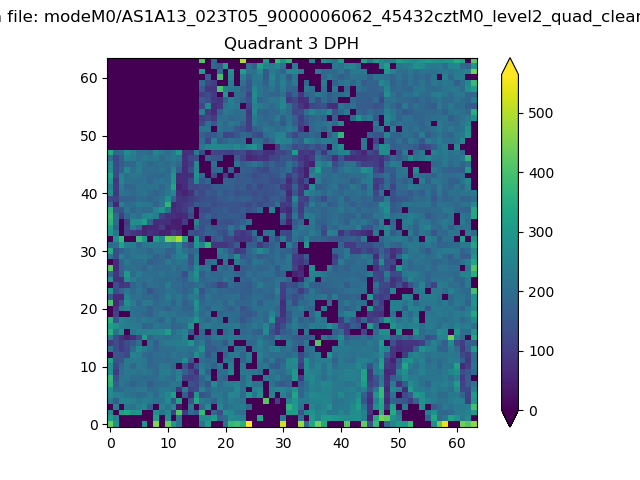 |
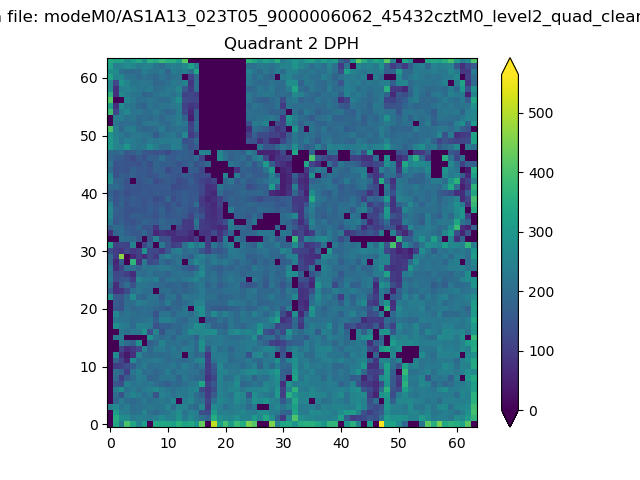 |
Quadrant C |
| Plot type | Count rate plots | Images |
|---|---|---|
| Comparison with Poisson distribution Blue bars denote a histogram of data divided into 1 sec bins. Red curve is a Poisson curve with rate = median count rate of data. |
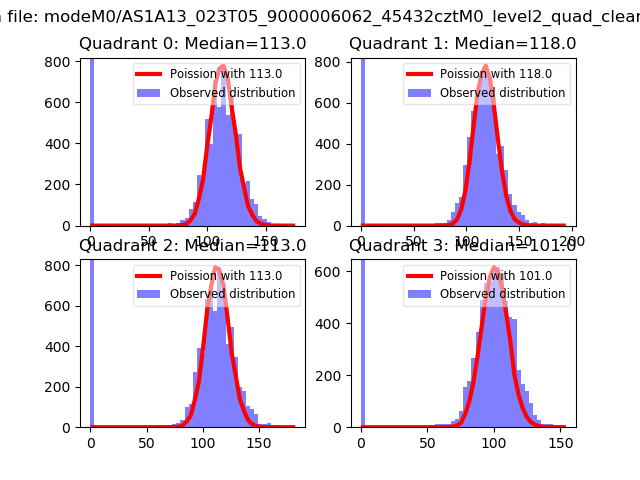 |
 |
| Quadrant-wise count rates Data is divided into 100 sec bins |
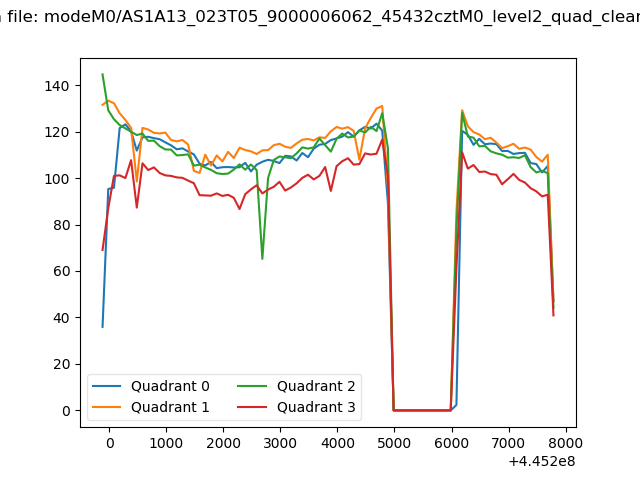 |
|
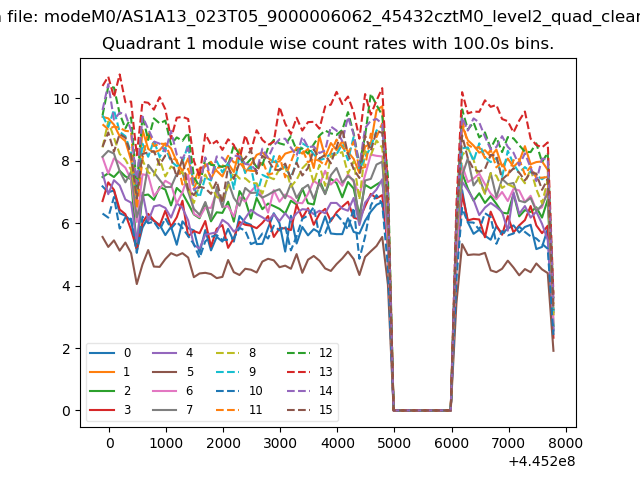
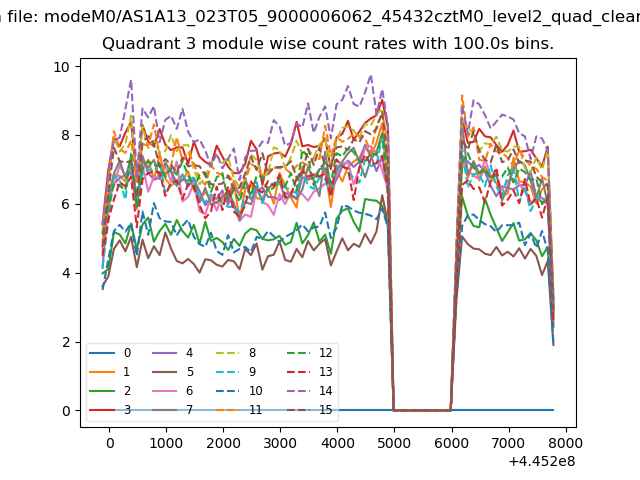
| Module-wise count rates for Quadrant A Data is divided into 100 sec bins |
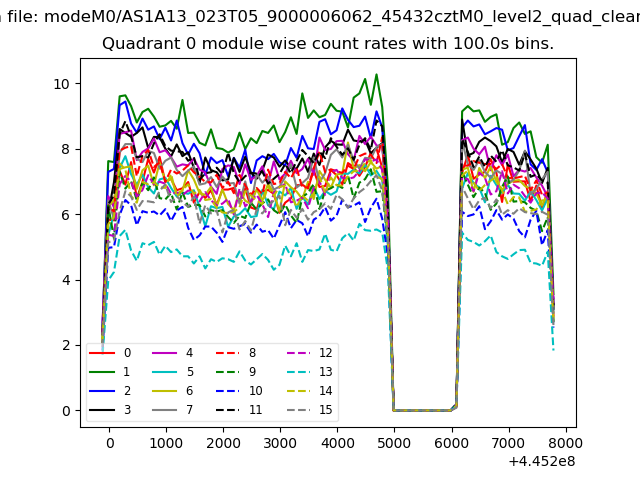 |
 |
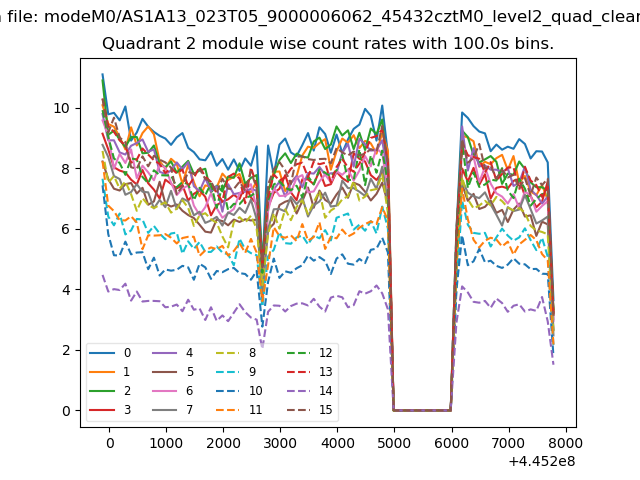
| Module-wise count rates for Quadrant B Data is divided into 100 sec bins |
 |
 |
| Module-wise count rates for Quadrant C Data is divided into 100 sec bins |
 |
 |
| Module-wise count rates for Quadrant D Data is divided into 100 sec bins |
 |
 |
| Parameter | Plot |
|---|---|
| CZT HV Monitor | 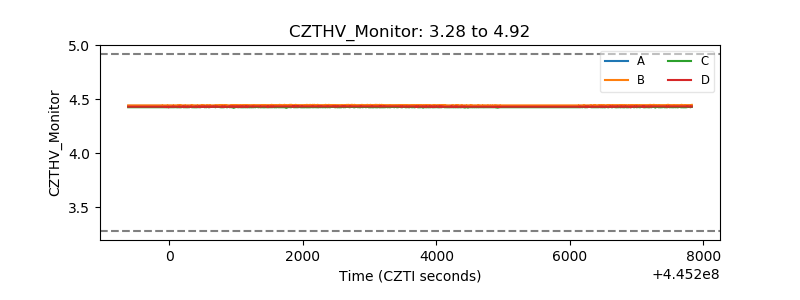 |
| D_VDD | 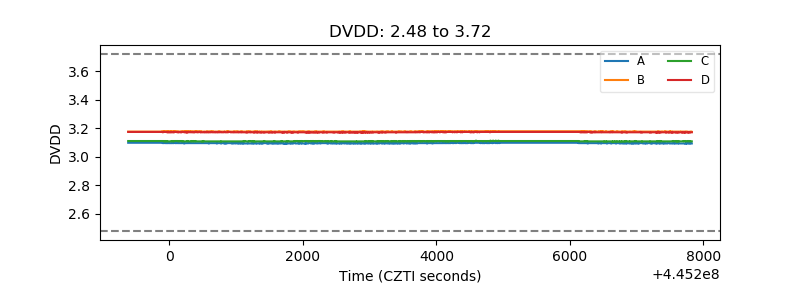 |
| Temperature 1 | 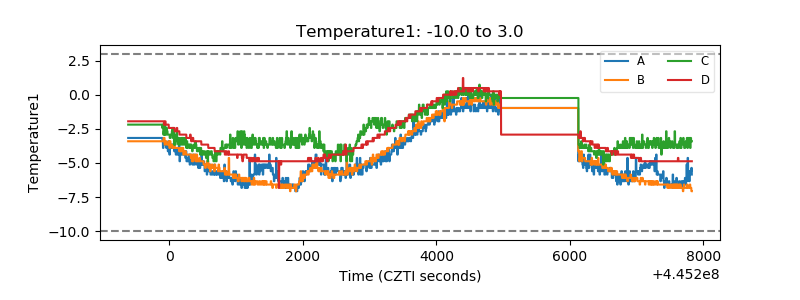 |
| Veto HV Monitor | 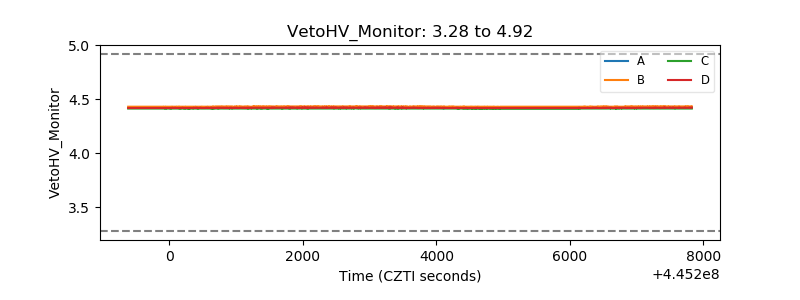 |
| Veto LLD |  |
| Alpha Counter | 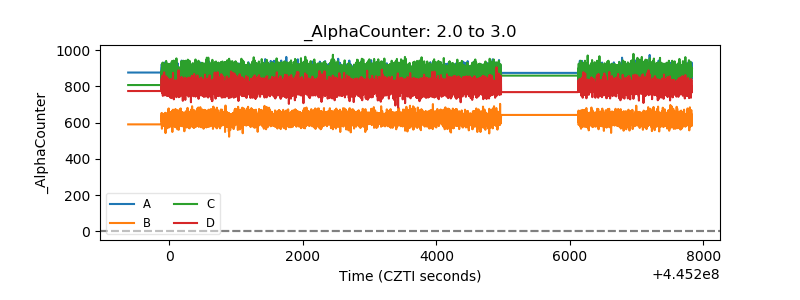 |
| _CPM_Rate | 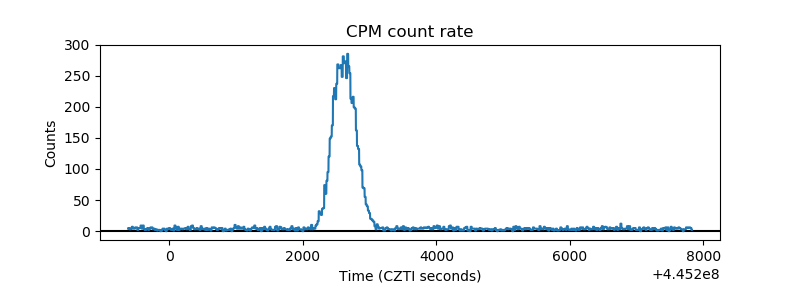 |
| CZT Counter | 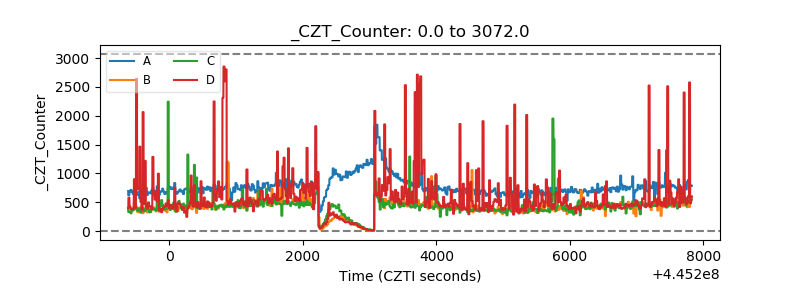 |
| +2.5 Volts monitor | 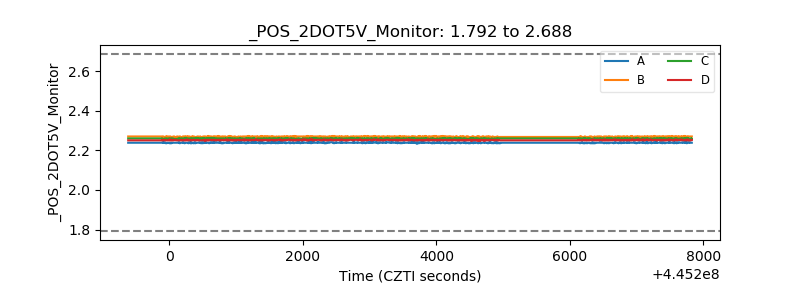 |
| +5 Volts monitor |  |
| _ROLL_ROT | 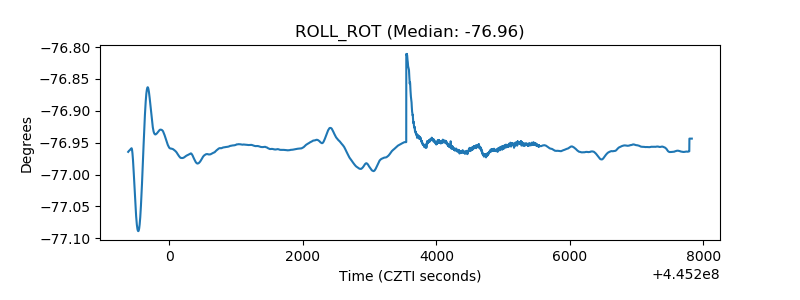 |
| _Roll_DEC | 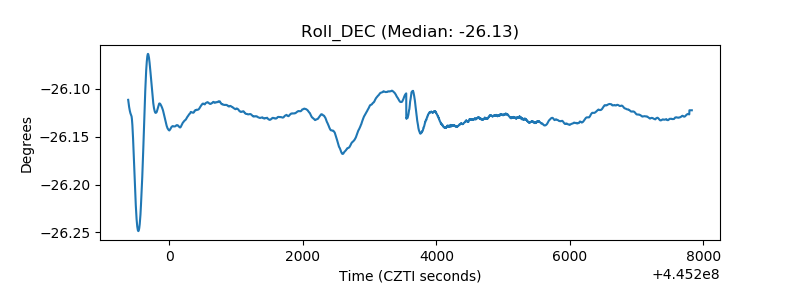 |
| _Roll_RA | 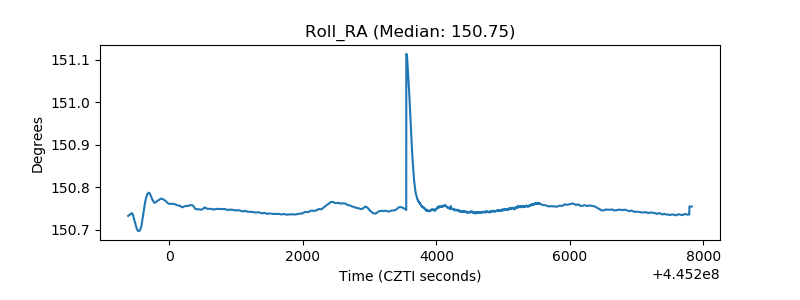 |
| Veto Counter | 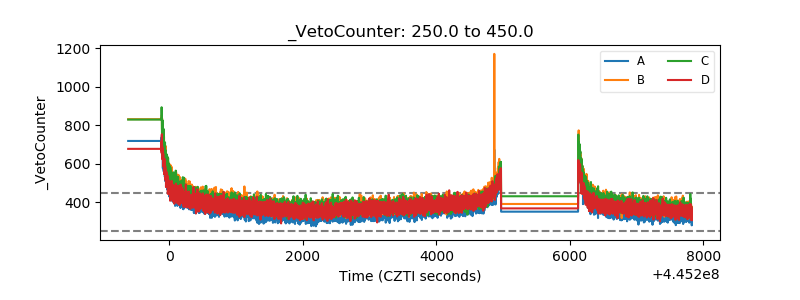 |