| Param | Original file | Final file |
|---|---|---|
| Filename | modeM0/AS1A13_023T05_9000006062_45434cztM0_level2.fits | modeM0/AS1A13_023T05_9000006062_45434cztM0_level2_quad_clean.evt |
| Size (bytes) | 500,950,080 | 116,346,240 |
| Size | 477.7 MB | 111.0 MB |
| Events in quadrant A | 6,199,921 | 759,365 |
| Events in quadrant B | 3,696,284 | 787,552 |
| Events in quadrant C | 3,494,302 | 772,938 |
| Events in quadrant D | 4,588,740 | 695,962 |
| Mode SS | |||
|---|---|---|---|
| Quadrant | BADHDUFLAG | Total packets | Discarded packets |
| A | 0 | 150 | 0 |
| B | 0 | 150 | 0 |
| C | 0 | 150 | 0 |
| D | 0 | 150 | 0 |
| Mode M9 | |||
|---|---|---|---|
| Quadrant | BADHDUFLAG | Total packets | Discarded packets |
| A | 0 | 4 | 0 |
| B | 0 | 4 | 0 |
| C | 0 | 4 | 0 |
| D | 0 | 4 | 0 |
| Mode M0 | |||
|---|---|---|---|
| Quadrant | BADHDUFLAG | Total packets | Discarded packets |
| A | 0 | 23479 | 3 |
| B | 0 | 16022 | 2 |
| C | 0 | 15672 | 2 |
| D | 0 | 18554 | 2 |
| Quadrant | Total seconds | Saturated seconds | Saturation percentage |
|---|---|---|---|
| A | 7271 | 240 | 3.300784% |
| B | 7272 | 187 | 2.571507% |
| C | 7272 | 103 | 1.416392% |
| D | 7272 | 188 | 2.585259% |
Noise dominated data is calculated using 1-second bins in cleaned event files. If a bin has >2000 counts, and if more than 50% of those come from <1% of pixels, then it is considered to be noise-dominated and hence unusable.
| Quadrant | # 1 sec bins | Bins with >0 counts | Bins with >2000 counts | High rate bins dominated by noise | Noise dominated (total time) | Noise dominated (detector-on time) | Marked lightcurve |
|---|---|---|---|---|---|---|---|
| A | 7701 | 7271 | 11 | 11 | 0.14% | 0.15% | 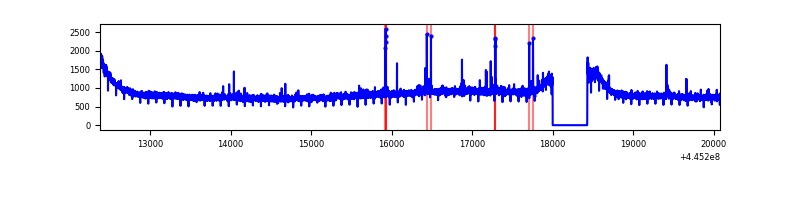 |
| B | 7702 | 7273 | 42 | 42 | 0.55% | 0.58% | 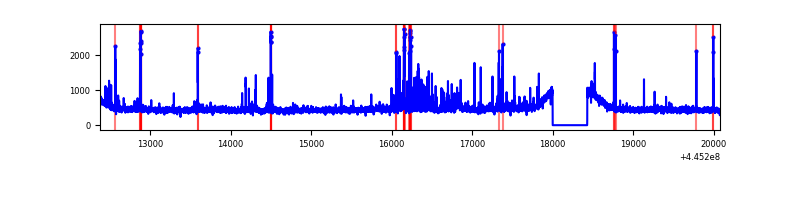 |
| C | 7702 | 7273 | 31 | 31 | 0.40% | 0.43% | 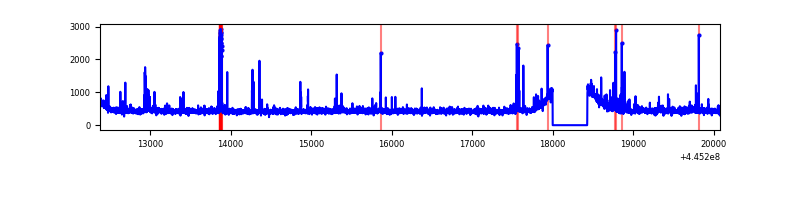 |
| D | 7702 | 7273 | 99 | 99 | 1.29% | 1.36% | 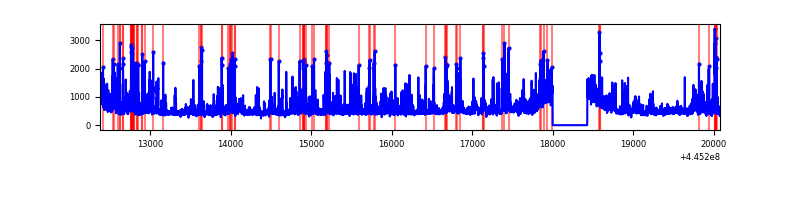 |
Top three noisy pixels from each quadrant. If the there are fewer than three noisy pixels in the level2.evt file, extra rows are filled as -1
| Pixel properties | Quadrant properties | ||||||
|---|---|---|---|---|---|---|---|
| Quadrant | DetID | PixID | Counts | Sigma | Mean | Median | Sigma |
| A | 10 | 83 | 2878458 | 16576.22 | 829 | 810 | 173.6 |
| A | 9 | 191 | 45198 | 255.69 | 829 | 810 | 173.6 |
| A | 10 | 248 | 30436 | 170.66 | 829 | 810 | 173.6 |
| B | 5 | 255 | 97660 | 575.97 | 838 | 814 | 168.1 |
| B | 15 | 35 | 91278 | 538.02 | 838 | 814 | 168.1 |
| B | 5 | 32 | 39442 | 229.73 | 838 | 814 | 168.1 |
| C | 14 | 254 | 184914 | 933.59 | 827 | 834 | 197.2 |
| C | 0 | 239 | 21987 | 107.28 | 827 | 834 | 197.2 |
| C | 12 | 250 | 18658 | 90.4 | 827 | 834 | 197.2 |
| D | 1 | 52 | 929555 | 4440.09 | 819 | 795 | 209.2 |
| D | 11 | 241 | 128140 | 608.79 | 819 | 795 | 209.2 |
| D | 5 | 222 | 109039 | 517.48 | 819 | 795 | 209.2 |
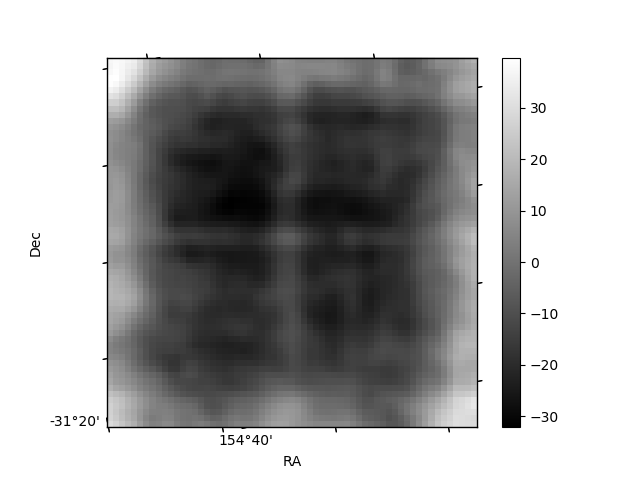
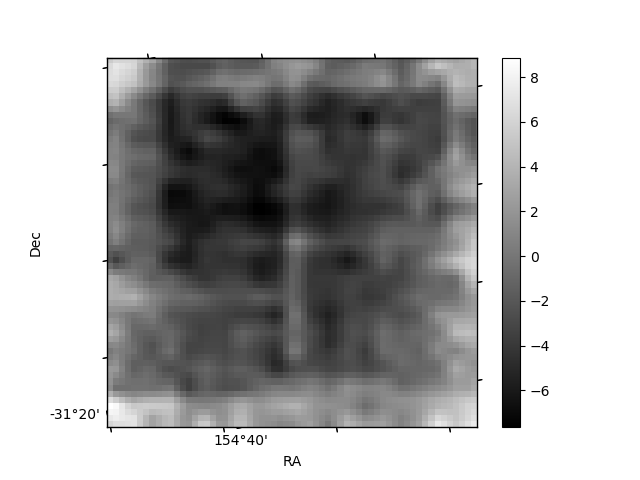
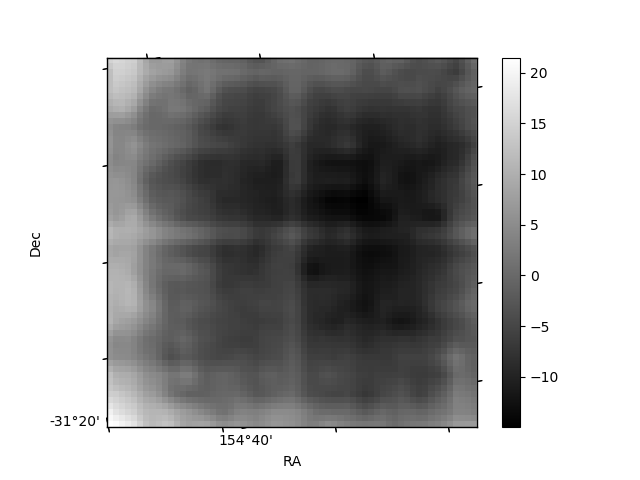
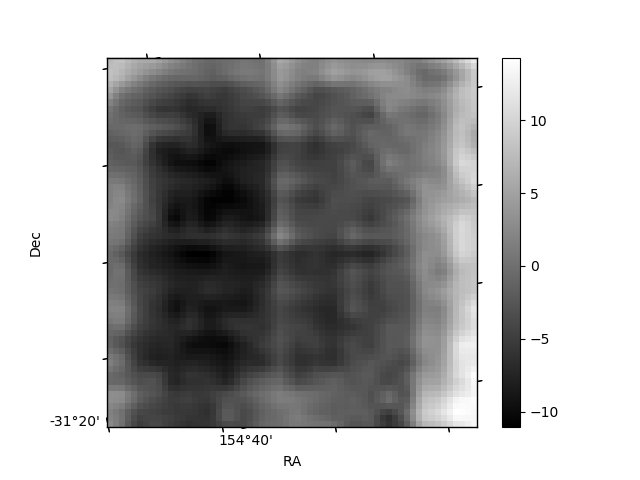
Histogram calculated using DETX and DETY for each event in the final _common_clean file
| Quadrant A | 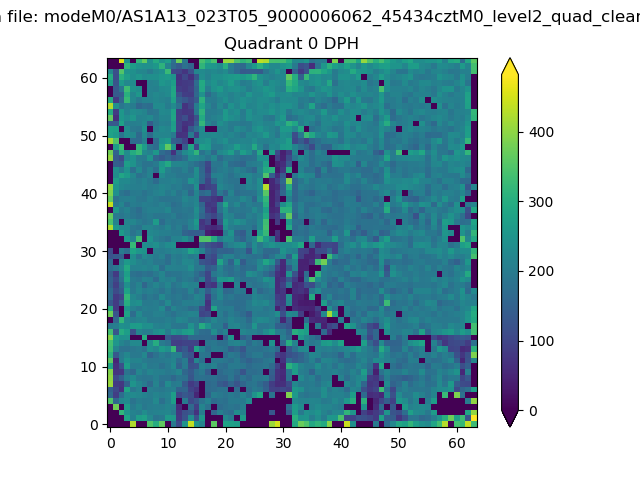 |
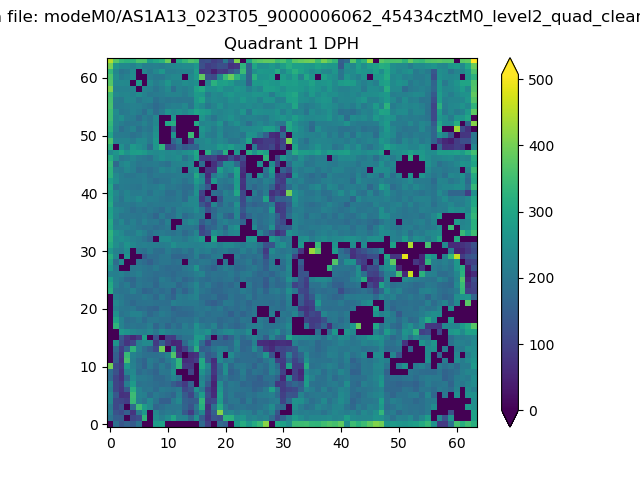 |
Quadrant B |
|---|---|---|---|
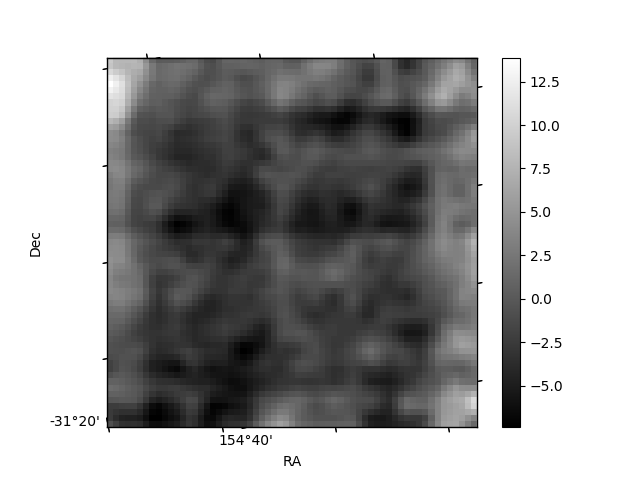
| Quadrant D | 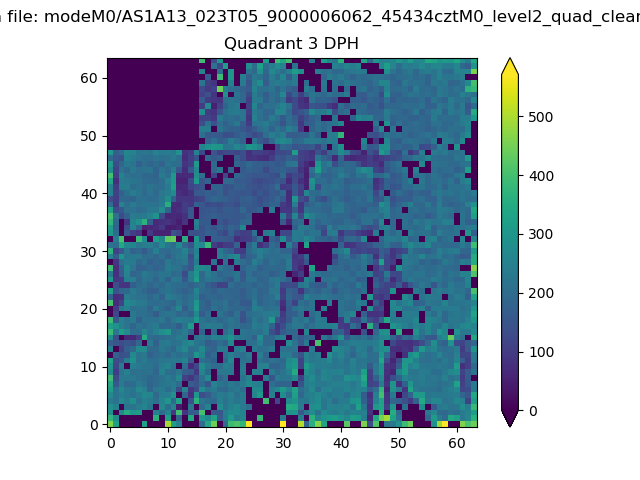 |
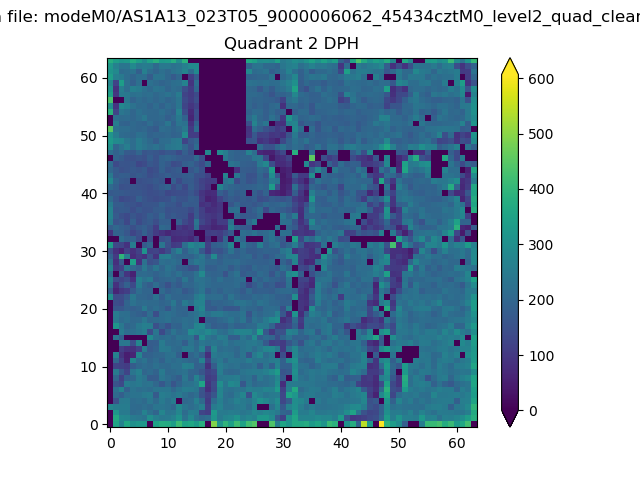 |
Quadrant C |
| Plot type | Count rate plots | Images |
|---|---|---|
| Comparison with Poisson distribution Blue bars denote a histogram of data divided into 1 sec bins. Red curve is a Poisson curve with rate = median count rate of data. |
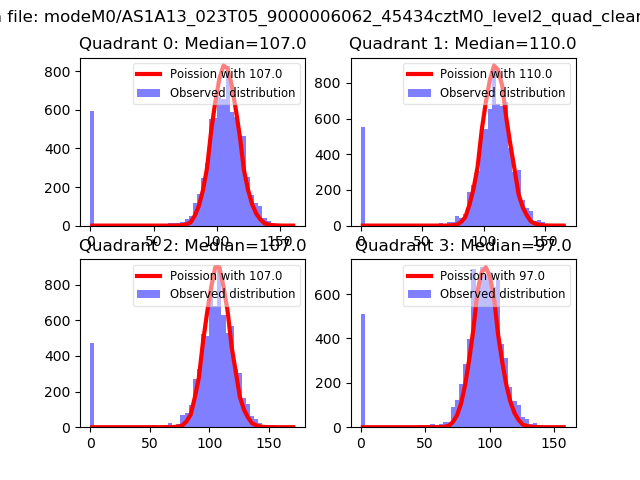 |
 |
| Quadrant-wise count rates Data is divided into 100 sec bins |
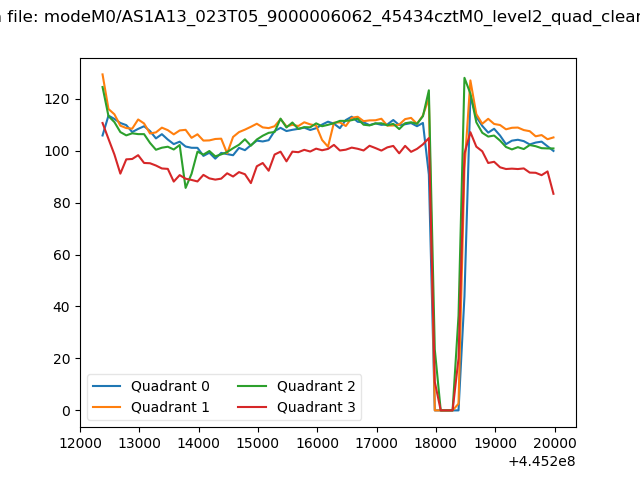 |
|
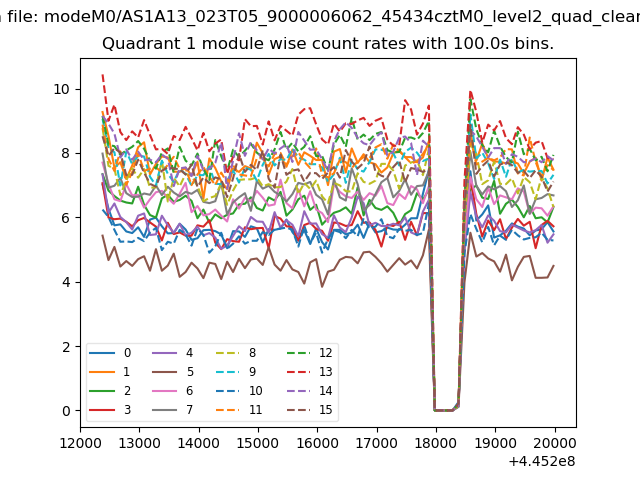
| Module-wise count rates for Quadrant A Data is divided into 100 sec bins |
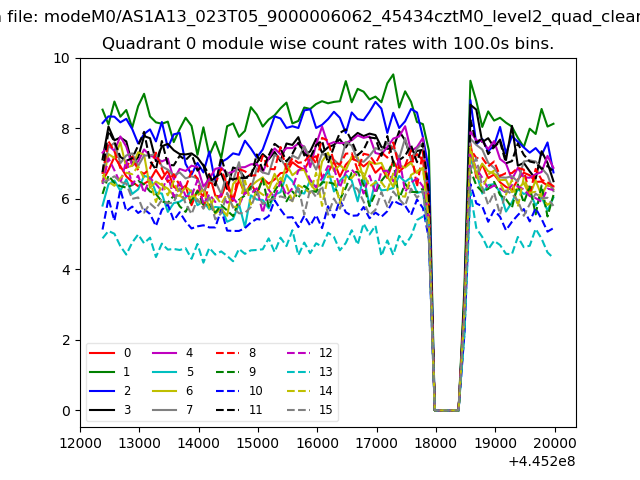 |
 |
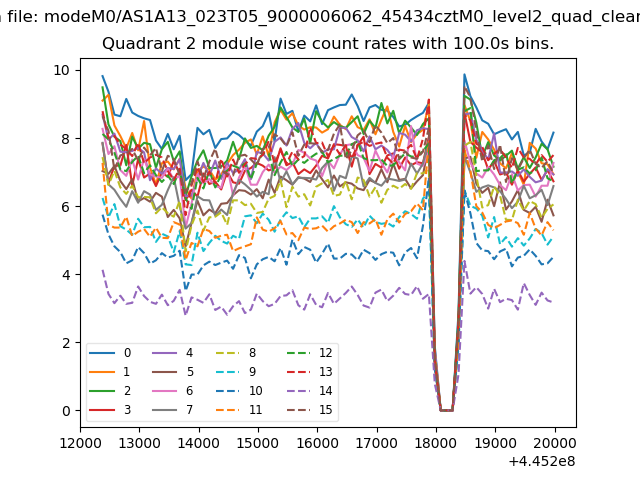
| Module-wise count rates for Quadrant B Data is divided into 100 sec bins |
 |
 |
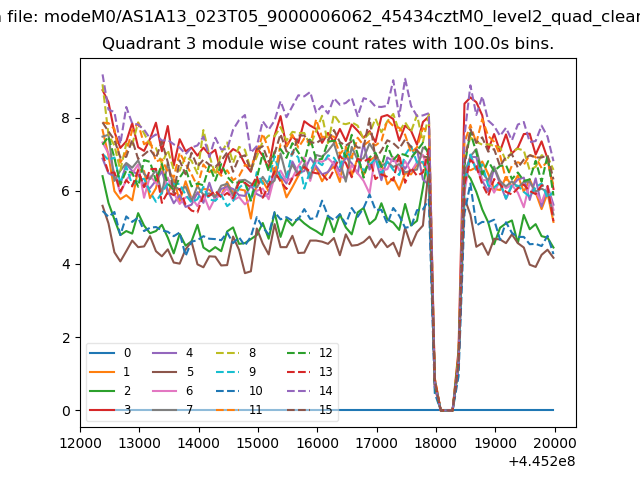
| Module-wise count rates for Quadrant C Data is divided into 100 sec bins |
 |
 |
| Module-wise count rates for Quadrant D Data is divided into 100 sec bins |
 |
 |
| Parameter | Plot |
|---|---|
| CZT HV Monitor |  |
| D_VDD | 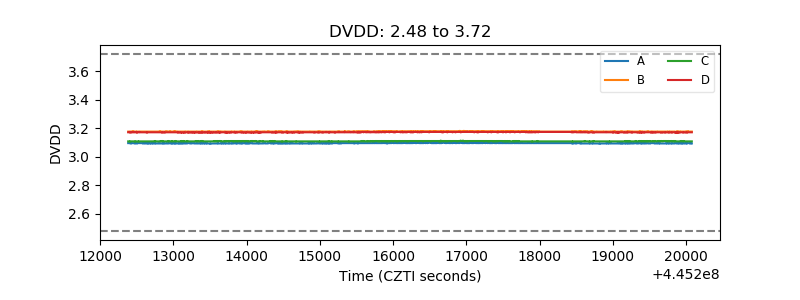 |
| Temperature 1 | 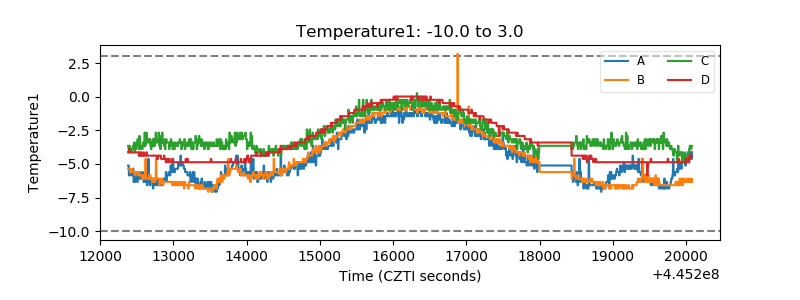 |
| Veto HV Monitor | 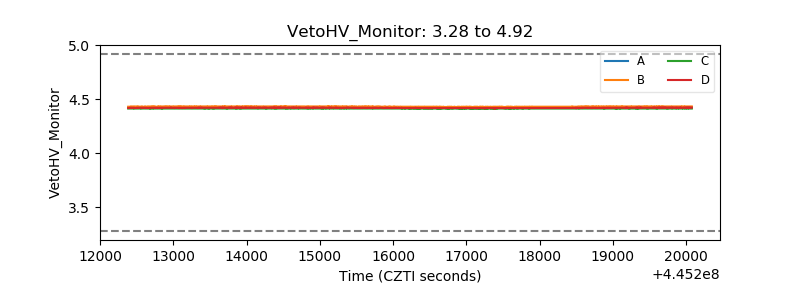 |
| Veto LLD | 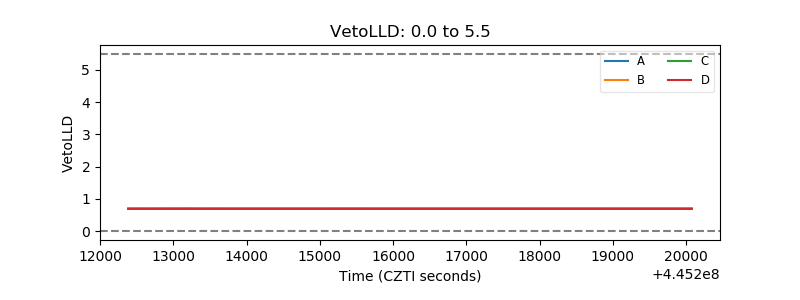 |
| Alpha Counter | 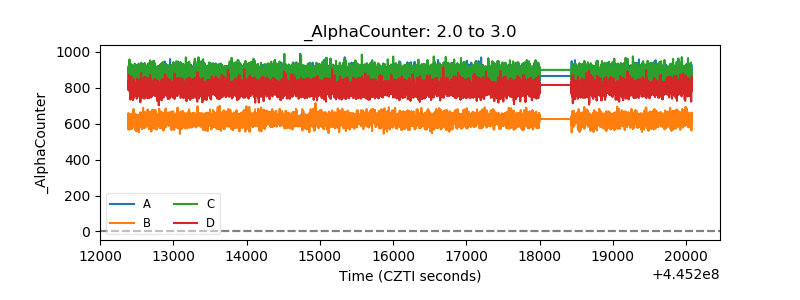 |
| _CPM_Rate | 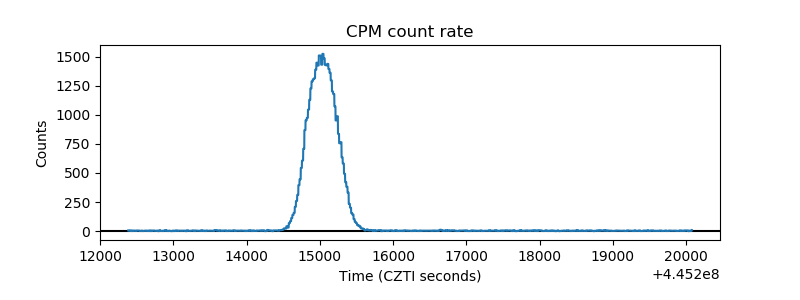 |
| CZT Counter | 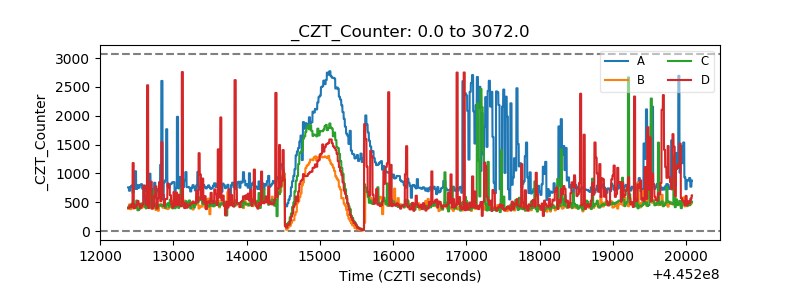 |
| +2.5 Volts monitor | 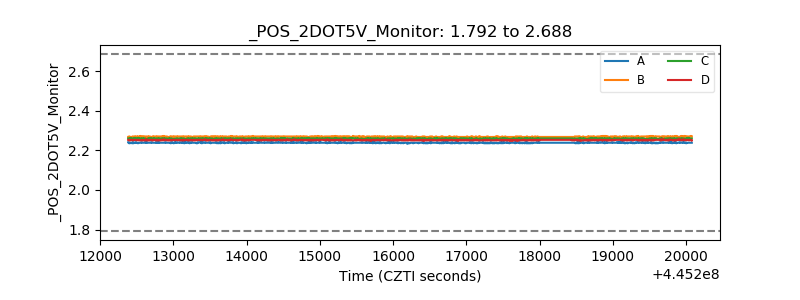 |
| +5 Volts monitor | 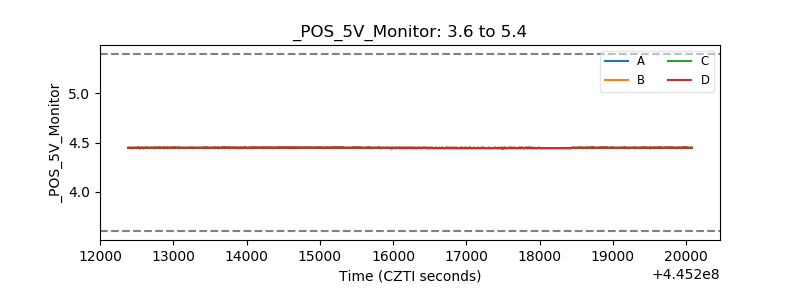 |
| _ROLL_ROT | 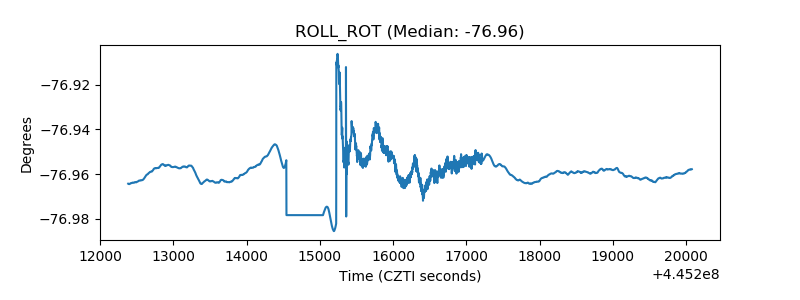 |
| _Roll_DEC | 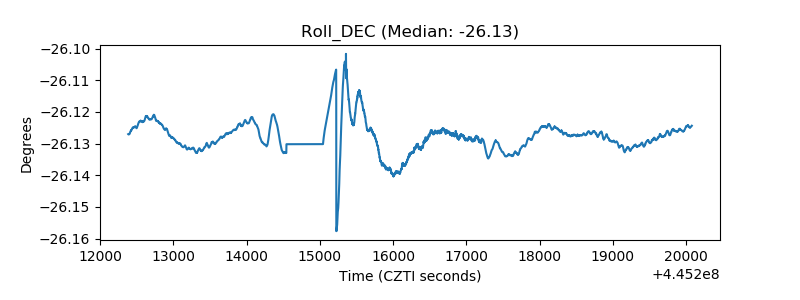 |
| _Roll_RA | 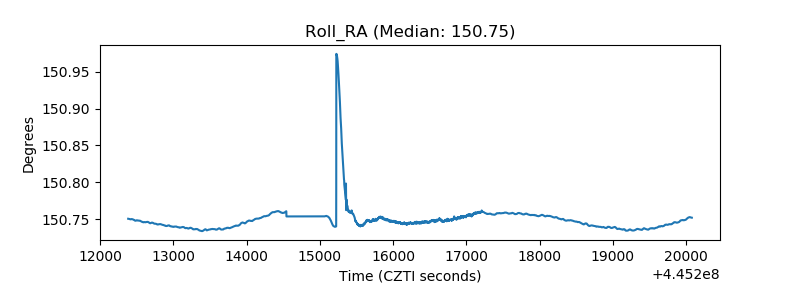 |
| Veto Counter | 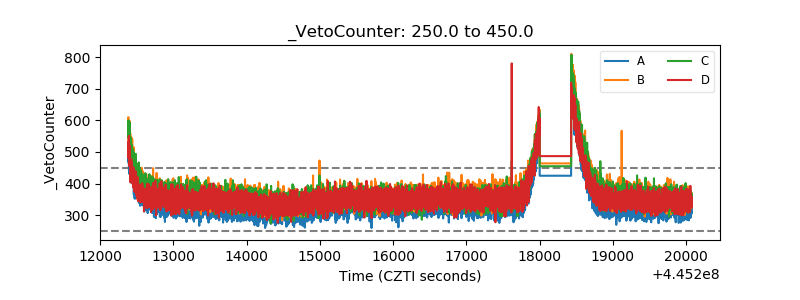 |