| Param | Original file | Final file |
|---|---|---|
| Filename | modeM0/AS1A13_023T05_9000006062_45436cztM0_level2.fits | modeM0/AS1A13_023T05_9000006062_45436cztM0_level2_quad_clean.evt |
| Size (bytes) | 558,740,160 | 122,904,000 |
| Size | 532.9 MB | 117.2 MB |
| Events in quadrant A | 6,903,049 | 794,468 |
| Events in quadrant B | 3,921,818 | 844,391 |
| Events in quadrant C | 3,701,568 | 817,092 |
| Events in quadrant D | 5,553,878 | 725,152 |
| Mode SS | |||
|---|---|---|---|
| Quadrant | BADHDUFLAG | Total packets | Discarded packets |
| A | 0 | 154 | 0 |
| B | 0 | 154 | 0 |
| C | 0 | 154 | 0 |
| D | 0 | 154 | 0 |
| Mode M0 | |||
|---|---|---|---|
| Quadrant | BADHDUFLAG | Total packets | Discarded packets |
| A | 0 | 25844 | 0 |
| B | 0 | 16926 | 0 |
| C | 0 | 16630 | 0 |
| D | 0 | 21755 | 0 |
| Quadrant | Total seconds | Saturated seconds | Saturation percentage |
|---|---|---|---|
| A | 7769 | 367 | 4.723903% |
| B | 7770 | 100 | 1.287001% |
| C | 7770 | 46 | 0.592021% |
| D | 7770 | 267 | 3.436293% |
Noise dominated data is calculated using 1-second bins in cleaned event files. If a bin has >2000 counts, and if more than 50% of those come from <1% of pixels, then it is considered to be noise-dominated and hence unusable.
| Quadrant | # 1 sec bins | Bins with >0 counts | Bins with >2000 counts | High rate bins dominated by noise | Noise dominated (total time) | Noise dominated (detector-on time) | Marked lightcurve |
|---|---|---|---|---|---|---|---|
| A | 7769 | 7769 | 265 | 265 | 3.41% | 3.41% | 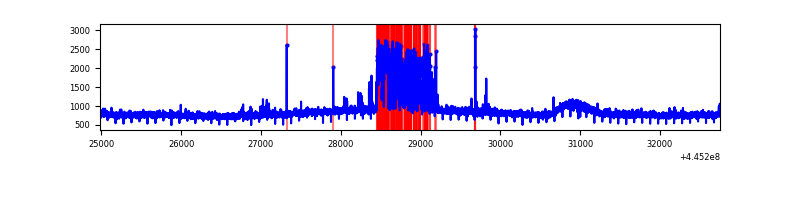 |
| B | 7770 | 7770 | 18 | 18 | 0.23% | 0.23% | 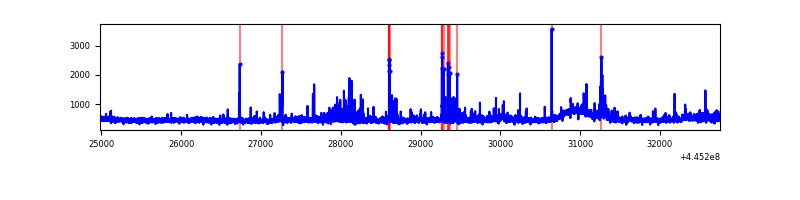 |
| C | 7770 | 7770 | 34 | 34 | 0.44% | 0.44% | 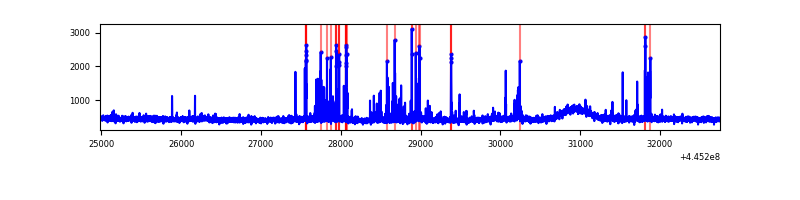 |
| D | 7770 | 7770 | 218 | 218 | 2.81% | 2.81% | 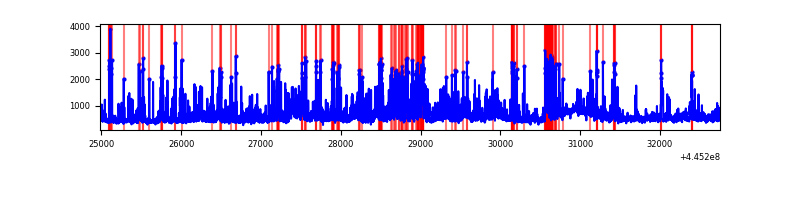 |
Top three noisy pixels from each quadrant. If the there are fewer than three noisy pixels in the level2.evt file, extra rows are filled as -1
| Pixel properties | Quadrant properties | ||||||
|---|---|---|---|---|---|---|---|
| Quadrant | DetID | PixID | Counts | Sigma | Mean | Median | Sigma |
| A | 10 | 83 | 2800441 | 15352.85 | 869 | 849 | 182.3 |
| A | 13 | 248 | 646635 | 3541.47 | 869 | 849 | 182.3 |
| A | 9 | 191 | 64325 | 348.1 | 869 | 849 | 182.3 |
| B | 0 | 171 | 161111 | 924.13 | 878 | 850 | 173.4 |
| B | 8 | 234 | 60585 | 344.46 | 878 | 850 | 173.4 |
| B | 15 | 35 | 51774 | 293.65 | 878 | 850 | 173.4 |
| C | 14 | 254 | 141311 | 685.41 | 866 | 870 | 204.9 |
| C | 0 | 239 | 92431 | 446.85 | 866 | 870 | 204.9 |
| C | 12 | 2 | 42048 | 200.96 | 866 | 870 | 204.9 |
| D | 1 | 52 | 1320732 | 6016.45 | 855 | 826 | 219.4 |
| D | 13 | 249 | 270584 | 1229.62 | 855 | 826 | 219.4 |
| D | 11 | 241 | 175690 | 797.07 | 855 | 826 | 219.4 |
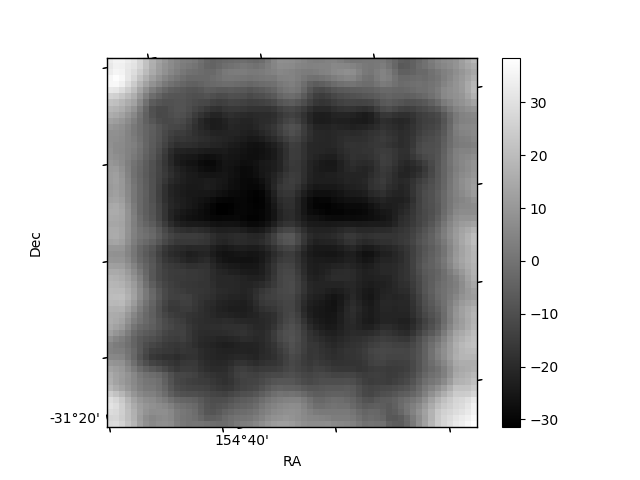
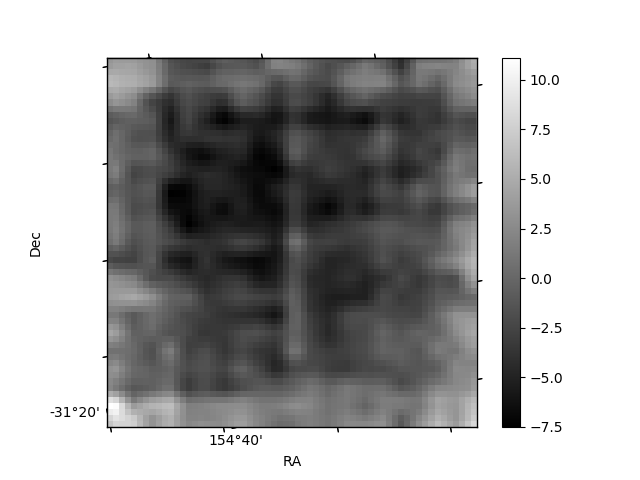
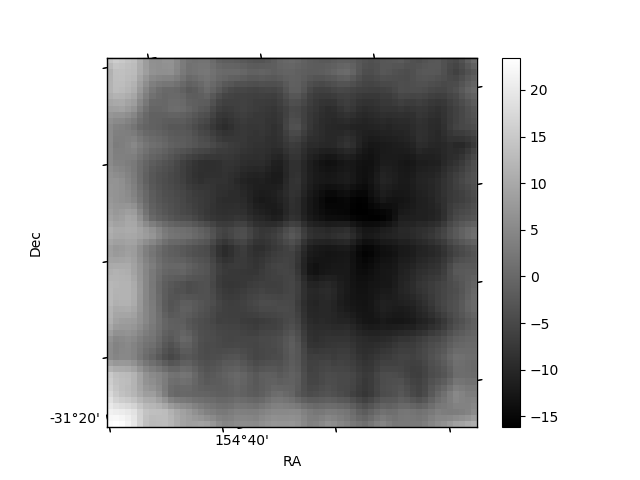
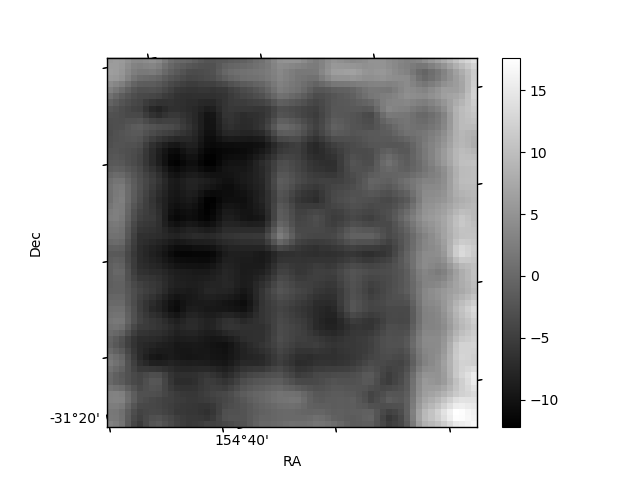
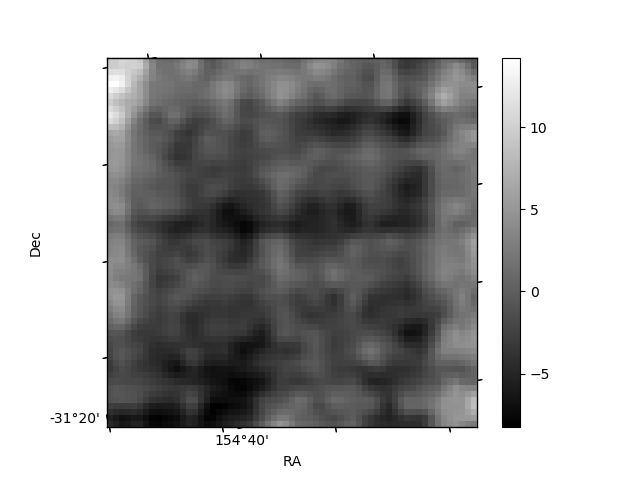
Histogram calculated using DETX and DETY for each event in the final _common_clean file
| Quadrant A | 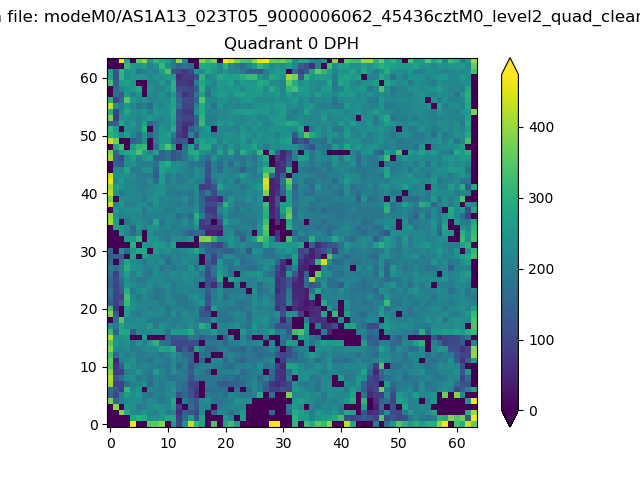 |
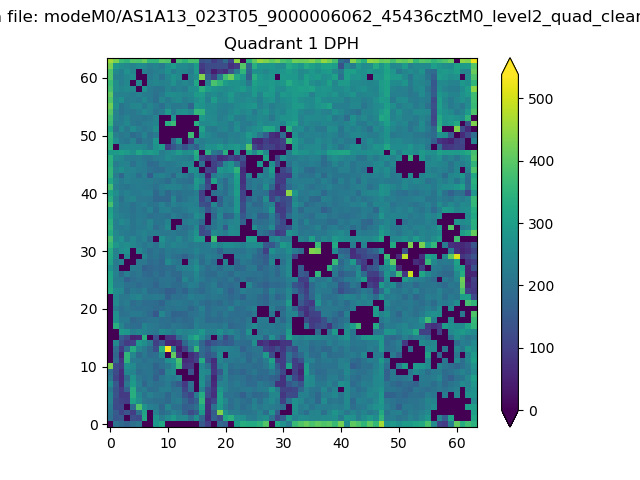 |
Quadrant B |
|---|---|---|---|
| Quadrant D | 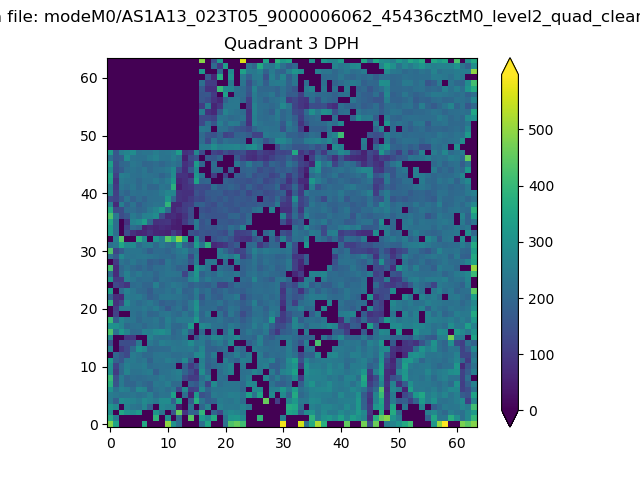 |
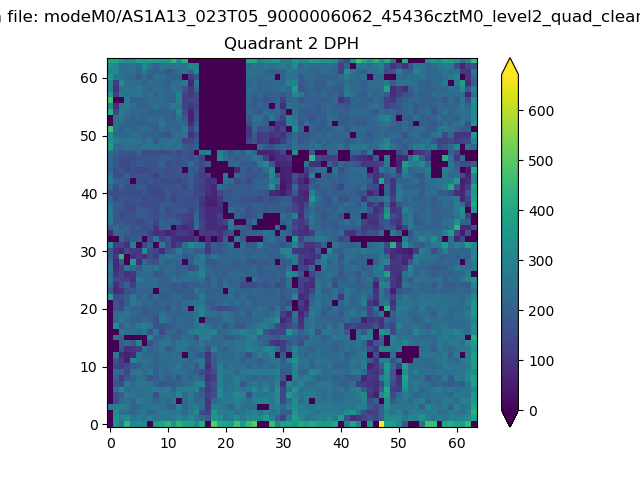 |
Quadrant C |
| Plot type | Count rate plots | Images |
|---|---|---|
| Comparison with Poisson distribution Blue bars denote a histogram of data divided into 1 sec bins. Red curve is a Poisson curve with rate = median count rate of data. |
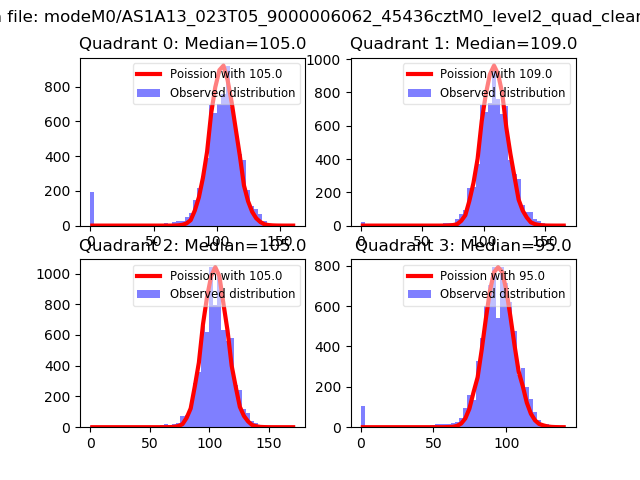 |
 |
| Quadrant-wise count rates Data is divided into 100 sec bins |
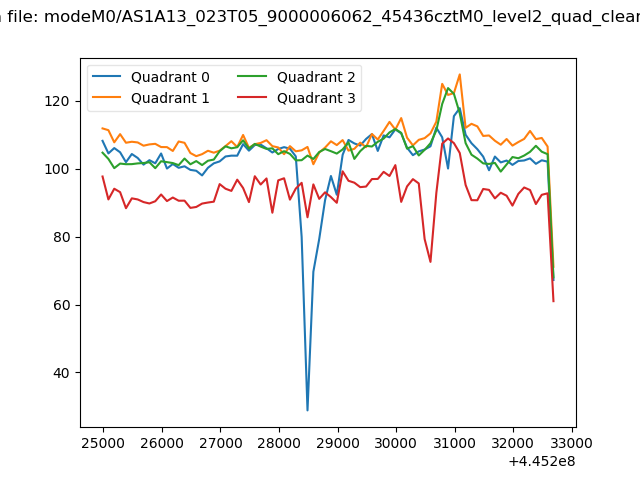 |
|
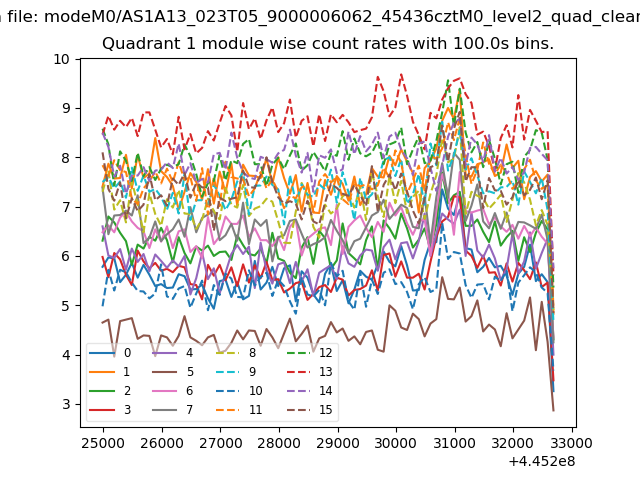
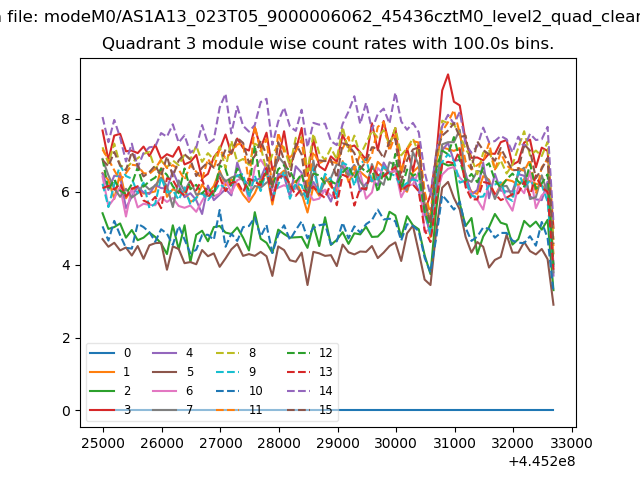
| Module-wise count rates for Quadrant A Data is divided into 100 sec bins |
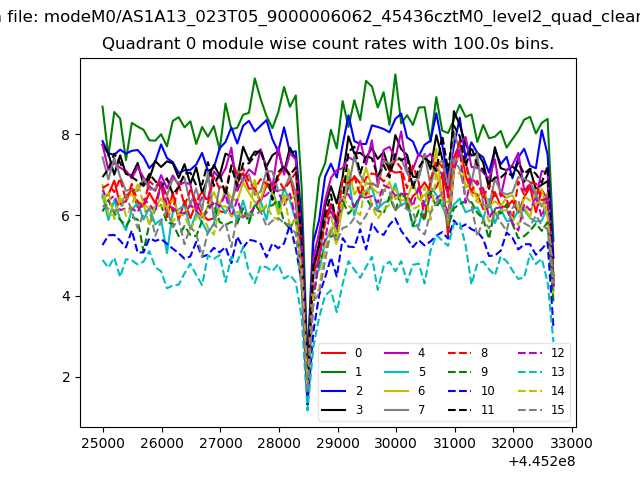 |
 |
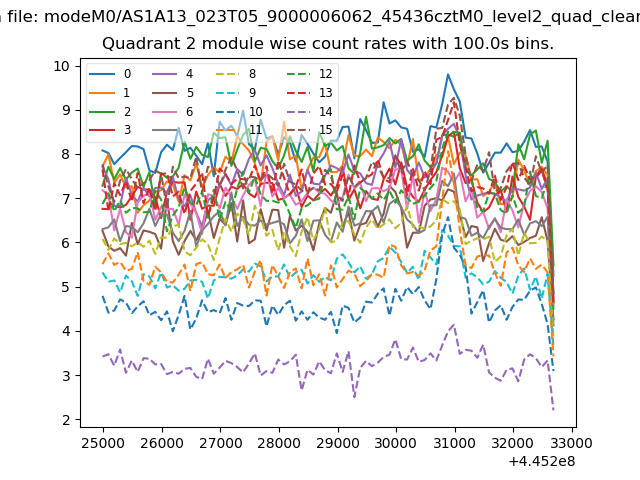
| Module-wise count rates for Quadrant B Data is divided into 100 sec bins |
 |
 |
| Module-wise count rates for Quadrant C Data is divided into 100 sec bins |
 |
 |
| Module-wise count rates for Quadrant D Data is divided into 100 sec bins |
 |
 |
| Parameter | Plot |
|---|---|
| CZT HV Monitor | 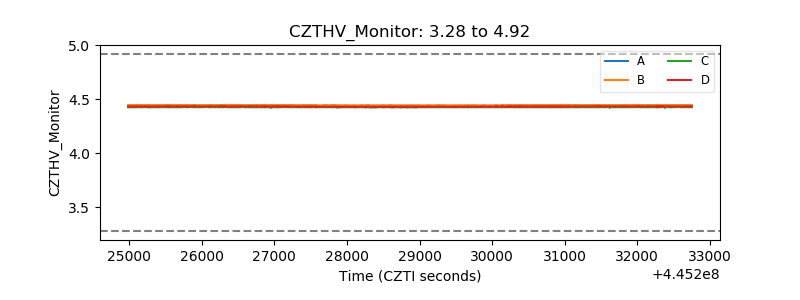 |
| D_VDD | 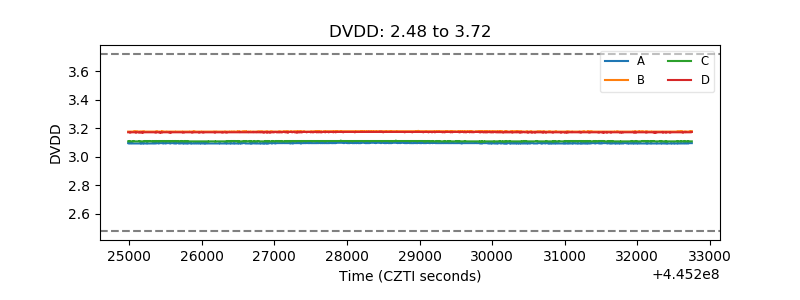 |
| Temperature 1 | 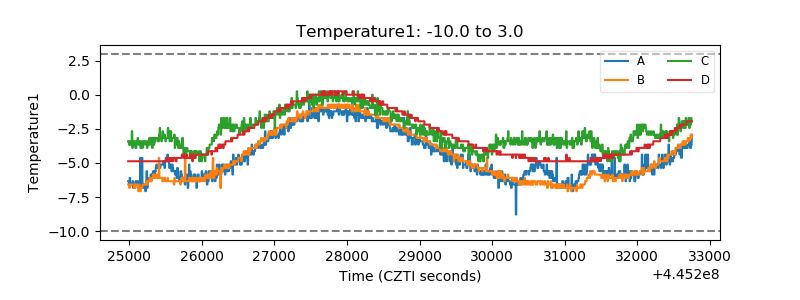 |
| Veto HV Monitor | 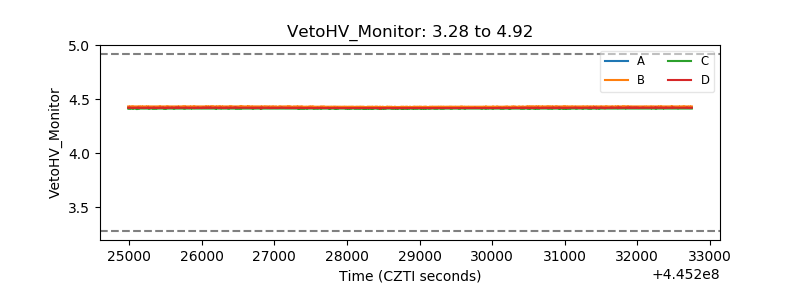 |
| Veto LLD | 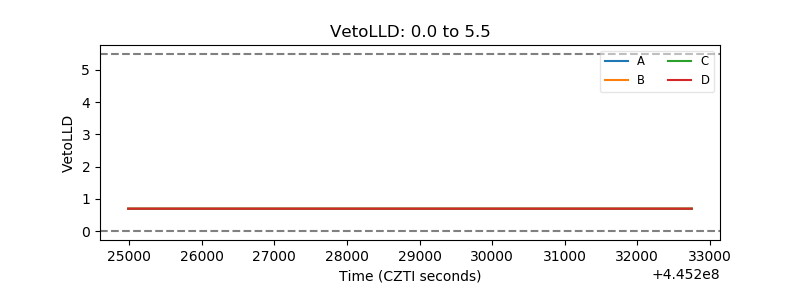 |
| Alpha Counter | 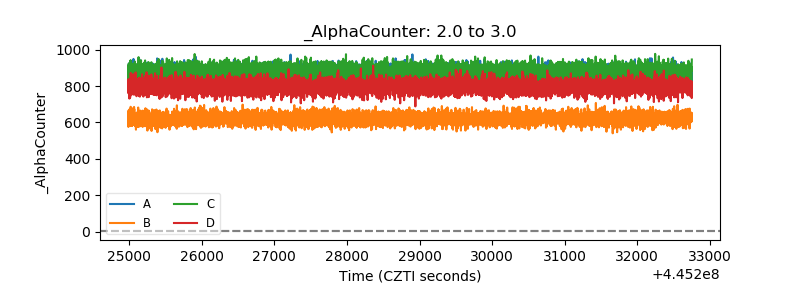 |
| _CPM_Rate | 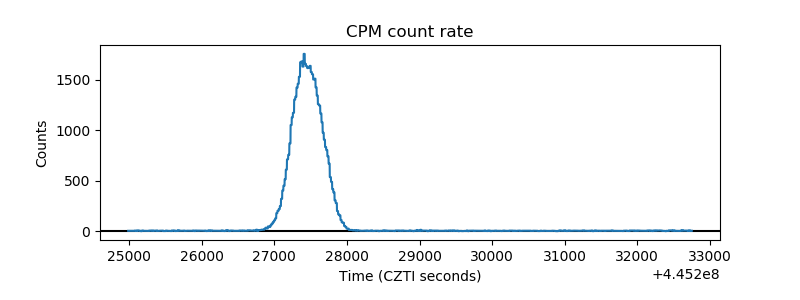 |
| CZT Counter | 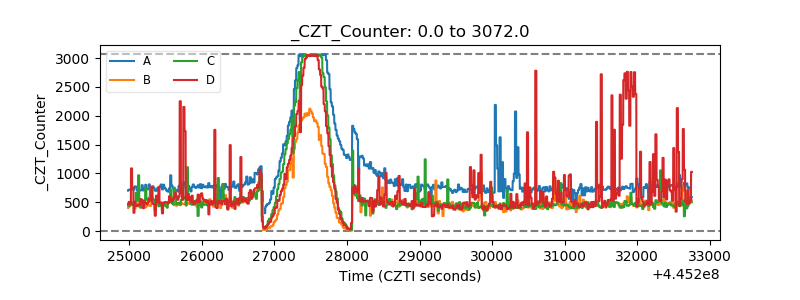 |
| +2.5 Volts monitor |  |
| +5 Volts monitor | 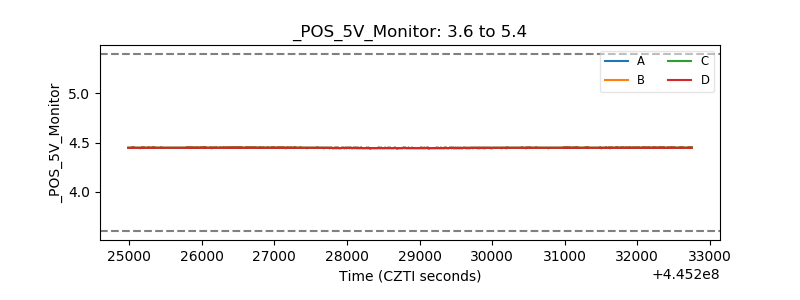 |
| _ROLL_ROT | 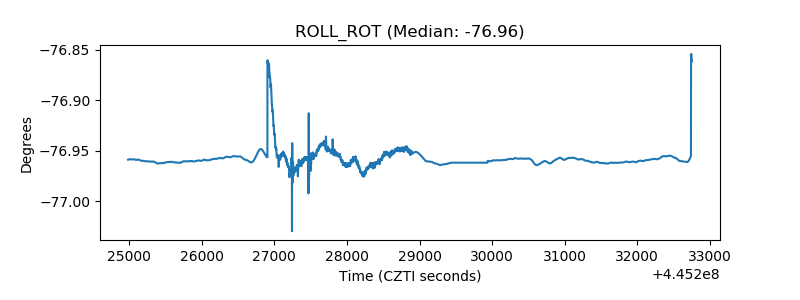 |
| _Roll_DEC | 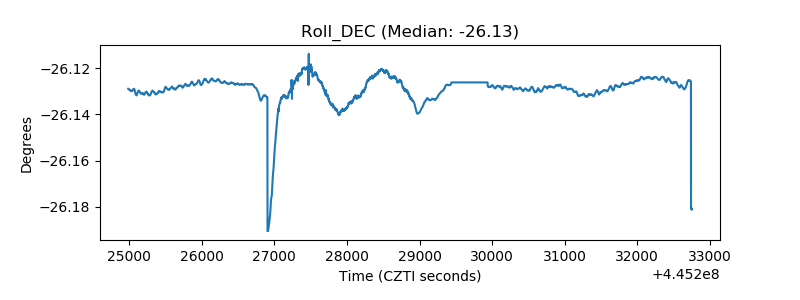 |
| _Roll_RA | 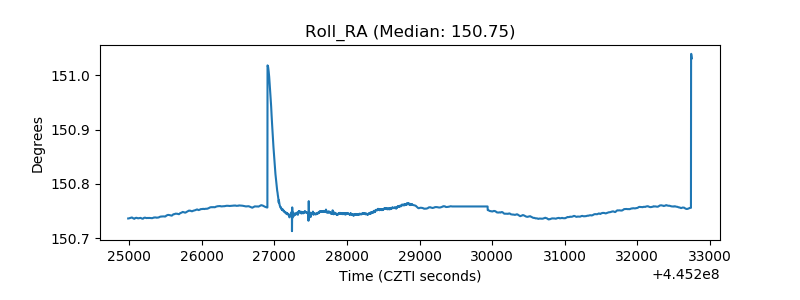 |
| Veto Counter | 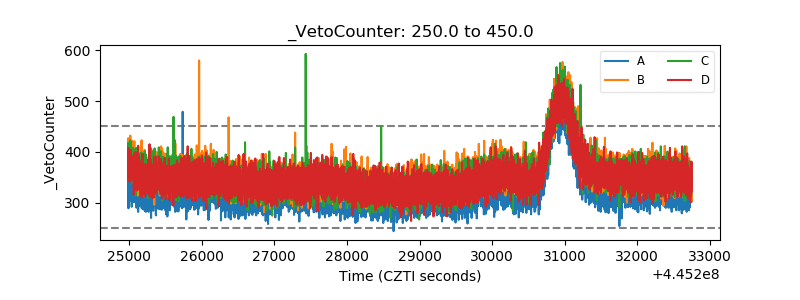 |