| Param | Original file | Final file |
|---|---|---|
| Filename | modeM0/AS1A13_024T03_9000006064_45260cztM0_level2.fits | modeM0/AS1A13_024T03_9000006064_45260cztM0_level2_quad_clean.evt |
| Size (bytes) | 487,751,040 | 109,451,520 |
| Size | 465.2 MB | 104.4 MB |
| Events in quadrant A | 5,386,760 | 719,710 |
| Events in quadrant B | 3,966,633 | 747,234 |
| Events in quadrant C | 3,203,086 | 725,120 |
| Events in quadrant D | 4,964,900 | 643,140 |
| Mode M0 | |||
|---|---|---|---|
| Quadrant | BADHDUFLAG | Total packets | Discarded packets |
| A | 0 | 21209 | 2 |
| B | 0 | 16653 | 2 |
| C | 0 | 14600 | 2 |
| D | 0 | 19492 | 2 |
| Mode SS | |||
|---|---|---|---|
| Quadrant | BADHDUFLAG | Total packets | Discarded packets |
| A | 0 | 140 | 0 |
| B | 0 | 140 | 0 |
| C | 0 | 140 | 0 |
| D | 0 | 140 | 0 |
| Mode M9 | |||
|---|---|---|---|
| Quadrant | BADHDUFLAG | Total packets | Discarded packets |
| A | 0 | 1 | 0 |
| B | 0 | 1 | 0 |
| C | 0 | 1 | 0 |
| D | 0 | 1 | 0 |
| Quadrant | Total seconds | Saturated seconds | Saturation percentage |
|---|---|---|---|
| A | 6870 | 334 | 4.861718% |
| B | 6870 | 404 | 5.880640% |
| C | 6869 | 206 | 2.998981% |
| D | 6869 | 440 | 6.405590% |
Noise dominated data is calculated using 1-second bins in cleaned event files. If a bin has >2000 counts, and if more than 50% of those come from <1% of pixels, then it is considered to be noise-dominated and hence unusable.
| Quadrant | # 1 sec bins | Bins with >0 counts | Bins with >2000 counts | High rate bins dominated by noise | Noise dominated (total time) | Noise dominated (detector-on time) | Marked lightcurve |
|---|---|---|---|---|---|---|---|
| A | 7000 | 6870 | 5 | 5 | 0.07% | 0.07% | 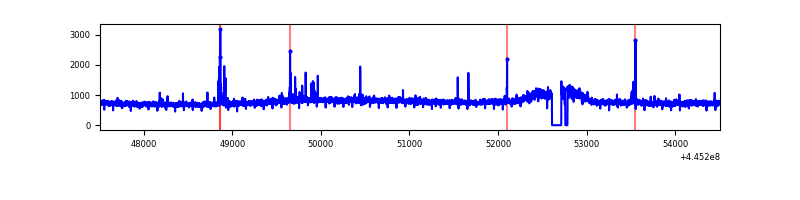 |
| B | 7000 | 6870 | 73 | 73 | 1.04% | 1.06% | 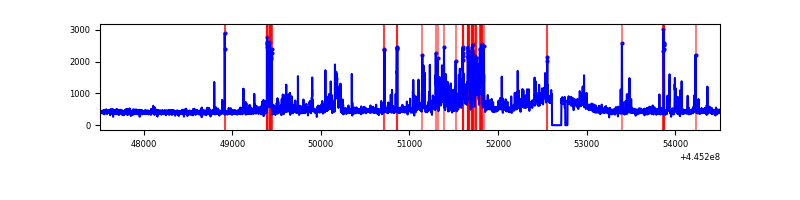 |
| C | 6999 | 6871 | 35 | 35 | 0.50% | 0.51% | 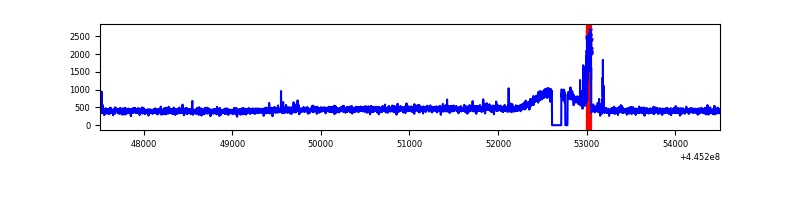 |
| D | 6999 | 6870 | 238 | 238 | 3.40% | 3.46% | 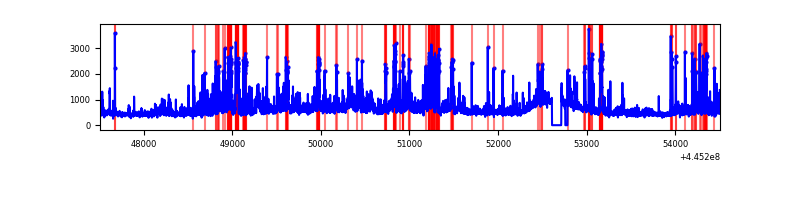 |
Top three noisy pixels from each quadrant. If the there are fewer than three noisy pixels in the level2.evt file, extra rows are filled as -1
| Pixel properties | Quadrant properties | ||||||
|---|---|---|---|---|---|---|---|
| Quadrant | DetID | PixID | Counts | Sigma | Mean | Median | Sigma |
| A | 10 | 83 | 2209497 | 13200.98 | 795 | 777 | 167.3 |
| A | 13 | 248 | 47803 | 281.06 | 795 | 777 | 167.3 |
| A | 12 | 227 | 23320 | 134.73 | 795 | 777 | 167.3 |
| B | 12 | 3 | 518890 | 3295.09 | 787 | 762 | 157.2 |
| B | 12 | 16 | 86130 | 542.91 | 787 | 762 | 157.2 |
| B | 5 | 255 | 75725 | 476.74 | 787 | 762 | 157.2 |
| C | 14 | 254 | 116322 | 617.86 | 783 | 788 | 187.0 |
| C | 1 | 3 | 15288 | 77.54 | 783 | 788 | 187.0 |
| C | 12 | 249 | 13086 | 65.77 | 783 | 788 | 187.0 |
| D | 13 | 249 | 816431 | 4173.08 | 774 | 747 | 195.5 |
| D | 11 | 241 | 614838 | 3141.72 | 774 | 747 | 195.5 |
| D | 13 | 171 | 94793 | 481.14 | 774 | 747 | 195.5 |
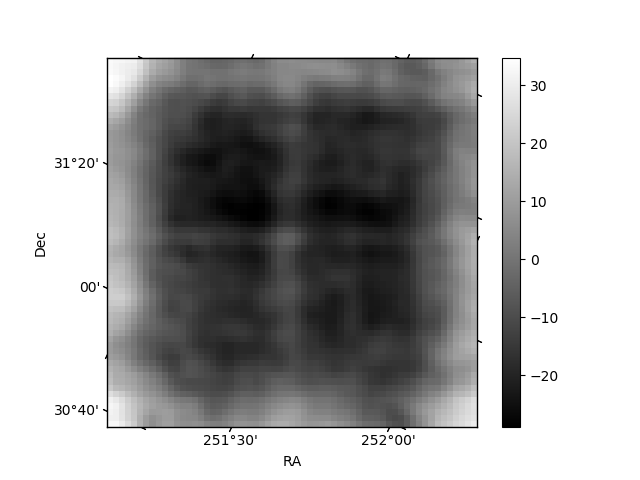
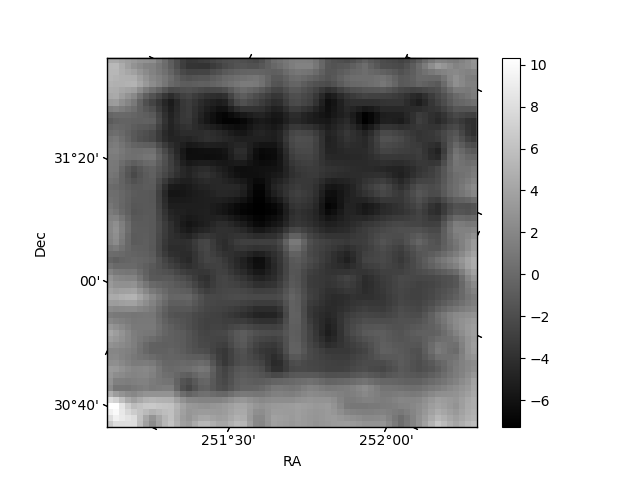
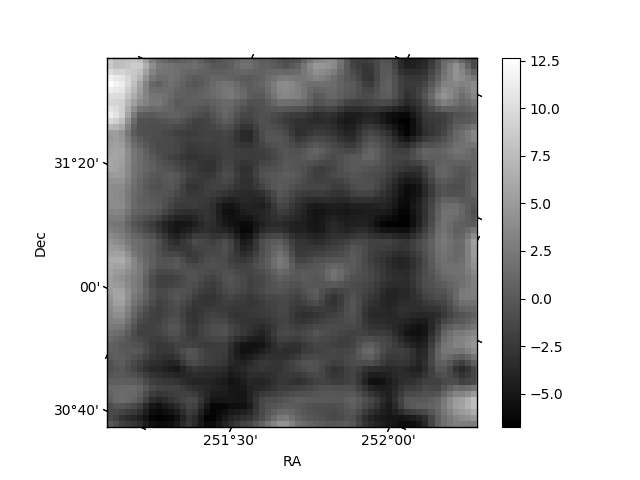
Histogram calculated using DETX and DETY for each event in the final _common_clean file
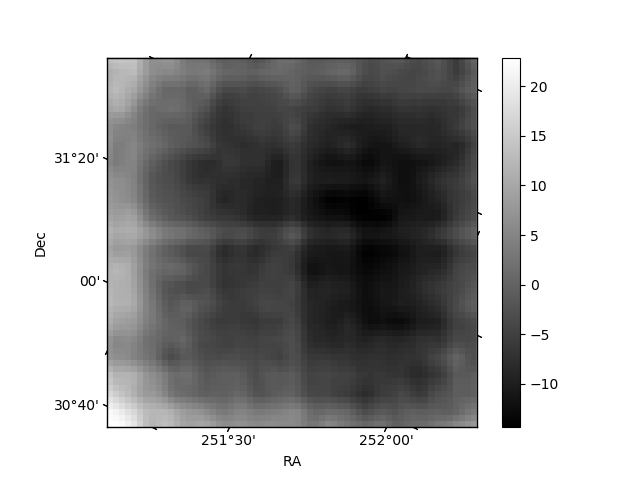
| Quadrant A | 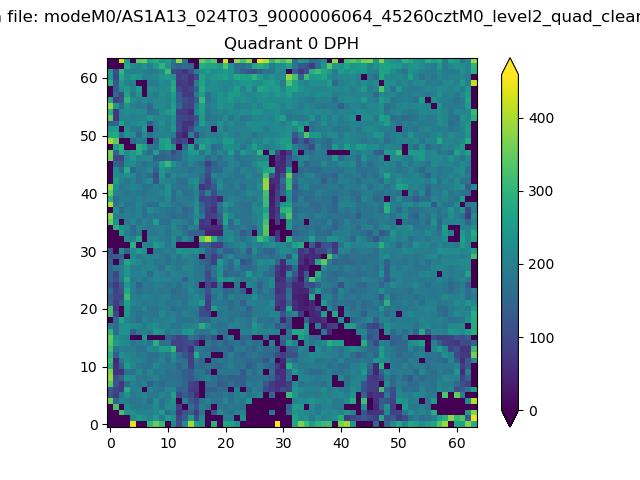 |
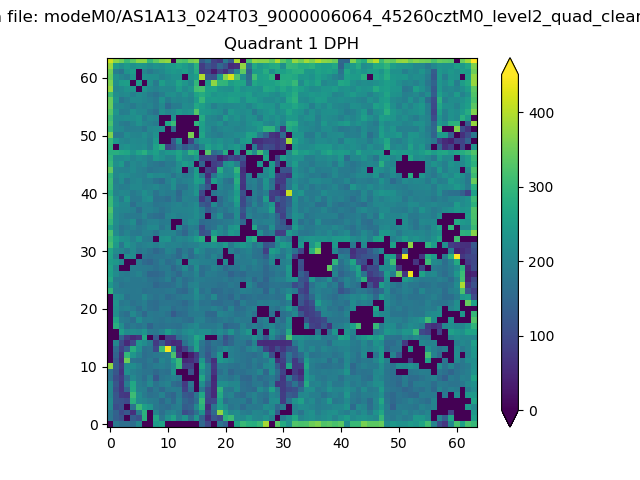 |
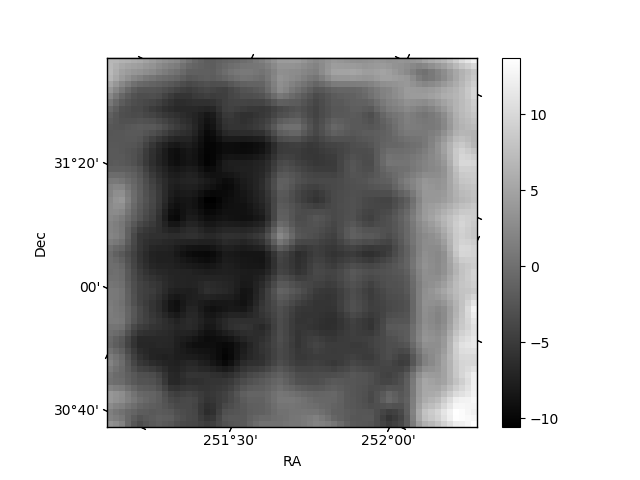
Quadrant B |
|---|---|---|---|
| Quadrant D | 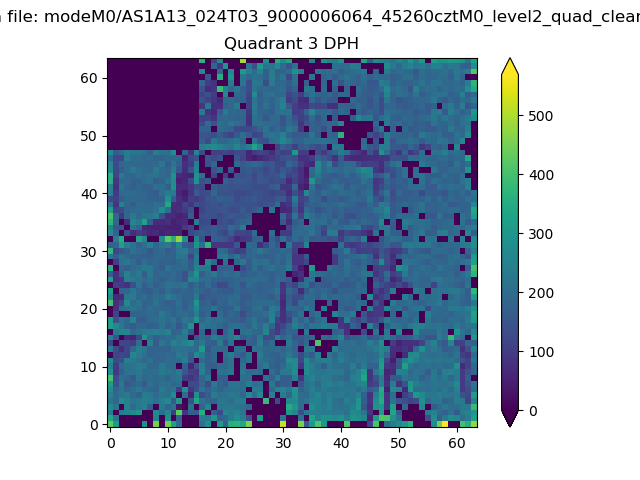 |
 |
Quadrant C |
| Plot type | Count rate plots | Images |
|---|---|---|
| Comparison with Poisson distribution Blue bars denote a histogram of data divided into 1 sec bins. Red curve is a Poisson curve with rate = median count rate of data. |
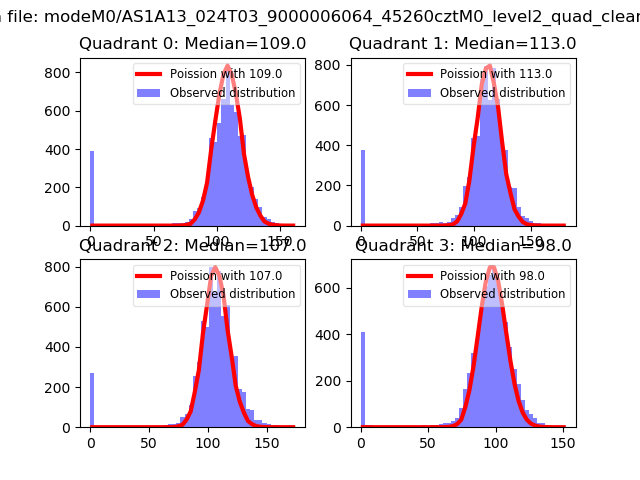 |
 |
| Quadrant-wise count rates Data is divided into 100 sec bins |
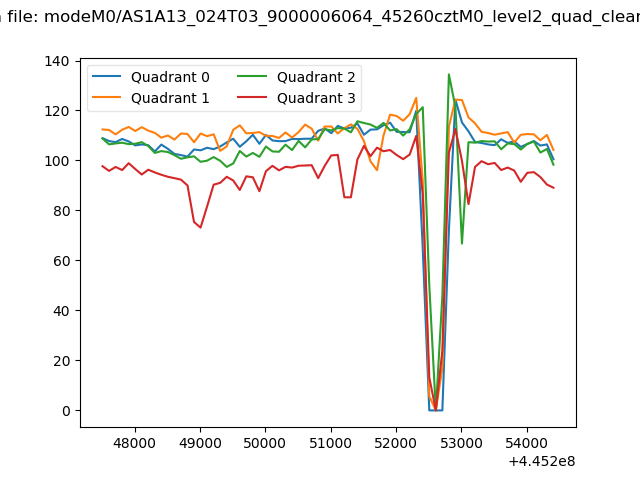 |
|
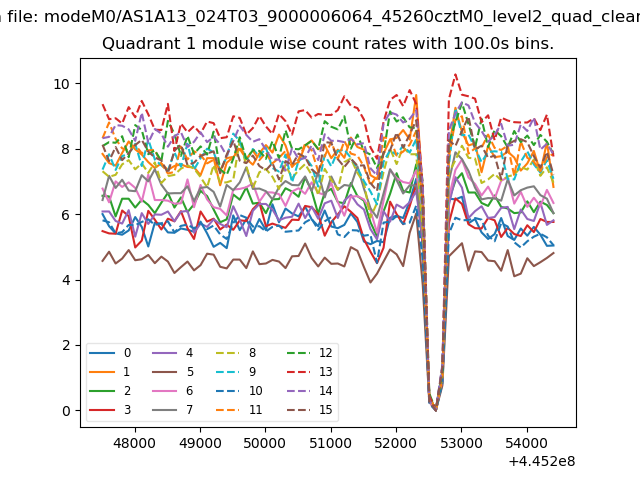
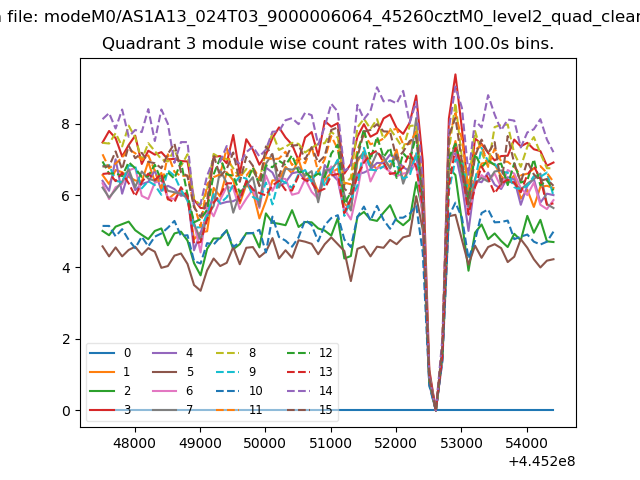
| Module-wise count rates for Quadrant A Data is divided into 100 sec bins |
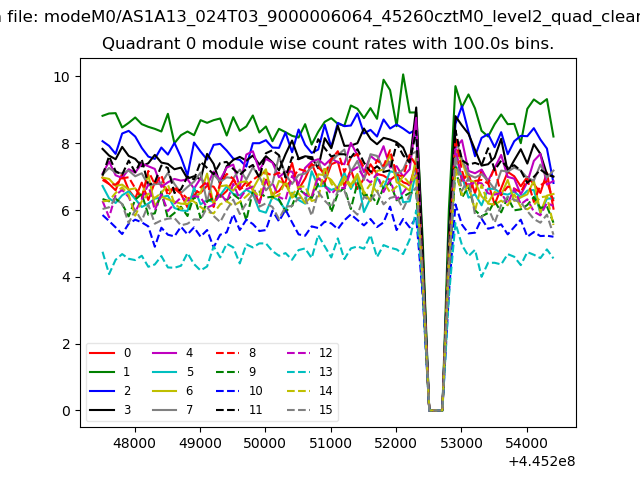 |
 |
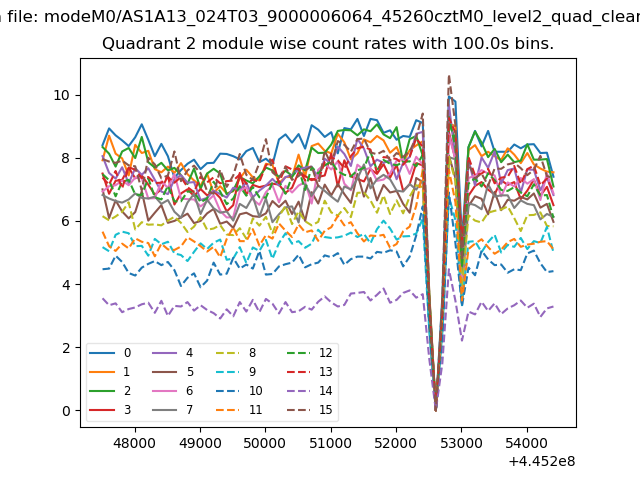
| Module-wise count rates for Quadrant B Data is divided into 100 sec bins |
 |
 |
| Module-wise count rates for Quadrant C Data is divided into 100 sec bins |
 |
 |
| Module-wise count rates for Quadrant D Data is divided into 100 sec bins |
 |
 |
| Parameter | Plot |
|---|---|
| CZT HV Monitor | 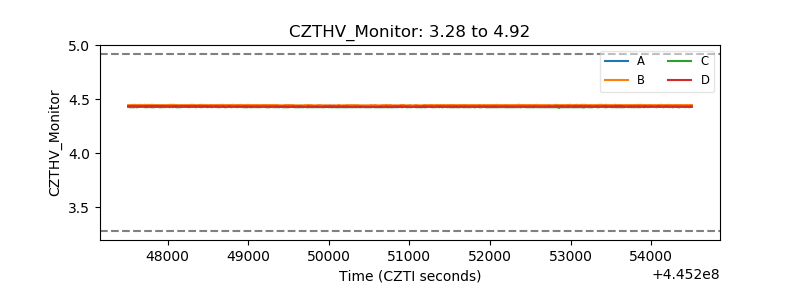 |
| D_VDD | 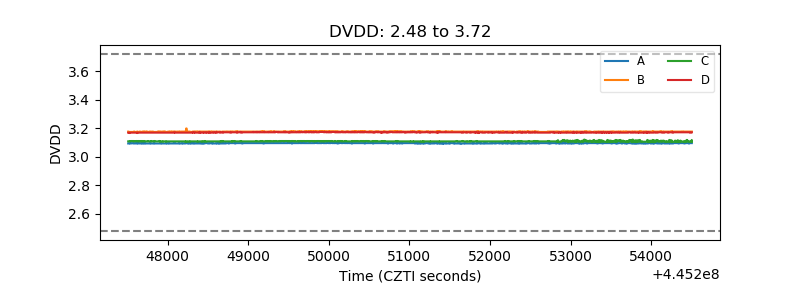 |
| Temperature 1 | 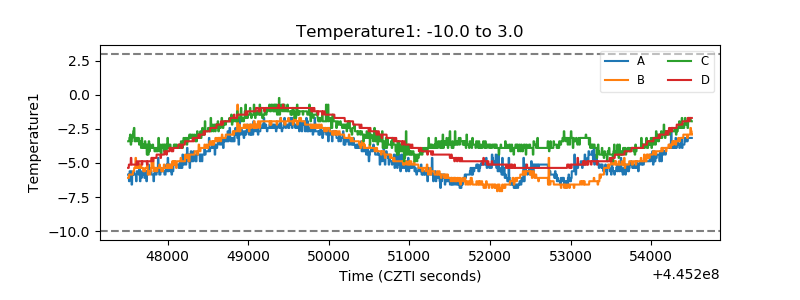 |
| Veto HV Monitor | 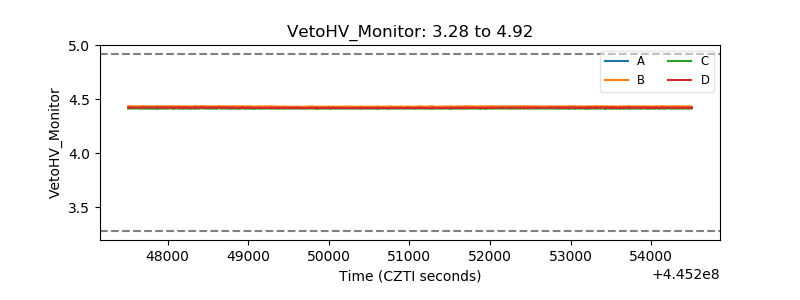 |
| Veto LLD | 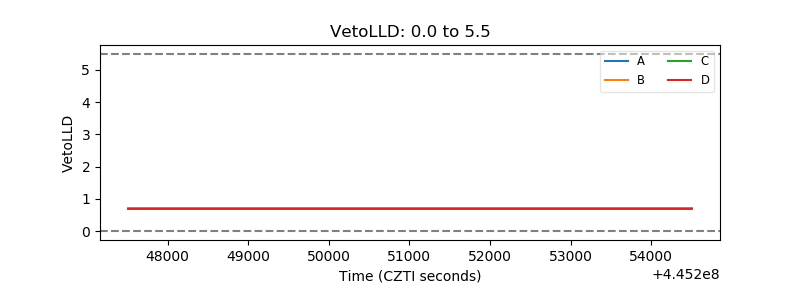 |
| Alpha Counter | 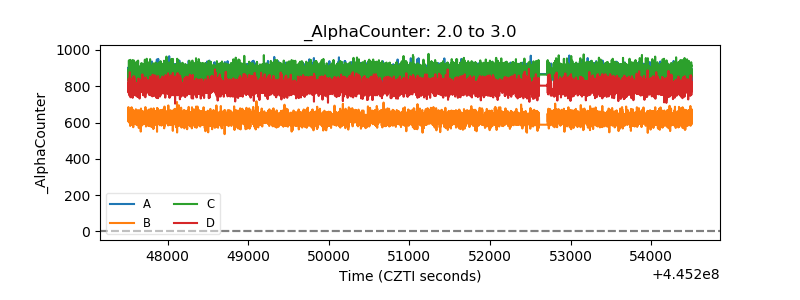 |
| _CPM_Rate | 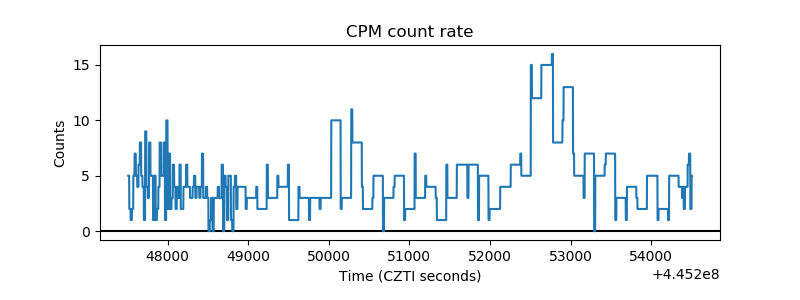 |
| CZT Counter | 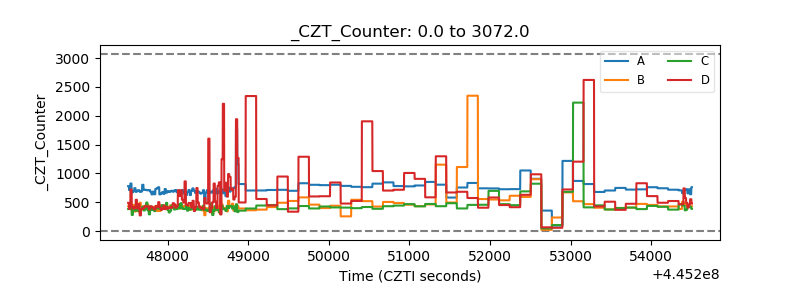 |
| +2.5 Volts monitor | 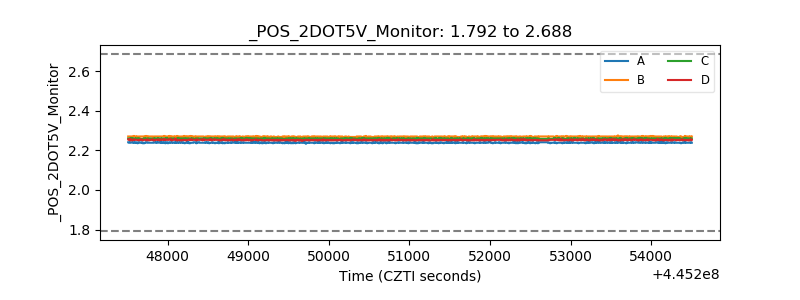 |
| +5 Volts monitor | 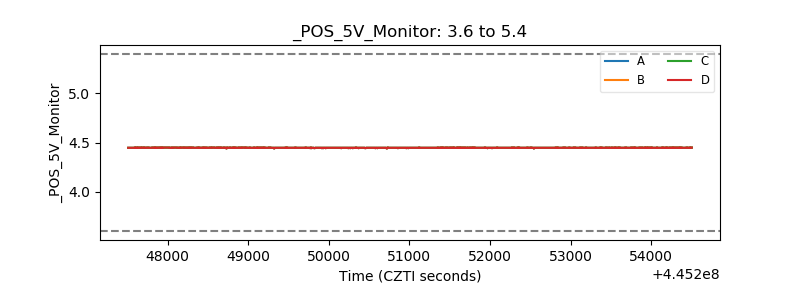 |
| _ROLL_ROT | 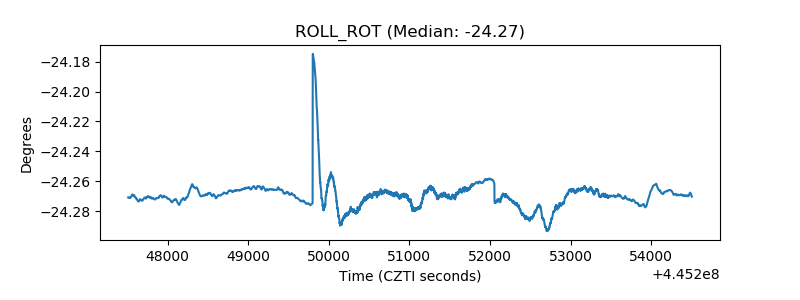 |
| _Roll_DEC | 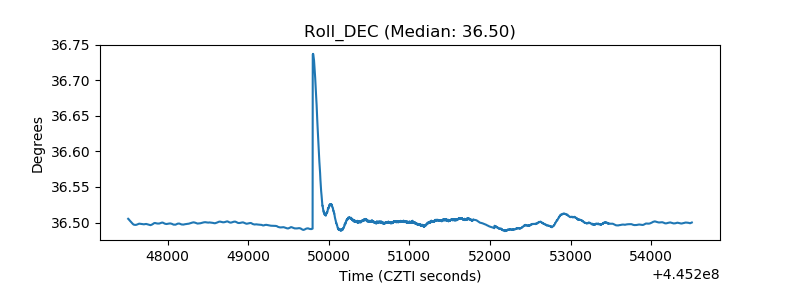 |
| _Roll_RA | 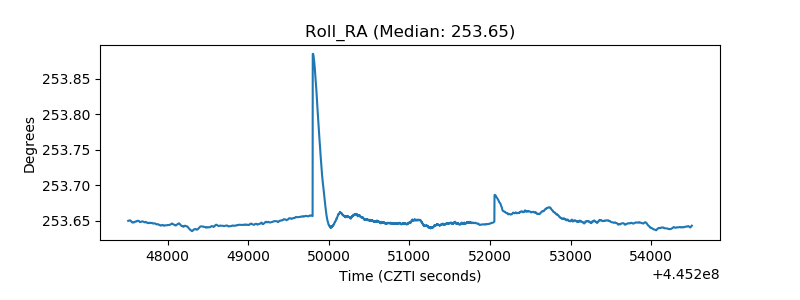 |
| Veto Counter | 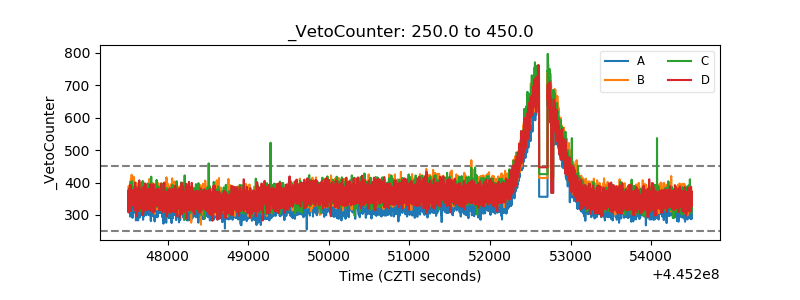 |