| Param | Original file | Final file |
|---|---|---|
| Filename | modeM0/AS1A13_024T03_9000006064_45261cztM0_level2.fits | modeM0/AS1A13_024T03_9000006064_45261cztM0_level2_quad_clean.evt |
| Size (bytes) | 535,587,840 | 119,940,480 |
| Size | 510.8 MB | 114.4 MB |
| Events in quadrant A | 5,874,601 | 801,091 |
| Events in quadrant B | 3,682,652 | 827,812 |
| Events in quadrant C | 3,507,206 | 788,343 |
| Events in quadrant D | 6,185,982 | 697,452 |
| Mode M0 | |||
|---|---|---|---|
| Quadrant | BADHDUFLAG | Total packets | Discarded packets |
| A | 0 | 22609 | 0 |
| B | 0 | 16059 | 0 |
| C | 0 | 15885 | 1 |
| D | 0 | 23631 | 0 |
| Mode SS | |||
|---|---|---|---|
| Quadrant | BADHDUFLAG | Total packets | Discarded packets |
| A | 0 | 150 | 0 |
| B | 0 | 150 | 0 |
| C | 0 | 150 | 0 |
| D | 0 | 150 | 0 |
| Quadrant | Total seconds | Saturated seconds | Saturation percentage |
|---|---|---|---|
| A | 7421 | 59 | 0.795041% |
| B | 7421 | 77 | 1.037596% |
| C | 7420 | 27 | 0.363881% |
| D | 7421 | 361 | 4.864574% |
Noise dominated data is calculated using 1-second bins in cleaned event files. If a bin has >2000 counts, and if more than 50% of those come from <1% of pixels, then it is considered to be noise-dominated and hence unusable.
| Quadrant | # 1 sec bins | Bins with >0 counts | Bins with >2000 counts | High rate bins dominated by noise | Noise dominated (total time) | Noise dominated (detector-on time) | Marked lightcurve |
|---|---|---|---|---|---|---|---|
| A | 7421 | 7421 | 21 | 21 | 0.28% | 0.28% | 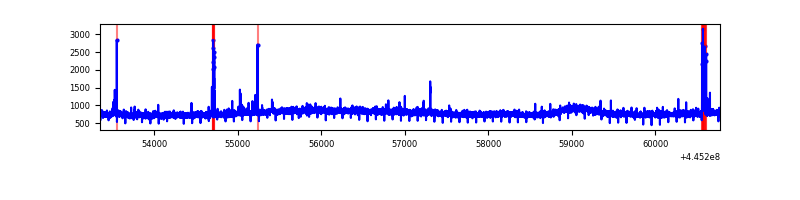 |
| B | 7421 | 7421 | 35 | 35 | 0.47% | 0.47% | 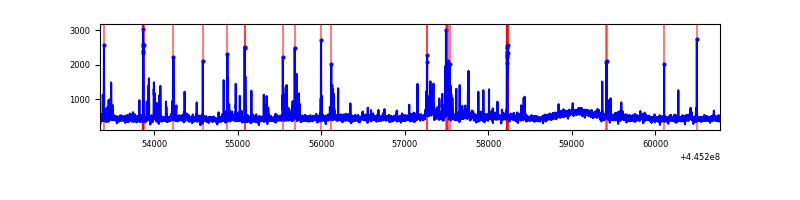 |
| C | 7420 | 7420 | 16 | 16 | 0.22% | 0.22% | 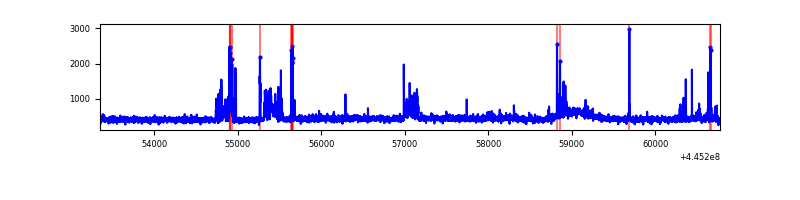 |
| D | 7421 | 7421 | 344 | 344 | 4.64% | 4.64% | 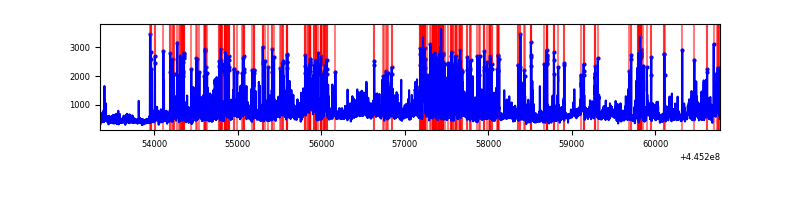 |
Top three noisy pixels from each quadrant. If the there are fewer than three noisy pixels in the level2.evt file, extra rows are filled as -1
| Pixel properties | Quadrant properties | ||||||
|---|---|---|---|---|---|---|---|
| Quadrant | DetID | PixID | Counts | Sigma | Mean | Median | Sigma |
| A | 10 | 83 | 2549343 | 14684.38 | 828 | 809 | 173.6 |
| A | 13 | 248 | 75340 | 429.44 | 828 | 809 | 173.6 |
| A | 0 | 243 | 18671 | 102.92 | 828 | 809 | 173.6 |
| B | 12 | 3 | 144622 | 889.06 | 824 | 798 | 161.8 |
| B | 12 | 16 | 104573 | 641.49 | 824 | 798 | 161.8 |
| B | 5 | 32 | 43157 | 261.84 | 824 | 798 | 161.8 |
| C | 14 | 254 | 292925 | 1514.07 | 810 | 813 | 192.9 |
| C | 2 | 14 | 34193 | 173.01 | 810 | 813 | 192.9 |
| C | 3 | 233 | 16351 | 80.54 | 810 | 813 | 192.9 |
| D | 13 | 249 | 1155721 | 5800.03 | 792 | 766 | 199.1 |
| D | 11 | 241 | 1002659 | 5031.38 | 792 | 766 | 199.1 |
| D | 5 | 235 | 249595 | 1249.59 | 792 | 766 | 199.1 |
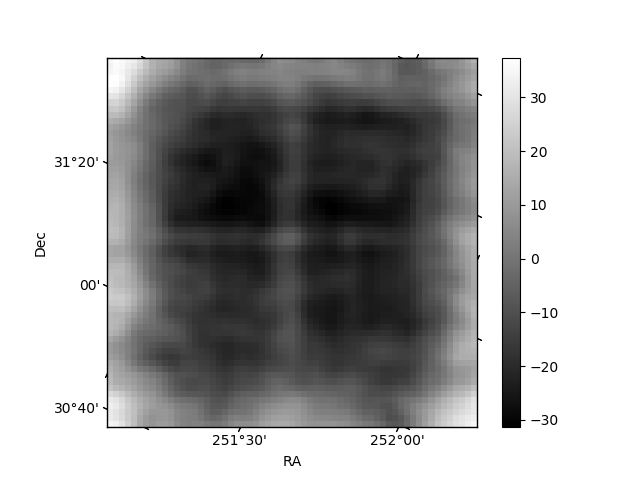
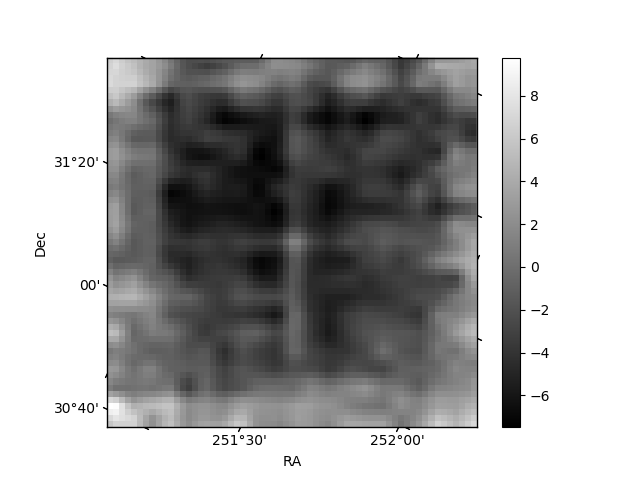
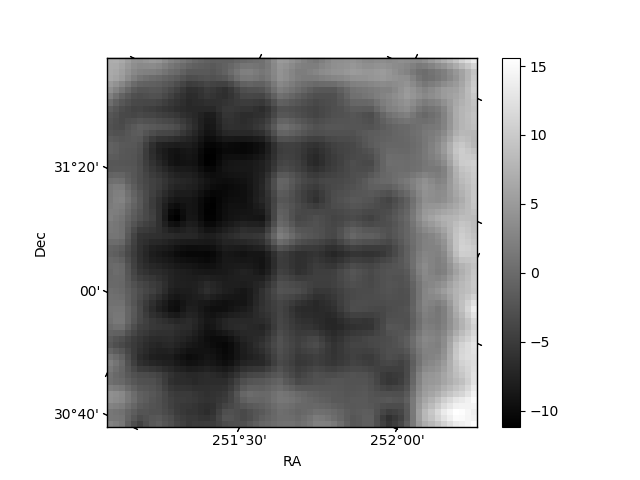
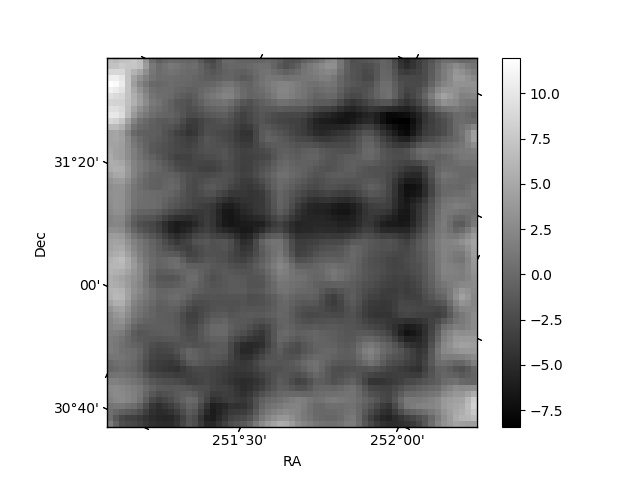
Histogram calculated using DETX and DETY for each event in the final _common_clean file
| Quadrant A | 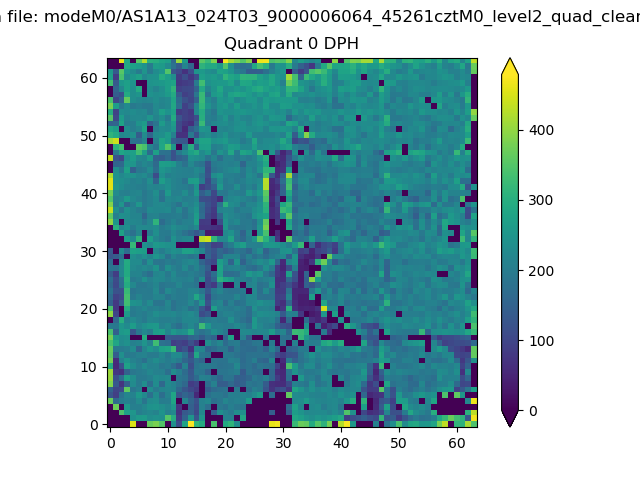 |
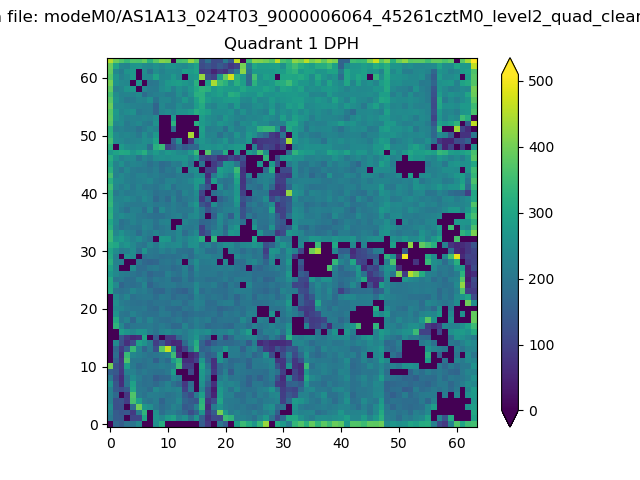 |
Quadrant B |
|---|---|---|---|
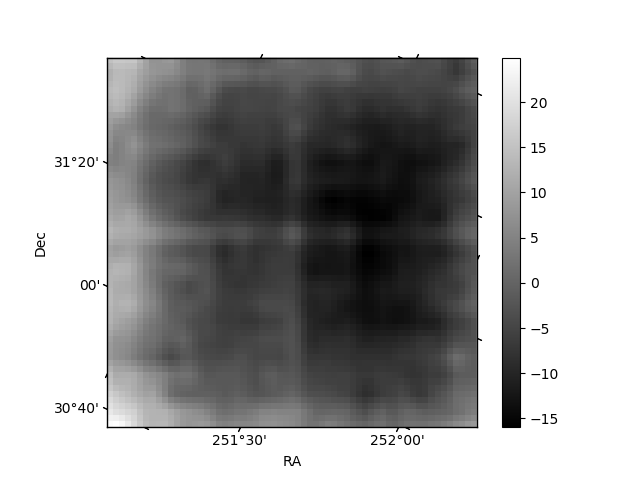
| Quadrant D | 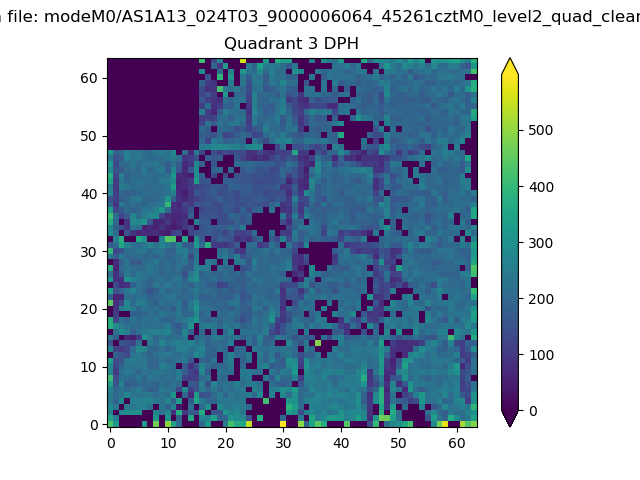 |
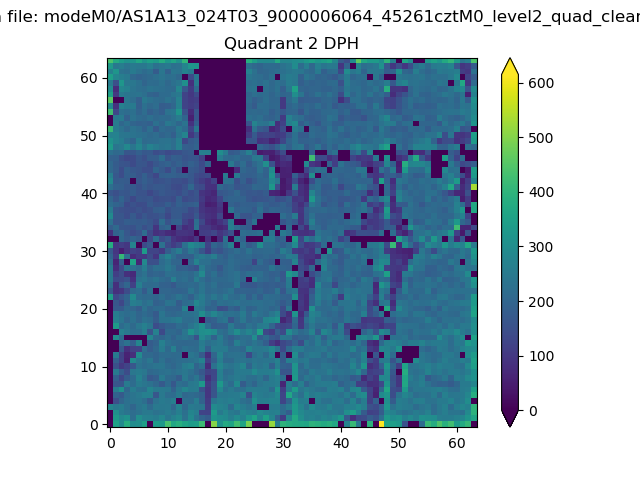 |
Quadrant C |
| Plot type | Count rate plots | Images |
|---|---|---|
| Comparison with Poisson distribution Blue bars denote a histogram of data divided into 1 sec bins. Red curve is a Poisson curve with rate = median count rate of data. |
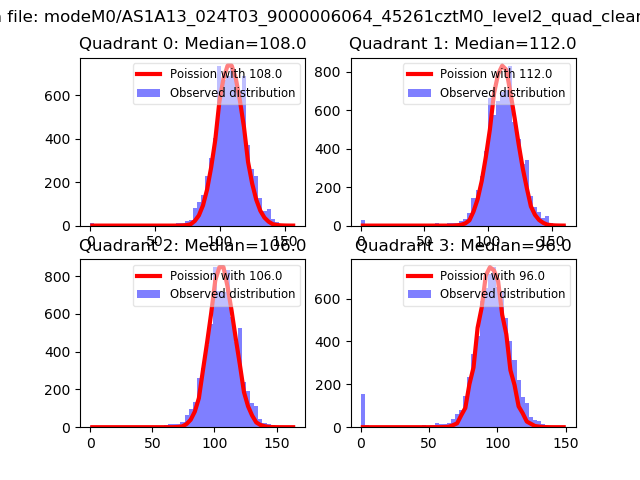 |
 |
| Quadrant-wise count rates Data is divided into 100 sec bins |
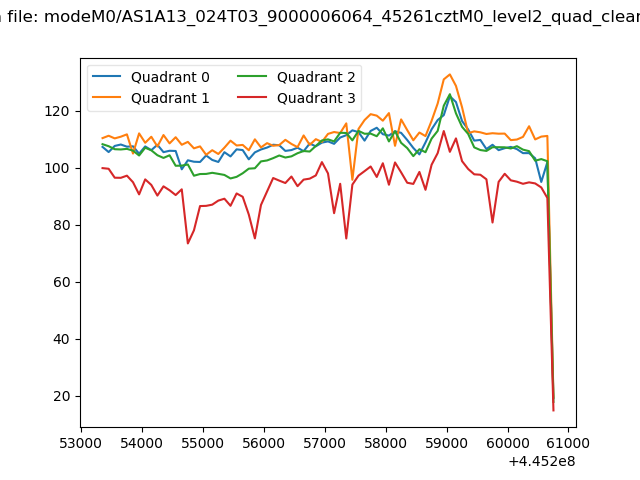 |
|
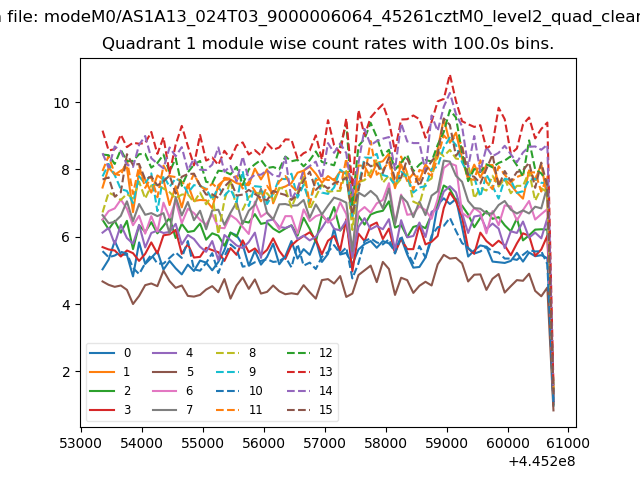
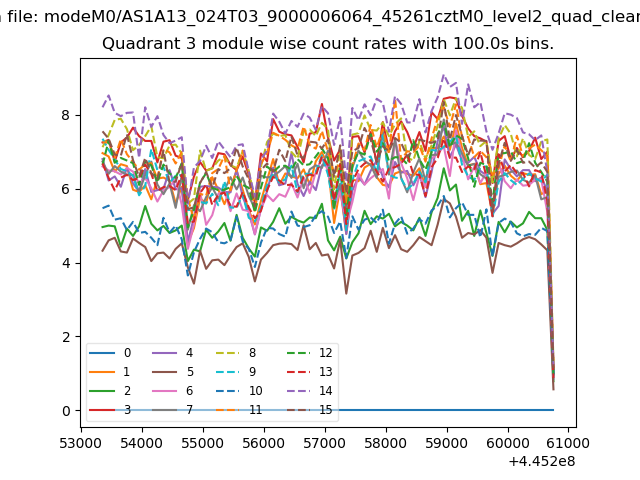
| Module-wise count rates for Quadrant A Data is divided into 100 sec bins |
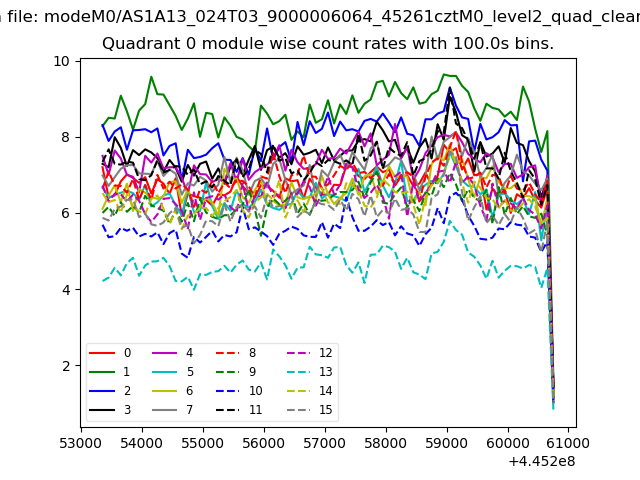 |
 |
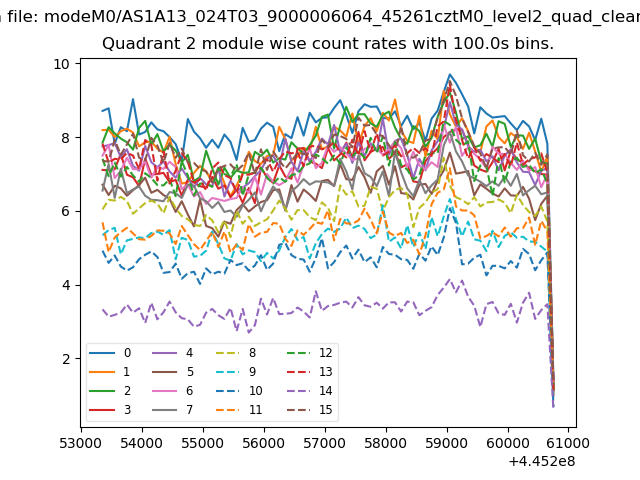
| Module-wise count rates for Quadrant B Data is divided into 100 sec bins |
 |
 |
| Module-wise count rates for Quadrant C Data is divided into 100 sec bins |
 |
 |
| Module-wise count rates for Quadrant D Data is divided into 100 sec bins |
 |
 |
| Parameter | Plot |
|---|---|
| CZT HV Monitor | 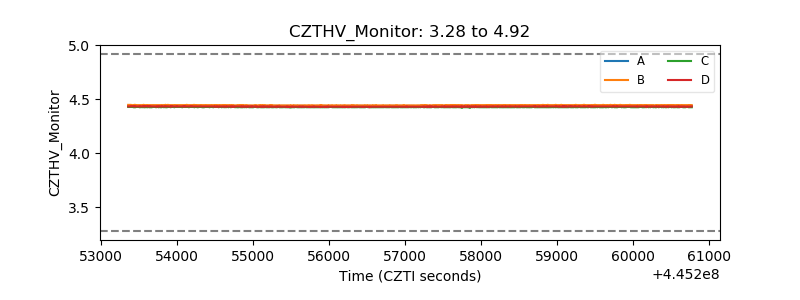 |
| D_VDD | 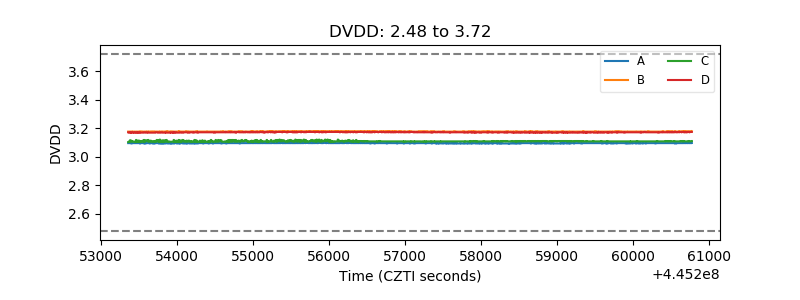 |
| Temperature 1 | 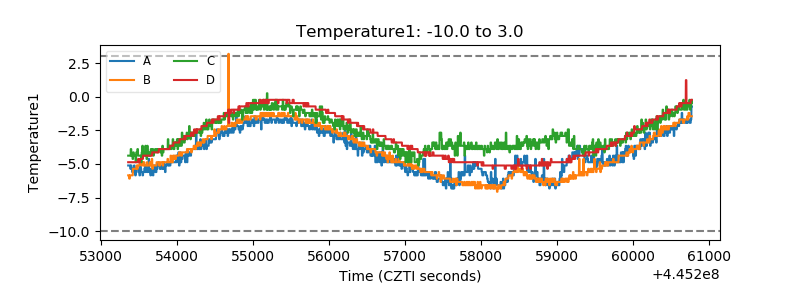 |
| Veto HV Monitor | 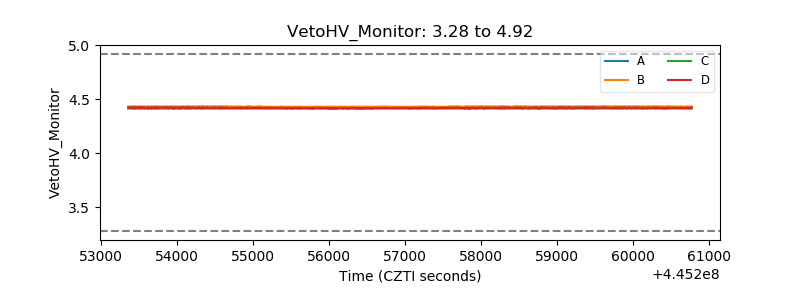 |
| Veto LLD | 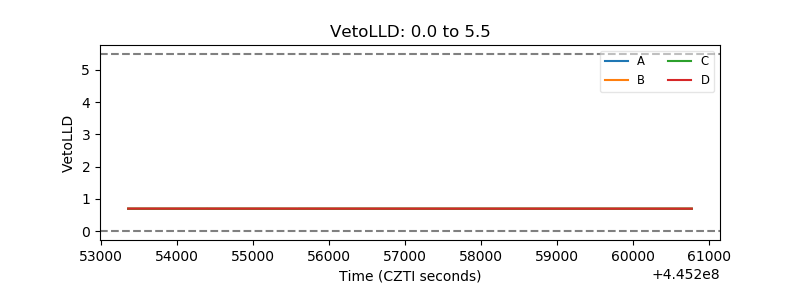 |
| Alpha Counter | 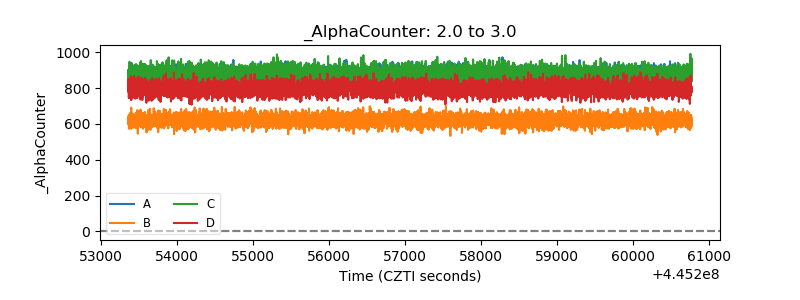 |
| _CPM_Rate | 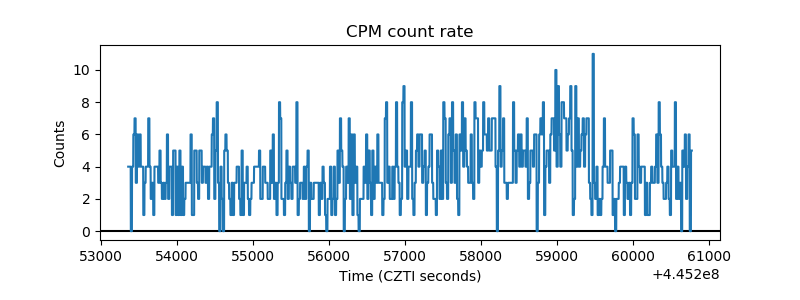 |
| CZT Counter | 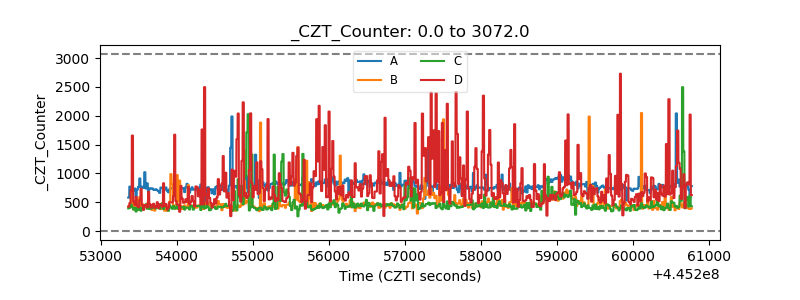 |
| +2.5 Volts monitor | 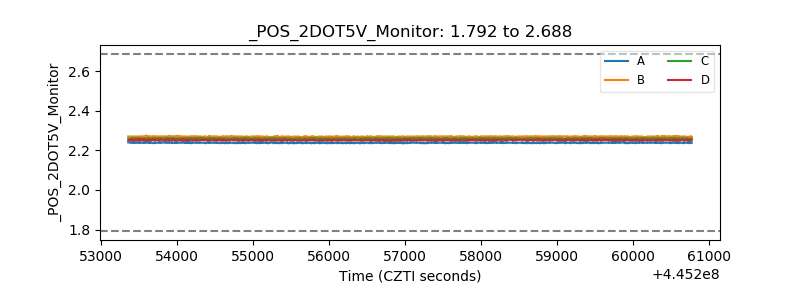 |
| +5 Volts monitor | 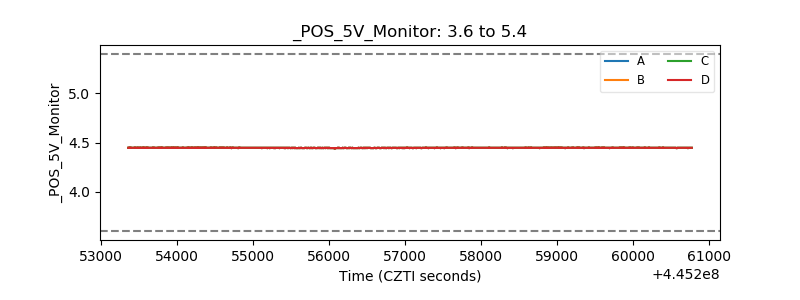 |
| _ROLL_ROT | 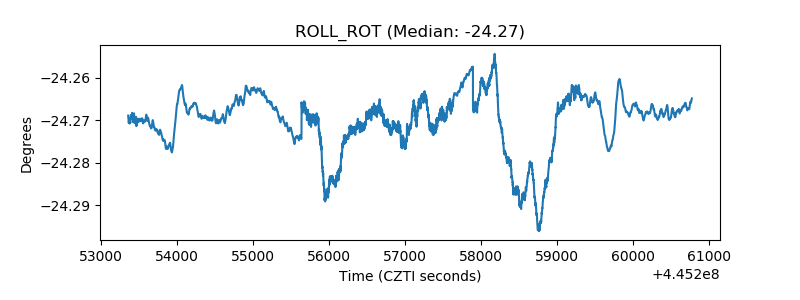 |
| _Roll_DEC | 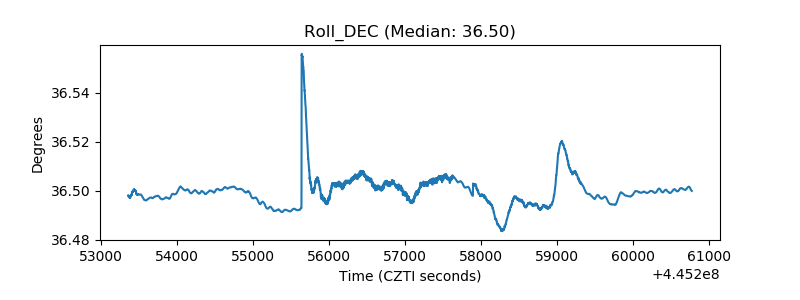 |
| _Roll_RA | 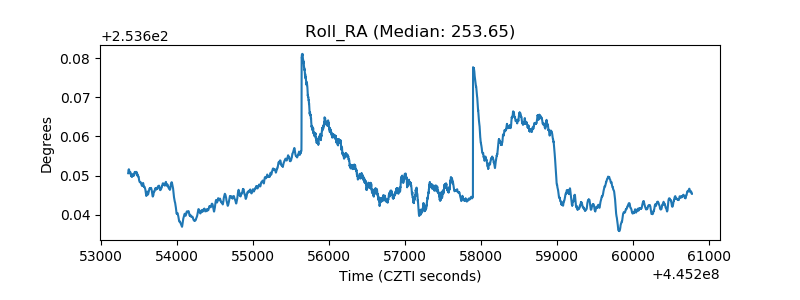 |
| Veto Counter | 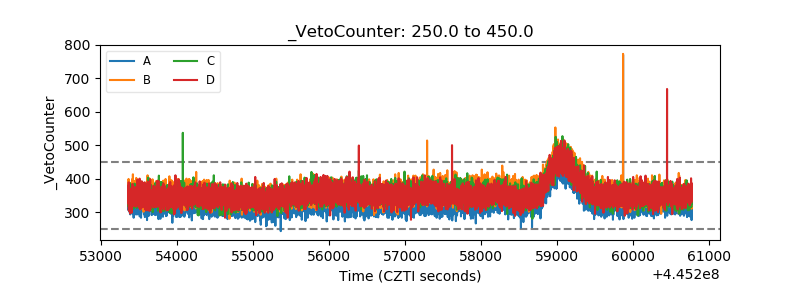 |