| Param | Original file | Final file |
|---|---|---|
| Filename | modeM0/AS1A13_024T03_9000006064_45262cztM0_level2.fits | modeM0/AS1A13_024T03_9000006064_45262cztM0_level2_quad_clean.evt |
| Size (bytes) | 507,193,920 | 114,577,920 |
| Size | 483.7 MB | 109.3 MB |
| Events in quadrant A | 5,847,384 | 764,249 |
| Events in quadrant B | 3,493,511 | 794,788 |
| Events in quadrant C | 3,214,200 | 750,790 |
| Events in quadrant D | 5,666,295 | 662,669 |
| Mode M0 | |||
|---|---|---|---|
| Quadrant | BADHDUFLAG | Total packets | Discarded packets |
| A | 0 | 22186 | 0 |
| B | 0 | 15314 | 0 |
| C | 0 | 14748 | 0 |
| D | 0 | 21757 | 14 |
| Mode SS | |||
|---|---|---|---|
| Quadrant | BADHDUFLAG | Total packets | Discarded packets |
| A | 0 | 142 | 0 |
| B | 0 | 142 | 0 |
| C | 0 | 142 | 0 |
| D | 0 | 142 | 0 |
| Quadrant | Total seconds | Saturated seconds | Saturation percentage |
|---|---|---|---|
| A | 7135 | 70 | 0.981079% |
| B | 7135 | 57 | 0.798879% |
| C | 7136 | 9 | 0.126121% |
| D | 7132 | 326 | 4.570948% |
Noise dominated data is calculated using 1-second bins in cleaned event files. If a bin has >2000 counts, and if more than 50% of those come from <1% of pixels, then it is considered to be noise-dominated and hence unusable.
| Quadrant | # 1 sec bins | Bins with >0 counts | Bins with >2000 counts | High rate bins dominated by noise | Noise dominated (total time) | Noise dominated (detector-on time) | Marked lightcurve |
|---|---|---|---|---|---|---|---|
| A | 7135 | 7135 | 31 | 31 | 0.43% | 0.43% | 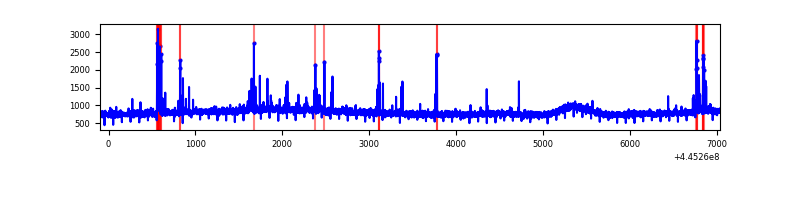 |
| B | 7135 | 7135 | 20 | 20 | 0.28% | 0.28% | 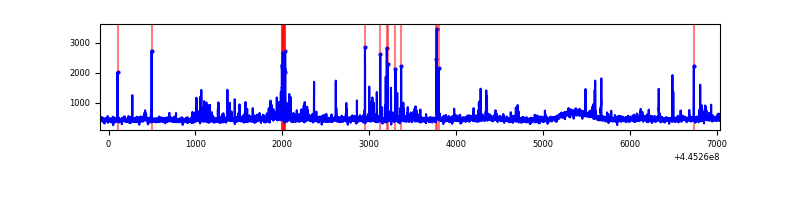 |
| C | 7136 | 7136 | 4 | 4 | 0.06% | 0.06% | 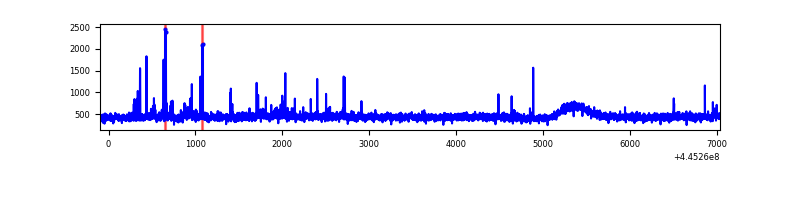 |
| D | 7135 | 7133 | 331 | 331 | 4.64% | 4.64% | 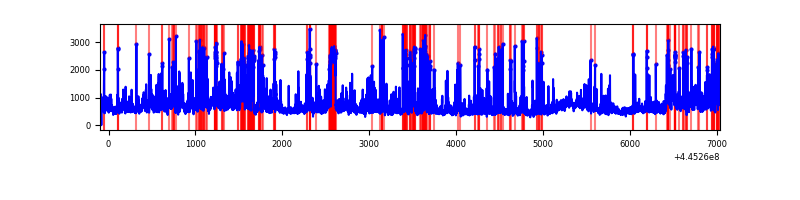 |
Top three noisy pixels from each quadrant. If the there are fewer than three noisy pixels in the level2.evt file, extra rows are filled as -1
| Pixel properties | Quadrant properties | ||||||
|---|---|---|---|---|---|---|---|
| Quadrant | DetID | PixID | Counts | Sigma | Mean | Median | Sigma |
| A | 10 | 83 | 2536759 | 14963.56 | 803 | 786 | 169.5 |
| A | 13 | 248 | 152496 | 895.17 | 803 | 786 | 169.5 |
| A | 0 | 243 | 18262 | 103.12 | 803 | 786 | 169.5 |
| B | 12 | 16 | 90237 | 564.63 | 800 | 772 | 158.4 |
| B | 4 | 170 | 59773 | 372.37 | 800 | 772 | 158.4 |
| B | 15 | 54 | 44004 | 272.84 | 800 | 772 | 158.4 |
| C | 3 | 233 | 56013 | 296.5 | 785 | 788 | 186.3 |
| C | 14 | 254 | 37016 | 194.51 | 785 | 788 | 186.3 |
| C | 2 | 14 | 23879 | 123.97 | 785 | 788 | 186.3 |
| D | 13 | 249 | 894847 | 4646.15 | 768 | 742 | 192.4 |
| D | 11 | 241 | 671319 | 3484.6 | 768 | 742 | 192.4 |
| D | 12 | 233 | 283489 | 1469.27 | 768 | 742 | 192.4 |
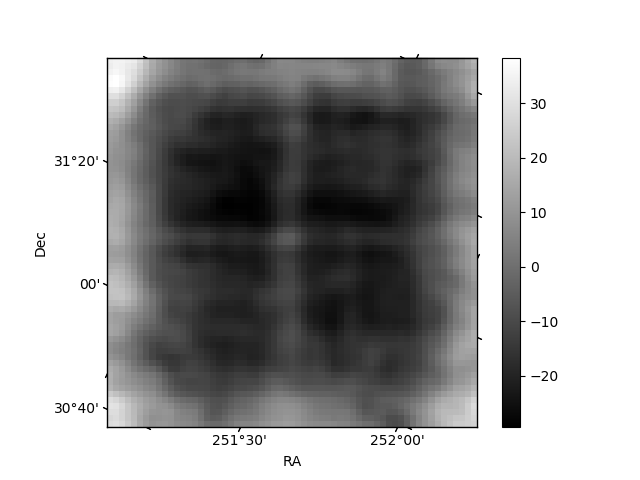
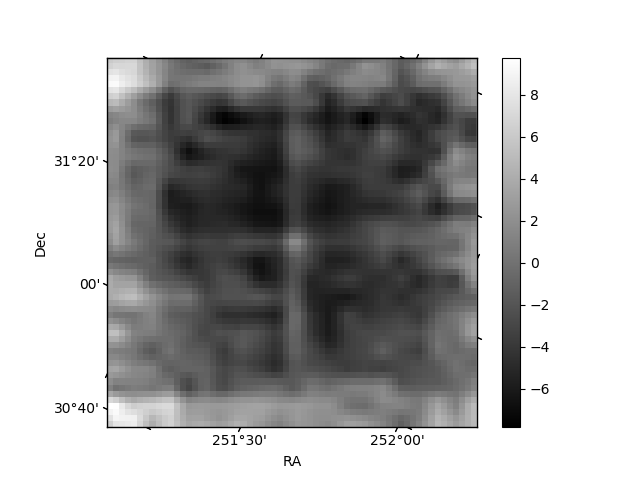
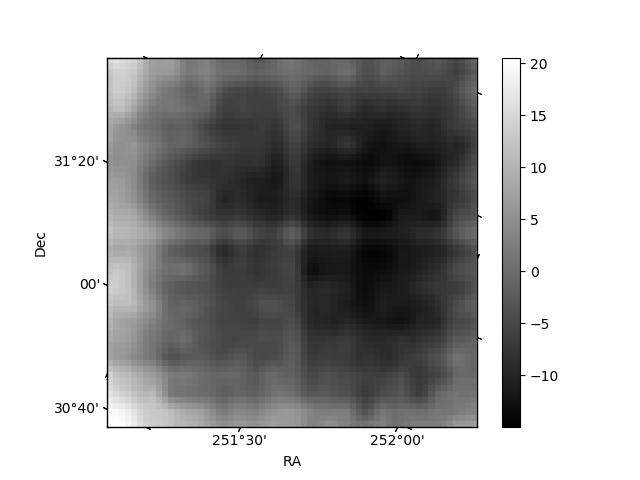
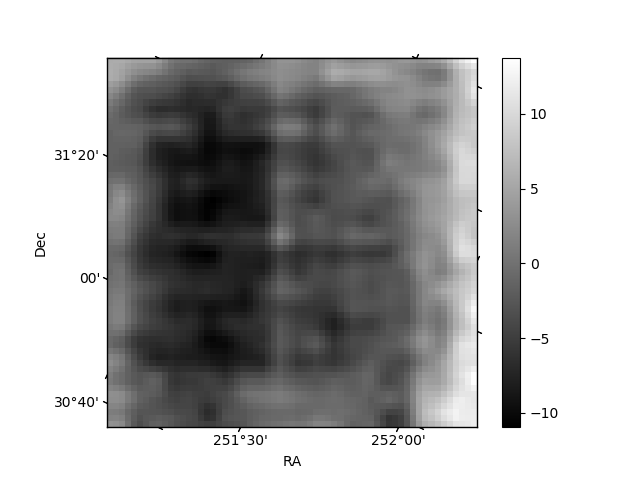
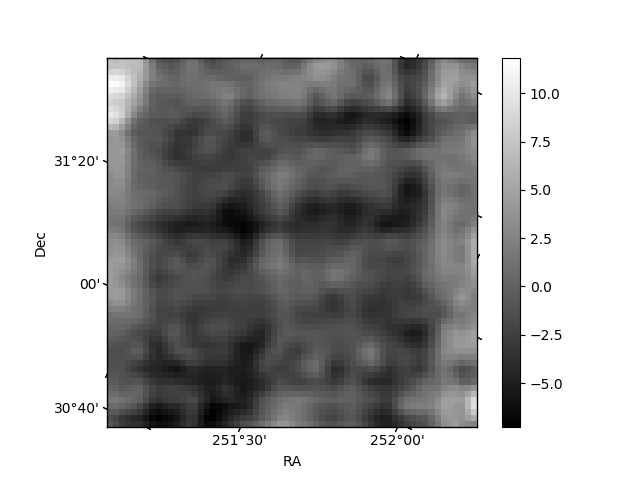
Histogram calculated using DETX and DETY for each event in the final _common_clean file
| Quadrant A | 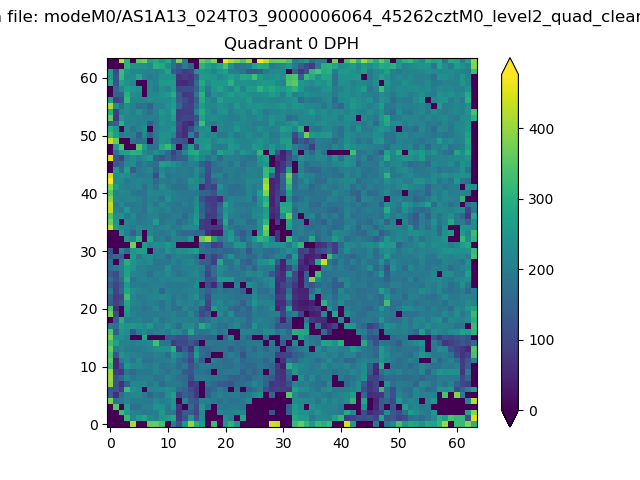 |
 |
Quadrant B |
|---|---|---|---|
| Quadrant D | 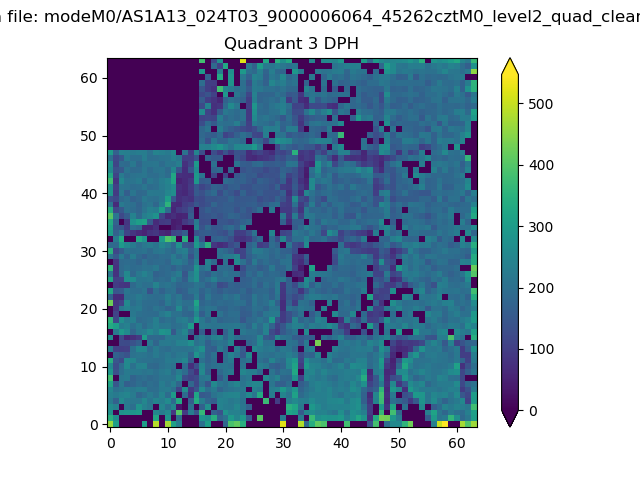 |
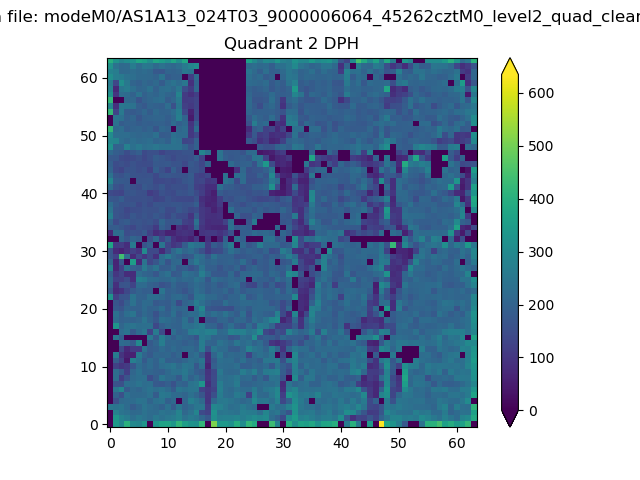 |
Quadrant C |
| Plot type | Count rate plots | Images |
|---|---|---|
| Comparison with Poisson distribution Blue bars denote a histogram of data divided into 1 sec bins. Red curve is a Poisson curve with rate = median count rate of data. |
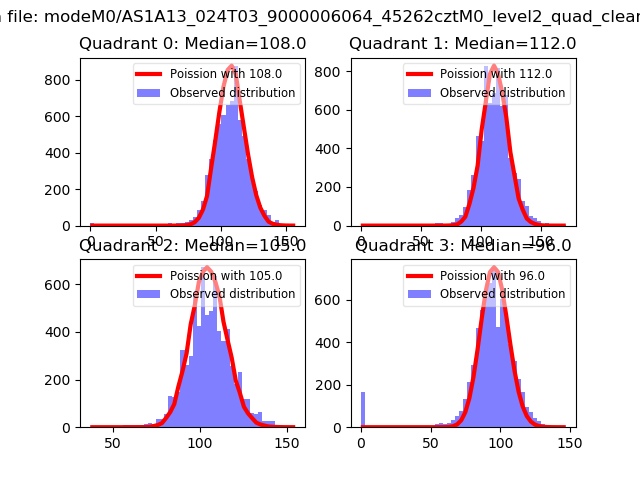 |
 |
| Quadrant-wise count rates Data is divided into 100 sec bins |
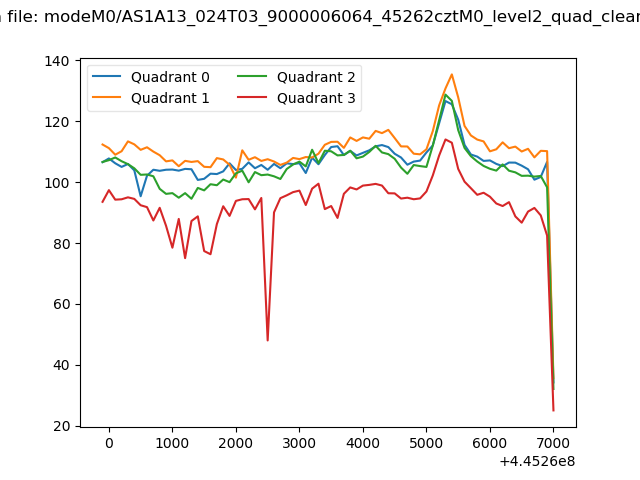 |
|
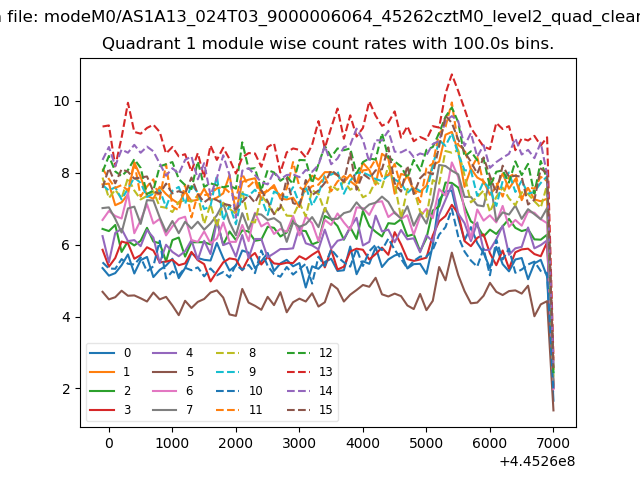
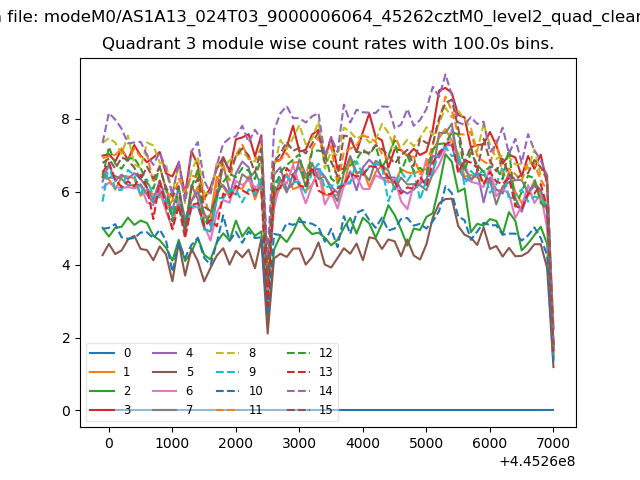
| Module-wise count rates for Quadrant A Data is divided into 100 sec bins |
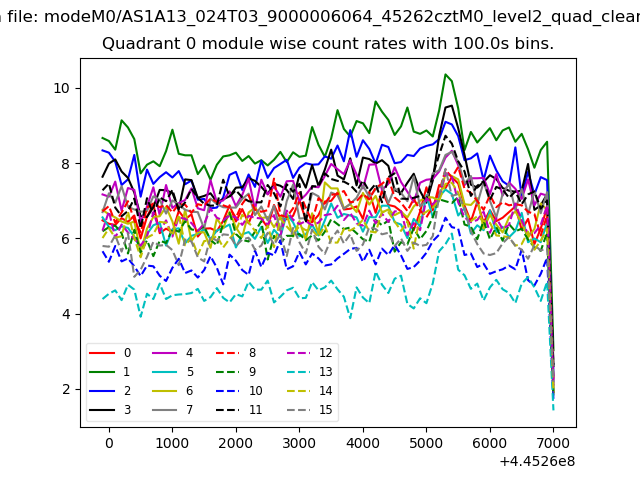 |
 |
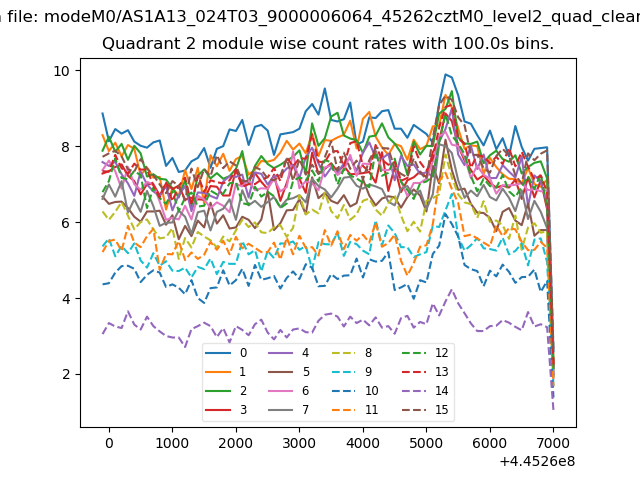
| Module-wise count rates for Quadrant B Data is divided into 100 sec bins |
 |
 |
| Module-wise count rates for Quadrant C Data is divided into 100 sec bins |
 |
 |
| Module-wise count rates for Quadrant D Data is divided into 100 sec bins |
 |
 |
| Parameter | Plot |
|---|---|
| CZT HV Monitor | 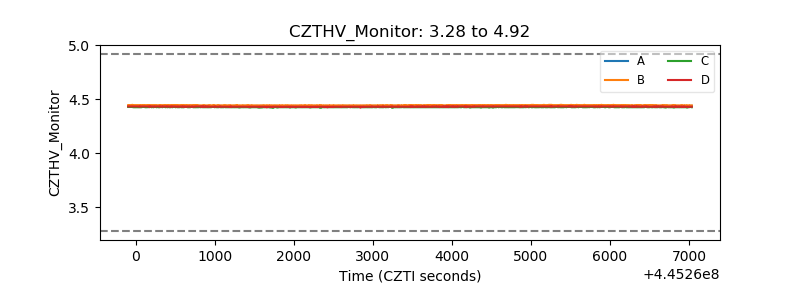 |
| D_VDD | 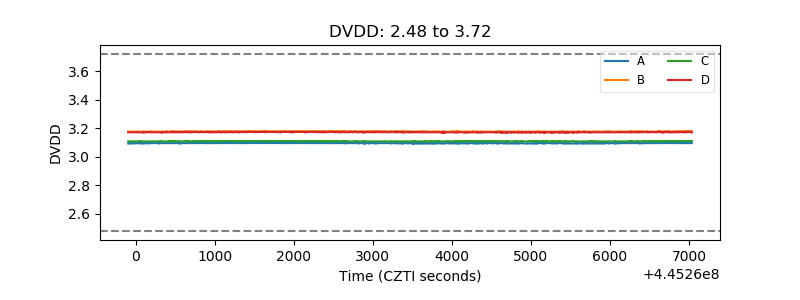 |
| Temperature 1 | 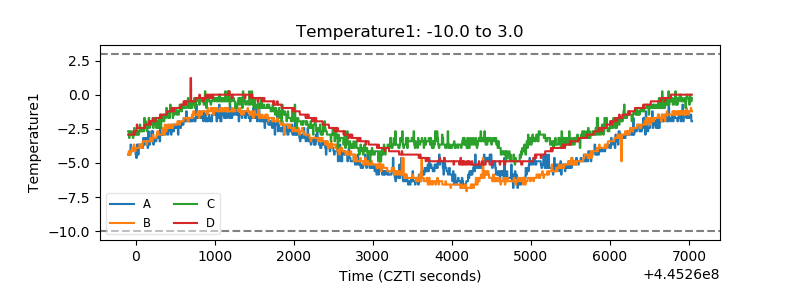 |
| Veto HV Monitor | 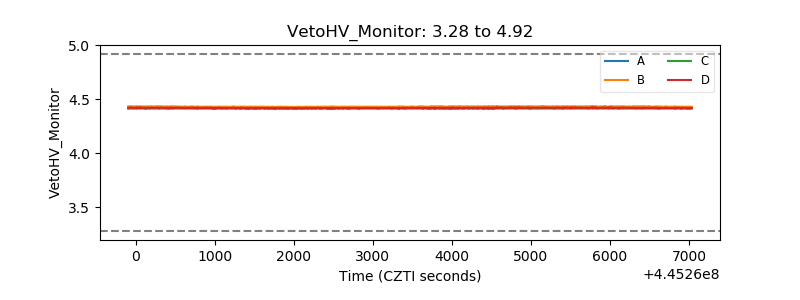 |
| Veto LLD | 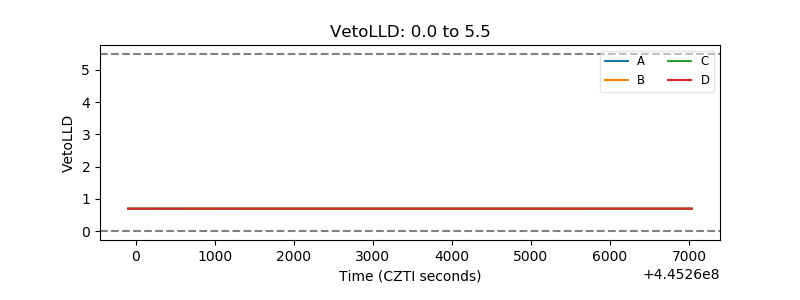 |
| Alpha Counter | 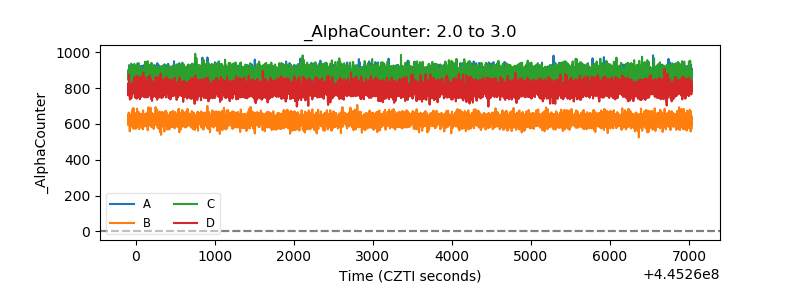 |
| _CPM_Rate | 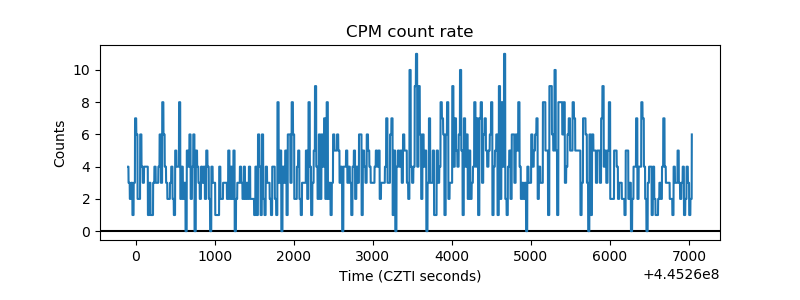 |
| CZT Counter |  |
| +2.5 Volts monitor | 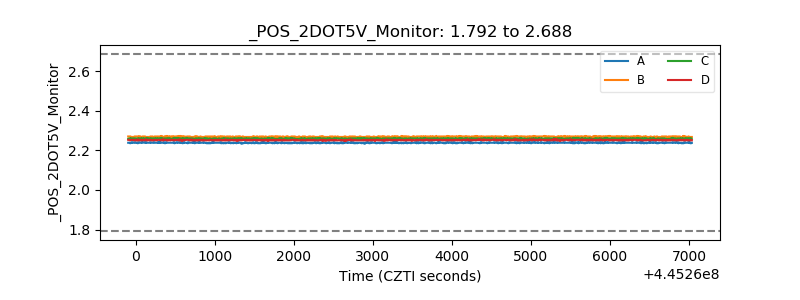 |
| +5 Volts monitor | 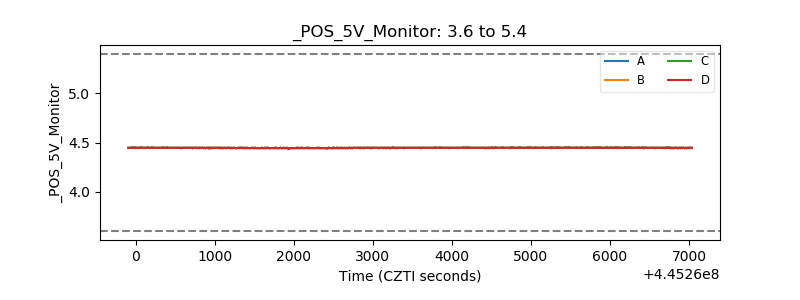 |
| _ROLL_ROT | 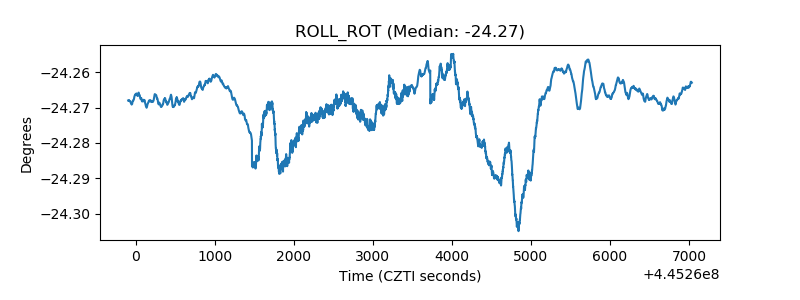 |
| _Roll_DEC | 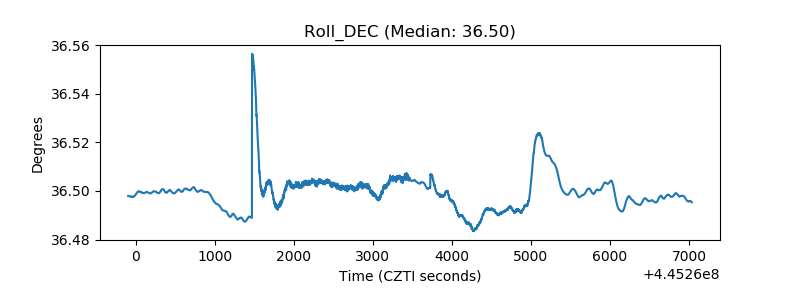 |
| _Roll_RA | 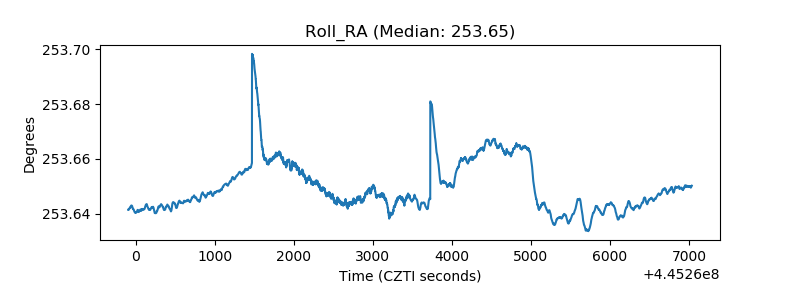 |
| Veto Counter | 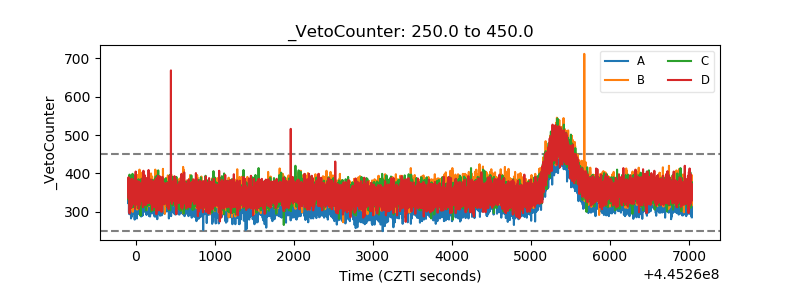 |