| Param | Original file | Final file |
|---|---|---|
| Filename | modeM0/AS1A13_024T03_9000006064_45265cztM0_level2.fits | modeM0/AS1A13_024T03_9000006064_45265cztM0_level2_quad_clean.evt |
| Size (bytes) | 1,567,969,920 | 282,366,720 |
| Size | 1.5 GB | 269.3 MB |
| Events in quadrant A | 16,270,667 | 1,888,978 |
| Events in quadrant B | 9,664,447 | 1,974,515 |
| Events in quadrant C | 9,149,291 | 1,916,205 |
| Events in quadrant D | 21,505,464 | 1,473,441 |
| Mode M0 | |||
|---|---|---|---|
| Quadrant | BADHDUFLAG | Total packets | Discarded packets |
| A | 0 | 61405 | 7 |
| B | 0 | 41435 | 3 |
| C | 0 | 40547 | 3 |
| D | 0 | 76814 | 3 |
| Mode SS | |||
|---|---|---|---|
| Quadrant | BADHDUFLAG | Total packets | Discarded packets |
| A | 0 | 380 | 0 |
| B | 0 | 380 | 0 |
| C | 0 | 380 | 0 |
| D | 0 | 380 | 0 |
| Mode M9 | |||
|---|---|---|---|
| Quadrant | BADHDUFLAG | Total packets | Discarded packets |
| A | 0 | 12 | 0 |
| B | 0 | 12 | 0 |
| C | 0 | 12 | 0 |
| D | 0 | 12 | 0 |
| Quadrant | Total seconds | Saturated seconds | Saturation percentage |
|---|---|---|---|
| A | 18790 | 957 | 5.093135% |
| B | 18793 | 659 | 3.506625% |
| C | 18793 | 453 | 2.410472% |
| D | 18793 | 3761 | 20.012771% |
Noise dominated data is calculated using 1-second bins in cleaned event files. If a bin has >2000 counts, and if more than 50% of those come from <1% of pixels, then it is considered to be noise-dominated and hence unusable.
| Quadrant | # 1 sec bins | Bins with >0 counts | Bins with >2000 counts | High rate bins dominated by noise | Noise dominated (total time) | Noise dominated (detector-on time) | Marked lightcurve |
|---|---|---|---|---|---|---|---|
| A | 19972 | 18792 | 301 | 301 | 1.51% | 1.60% | 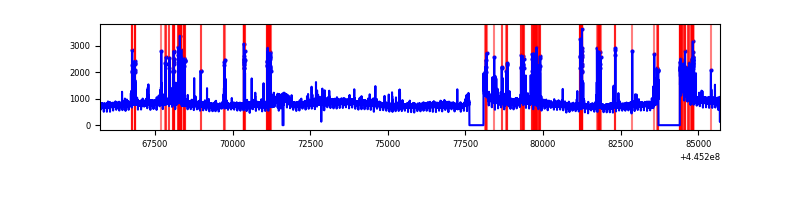 |
| B | 19973 | 18793 | 154 | 154 | 0.77% | 0.82% | 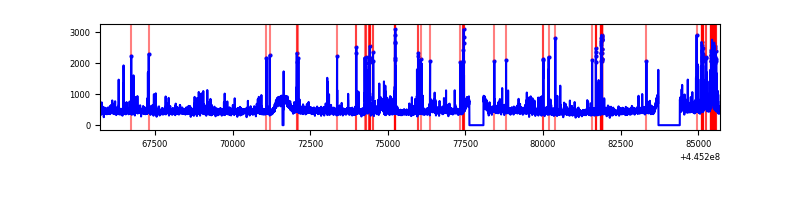 |
| C | 19973 | 18793 | 111 | 111 | 0.56% | 0.59% | 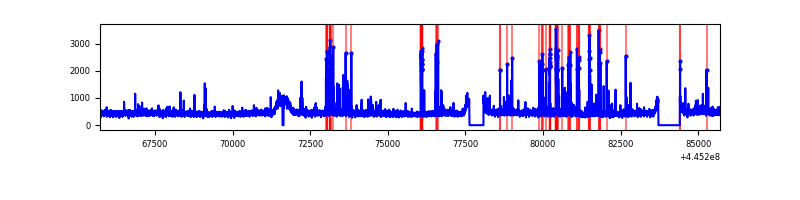 |
| D | 19973 | 18793 | 3127 | 3127 | 15.66% | 16.64% | 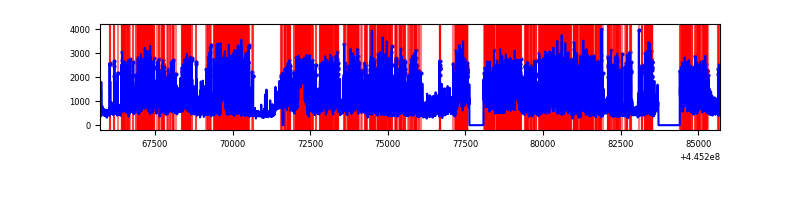 |
Top three noisy pixels from each quadrant. If the there are fewer than three noisy pixels in the level2.evt file, extra rows are filled as -1
| Pixel properties | Quadrant properties | ||||||
|---|---|---|---|---|---|---|---|
| Quadrant | DetID | PixID | Counts | Sigma | Mean | Median | Sigma |
| A | 10 | 83 | 6890199 | 15660.8 | 2120 | 2076 | 439.8 |
| A | 13 | 248 | 1092321 | 2478.78 | 2120 | 2076 | 439.8 |
| A | 0 | 243 | 47226 | 102.65 | 2120 | 2076 | 439.8 |
| B | 4 | 171 | 374779 | 890.17 | 2131 | 2069 | 418.7 |
| B | 3 | 96 | 209293 | 494.93 | 2131 | 2069 | 418.7 |
| B | 5 | 172 | 124100 | 291.46 | 2131 | 2069 | 418.7 |
| C | 14 | 254 | 582500 | 1169.2 | 2112 | 2123 | 496.4 |
| C | 15 | 208 | 92851 | 182.78 | 2112 | 2123 | 496.4 |
| C | 12 | 2 | 76564 | 149.96 | 2112 | 2123 | 496.4 |
| D | 13 | 249 | 5922867 | 12193.96 | 1949 | 1889 | 485.6 |
| D | 11 | 241 | 1918736 | 3947.65 | 1949 | 1889 | 485.6 |
| D | 5 | 222 | 1371978 | 2821.63 | 1949 | 1889 | 485.6 |
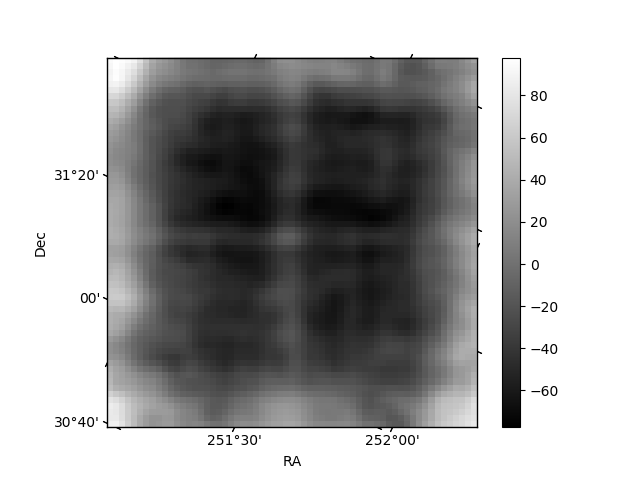
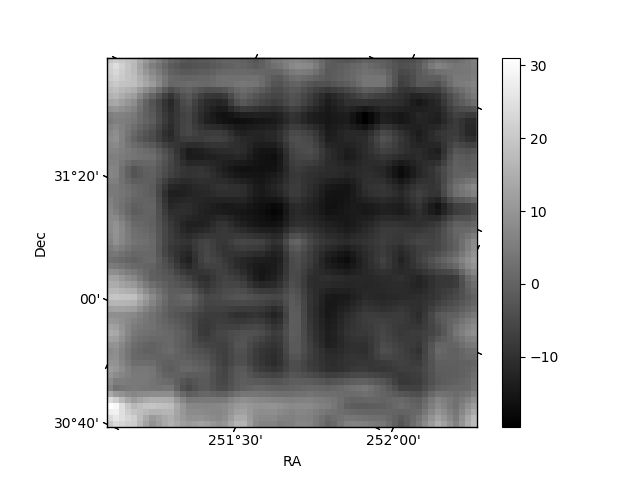
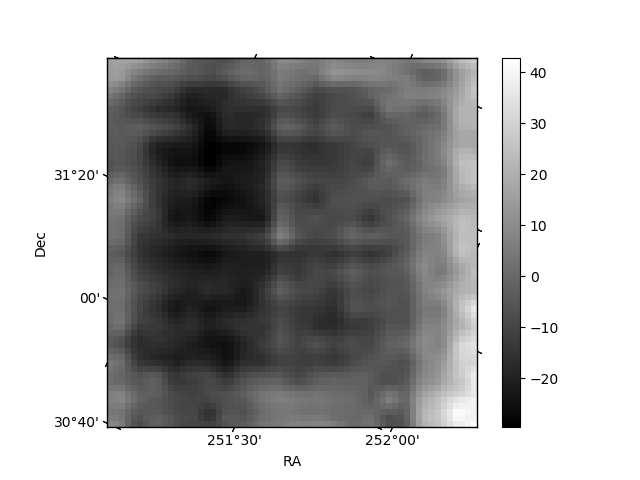
Histogram calculated using DETX and DETY for each event in the final _common_clean file
| Quadrant A | 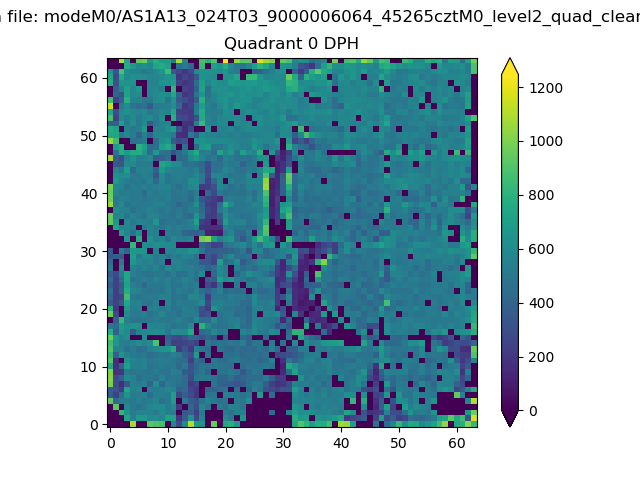 |
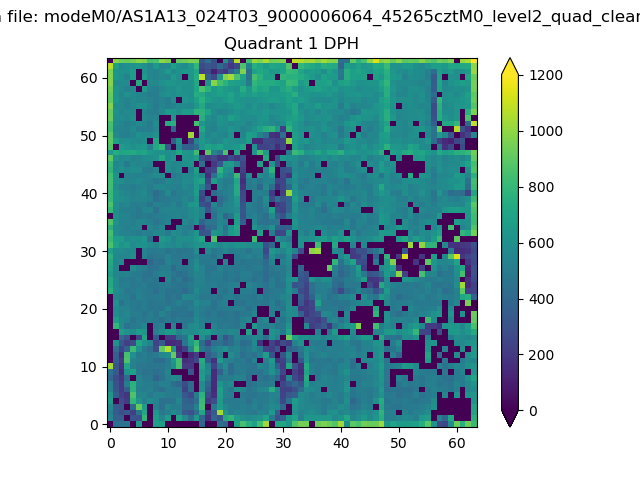 |
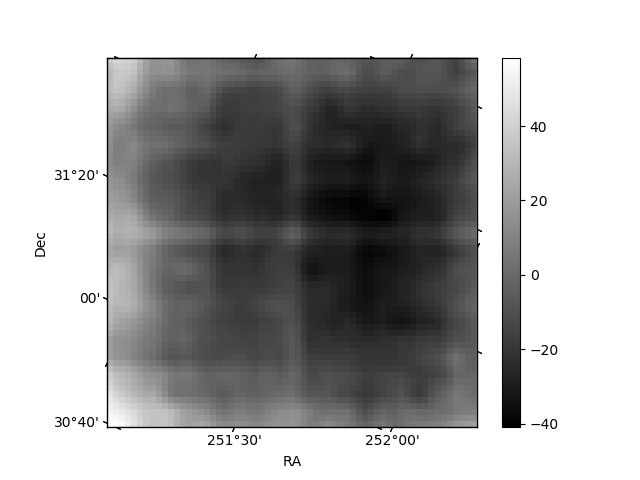
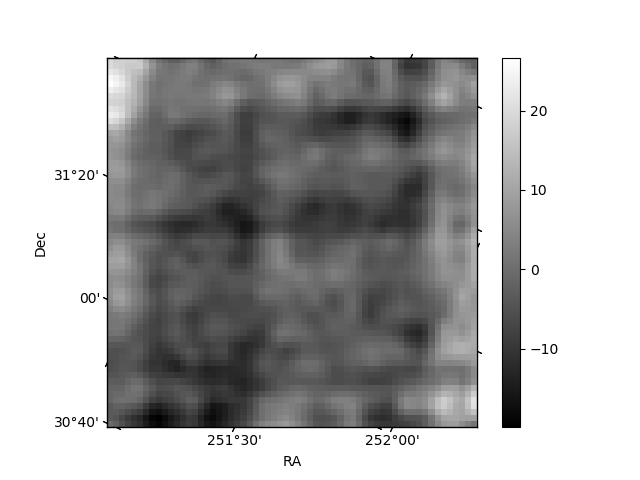
Quadrant B |
|---|---|---|---|
| Quadrant D | 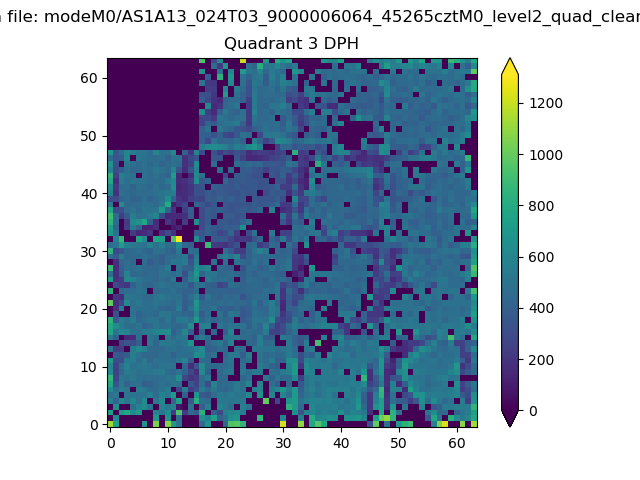 |
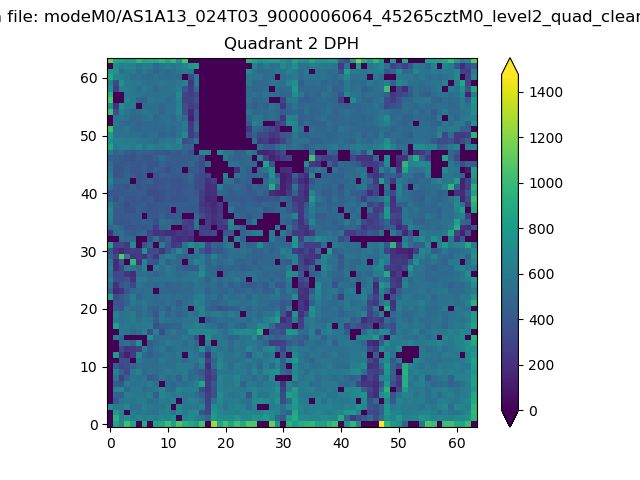 |
Quadrant C |
| Plot type | Count rate plots | Images |
|---|---|---|
| Comparison with Poisson distribution Blue bars denote a histogram of data divided into 1 sec bins. Red curve is a Poisson curve with rate = median count rate of data. |
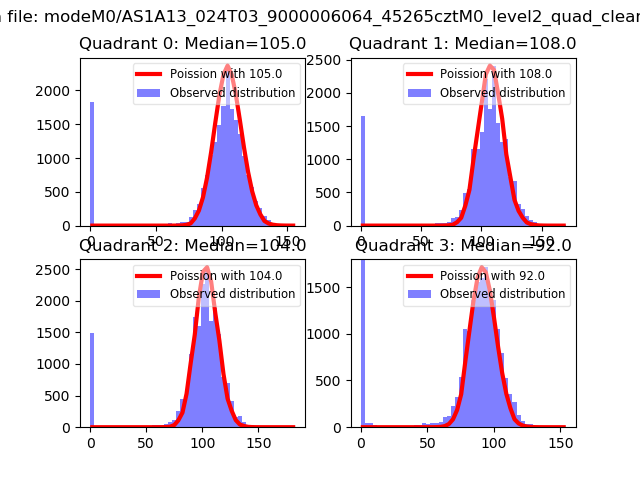 |
 |
| Quadrant-wise count rates Data is divided into 100 sec bins |
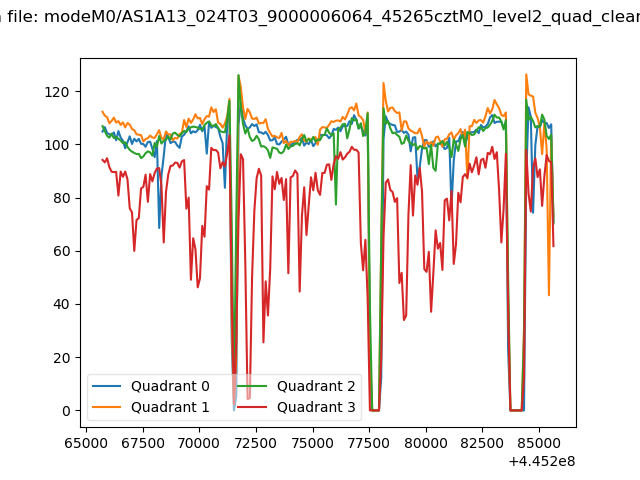 |
|
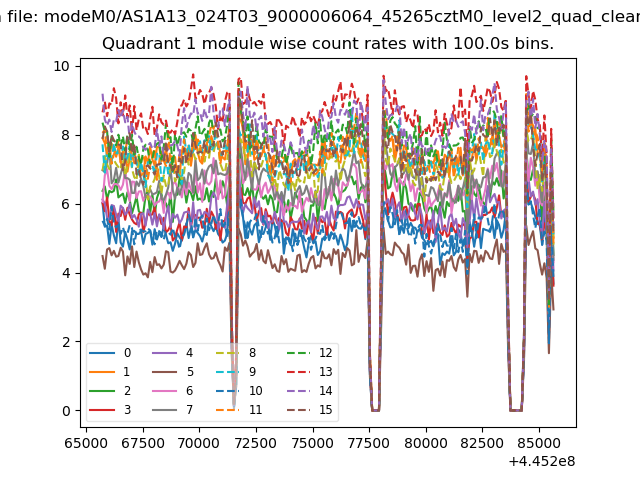
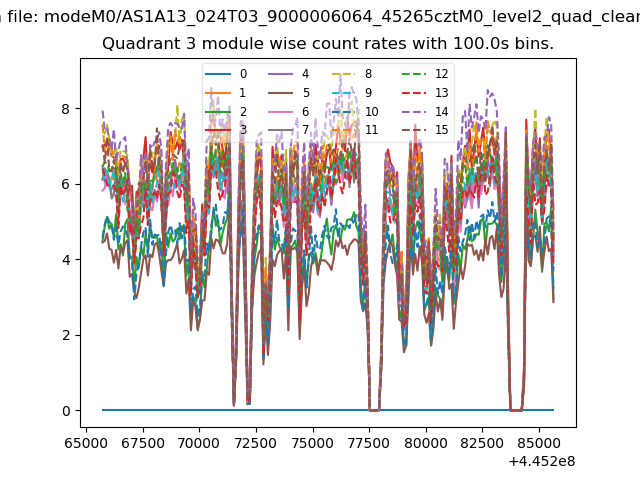
| Module-wise count rates for Quadrant A Data is divided into 100 sec bins |
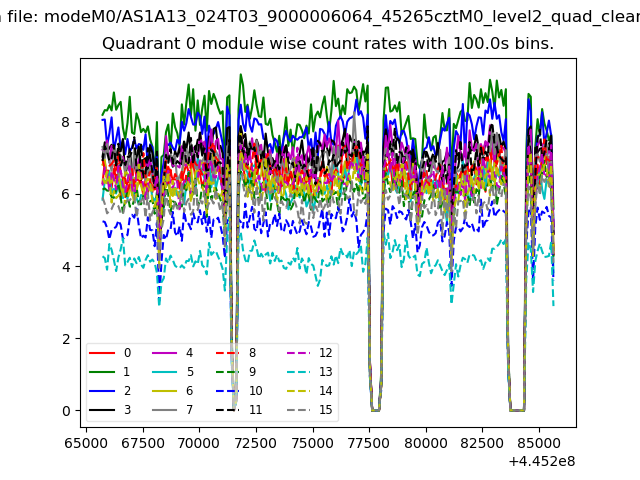 |
 |
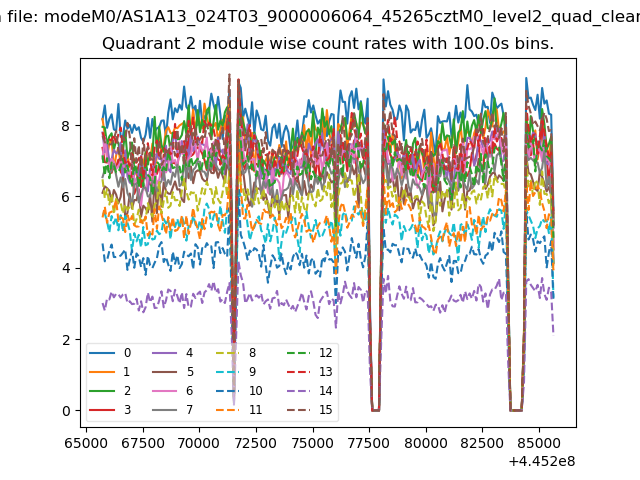
| Module-wise count rates for Quadrant B Data is divided into 100 sec bins |
 |
 |
| Module-wise count rates for Quadrant C Data is divided into 100 sec bins |
 |
 |
| Module-wise count rates for Quadrant D Data is divided into 100 sec bins |
 |
 |
| Parameter | Plot |
|---|---|
| CZT HV Monitor | 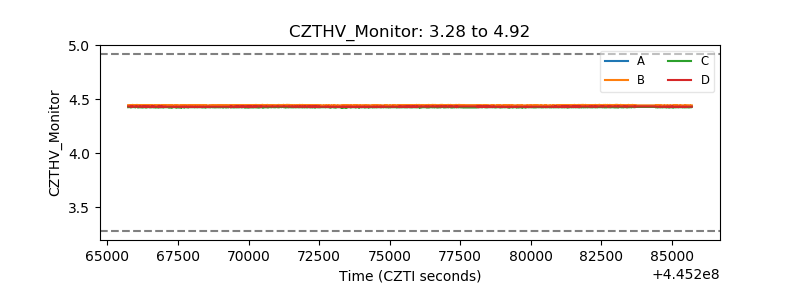 |
| D_VDD | 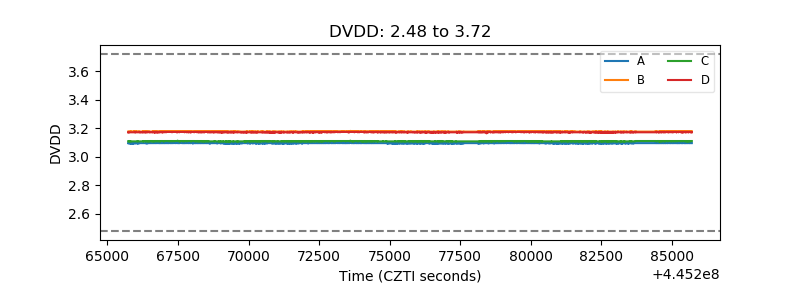 |
| Temperature 1 | 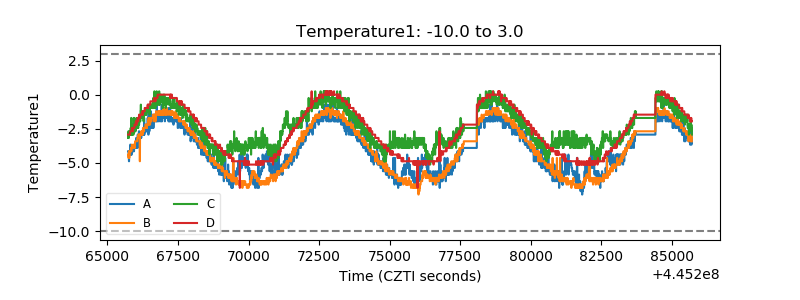 |
| Veto HV Monitor |  |
| Veto LLD | 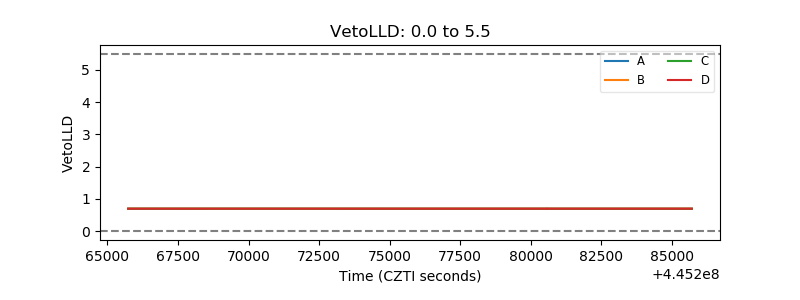 |
| Alpha Counter | 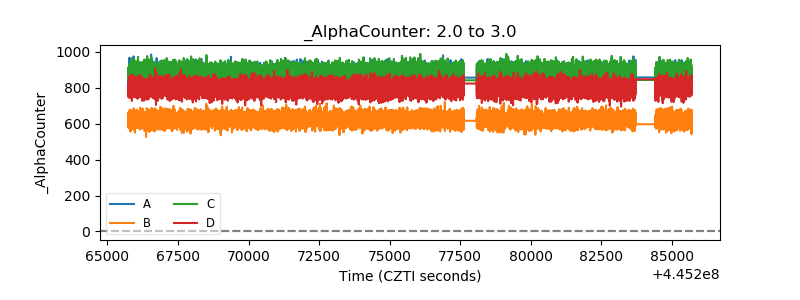 |
| _CPM_Rate | 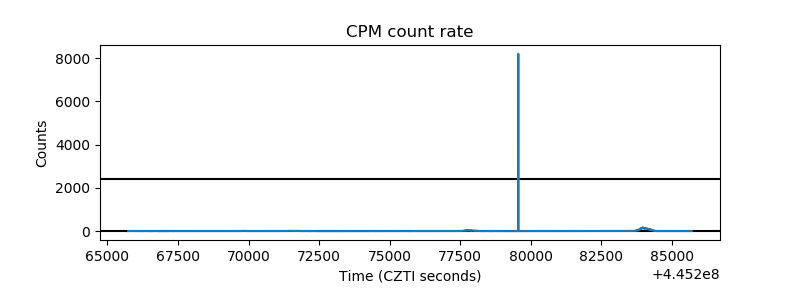 |
| CZT Counter | 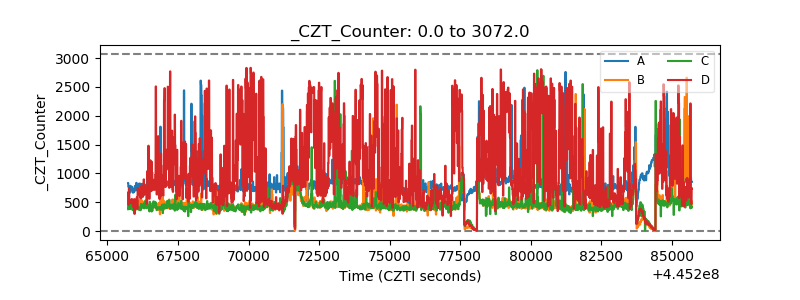 |
| +2.5 Volts monitor | 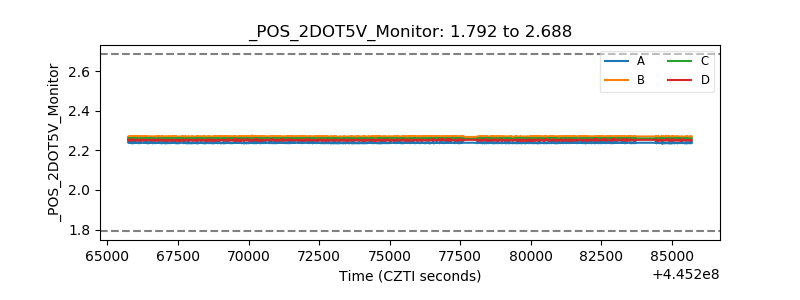 |
| +5 Volts monitor | 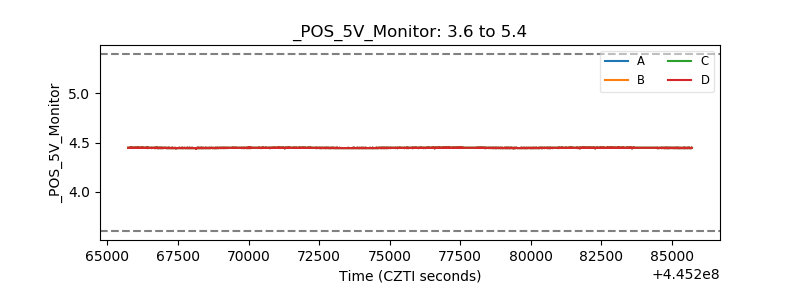 |
| _ROLL_ROT | 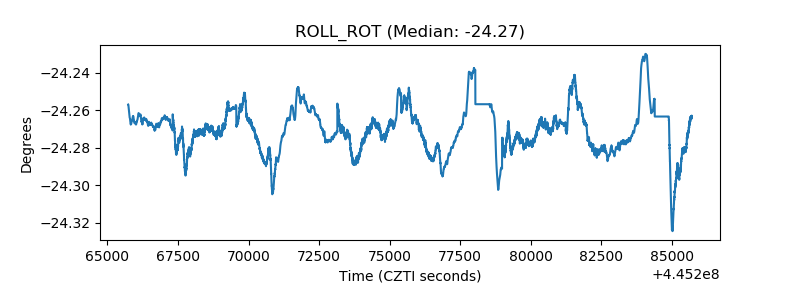 |
| _Roll_DEC | 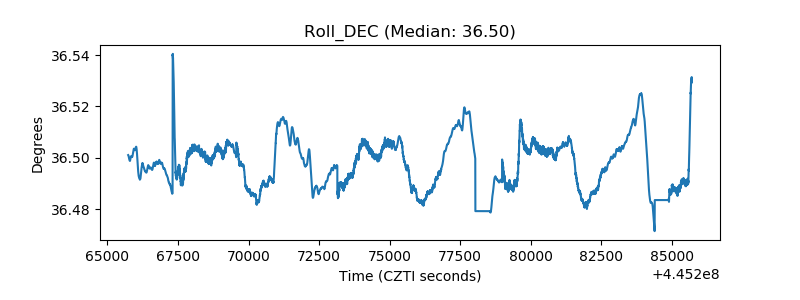 |
| _Roll_RA | 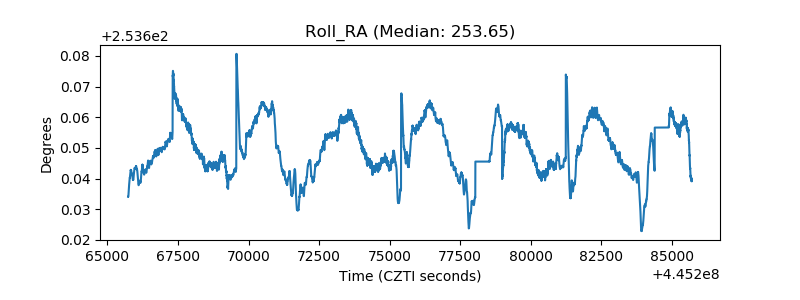 |
| Veto Counter | 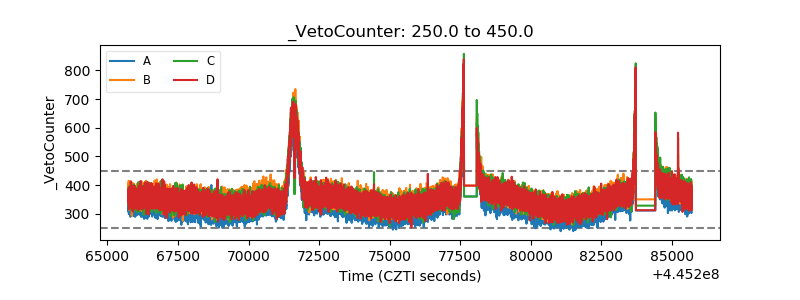 |