| Param | Original file | Final file |
|---|---|---|
| Filename | modeM0/AS1A13_024T03_9000006064_45266cztM0_level2.fits | modeM0/AS1A13_024T03_9000006064_45266cztM0_level2_quad_clean.evt |
| Size (bytes) | 485,712,000 | 98,233,920 |
| Size | 463.2 MB | 93.7 MB |
| Events in quadrant A | 5,329,936 | 664,164 |
| Events in quadrant B | 3,425,105 | 685,836 |
| Events in quadrant C | 2,816,828 | 670,498 |
| Events in quadrant D | 5,919,690 | 515,355 |
| Mode M0 | |||
|---|---|---|---|
| Quadrant | BADHDUFLAG | Total packets | Discarded packets |
| A | 0 | 20618 | 1 |
| B | 0 | 14433 | 1 |
| C | 0 | 12889 | 1 |
| D | 0 | 21859 | 1 |
| Mode SS | |||
|---|---|---|---|
| Quadrant | BADHDUFLAG | Total packets | Discarded packets |
| A | 0 | 128 | 0 |
| B | 0 | 128 | 0 |
| C | 0 | 128 | 0 |
| D | 0 | 128 | 0 |
| Mode M9 | |||
|---|---|---|---|
| Quadrant | BADHDUFLAG | Total packets | Discarded packets |
| A | 0 | 9 | 0 |
| B | 0 | 9 | 0 |
| C | 0 | 9 | 0 |
| D | 0 | 9 | 0 |
| Quadrant | Total seconds | Saturated seconds | Saturation percentage |
|---|---|---|---|
| A | 6278 | 220 | 3.504301% |
| B | 6279 | 187 | 2.978181% |
| C | 6279 | 36 | 0.573340% |
| D | 6279 | 1061 | 16.897595% |
Noise dominated data is calculated using 1-second bins in cleaned event files. If a bin has >2000 counts, and if more than 50% of those come from <1% of pixels, then it is considered to be noise-dominated and hence unusable.
| Quadrant | # 1 sec bins | Bins with >0 counts | Bins with >2000 counts | High rate bins dominated by noise | Noise dominated (total time) | Noise dominated (detector-on time) | Marked lightcurve |
|---|---|---|---|---|---|---|---|
| A | 7178 | 6278 | 53 | 53 | 0.74% | 0.84% | 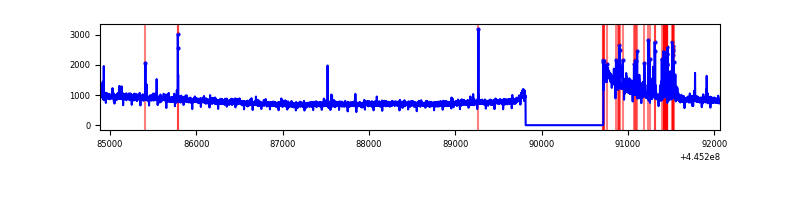 |
| B | 7179 | 6279 | 97 | 97 | 1.35% | 1.54% | 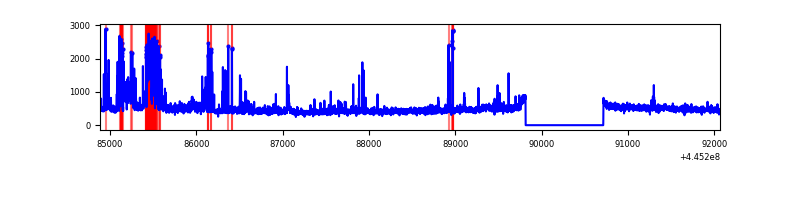 |
| C | 7179 | 6279 | 3 | 3 | 0.04% | 0.05% | 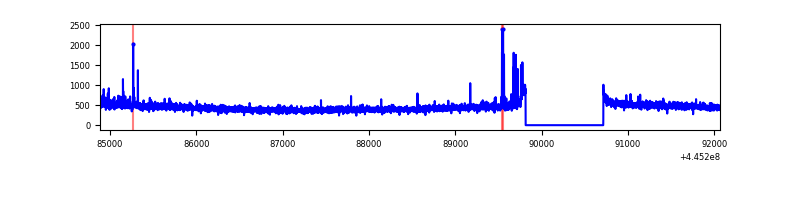 |
| D | 7179 | 6279 | 866 | 866 | 12.06% | 13.79% | 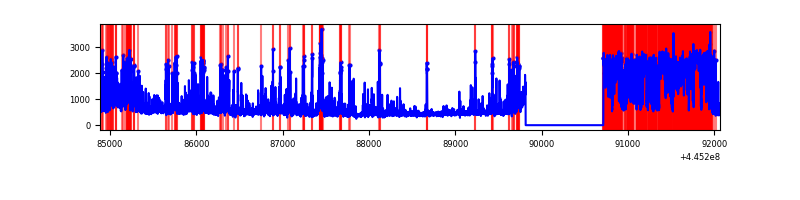 |
Top three noisy pixels from each quadrant. If the there are fewer than three noisy pixels in the level2.evt file, extra rows are filled as -1
| Pixel properties | Quadrant properties | ||||||
|---|---|---|---|---|---|---|---|
| Quadrant | DetID | PixID | Counts | Sigma | Mean | Median | Sigma |
| A | 10 | 83 | 2367948 | 16022.57 | 704 | 688 | 147.7 |
| A | 13 | 248 | 197171 | 1329.88 | 704 | 688 | 147.7 |
| A | 0 | 243 | 19339 | 126.24 | 704 | 688 | 147.7 |
| B | 4 | 171 | 464955 | 3334.07 | 704 | 683 | 139.3 |
| B | 5 | 255 | 49238 | 348.69 | 704 | 683 | 139.3 |
| B | 5 | 172 | 32928 | 231.56 | 704 | 683 | 139.3 |
| C | 14 | 254 | 40338 | 237.91 | 702 | 705 | 166.6 |
| C | 2 | 14 | 16791 | 96.56 | 702 | 705 | 166.6 |
| C | 3 | 233 | 16443 | 94.47 | 702 | 705 | 166.6 |
| D | 13 | 249 | 1814047 | 11377.38 | 626 | 607 | 159.4 |
| D | 2 | 249 | 484760 | 3037.54 | 626 | 607 | 159.4 |
| D | 11 | 241 | 480581 | 3011.32 | 626 | 607 | 159.4 |
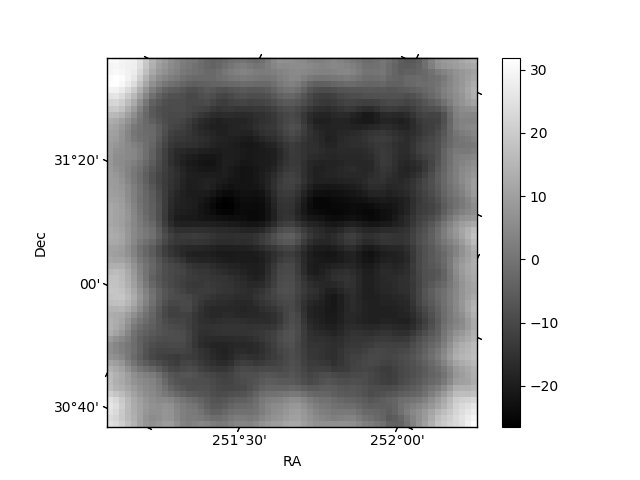
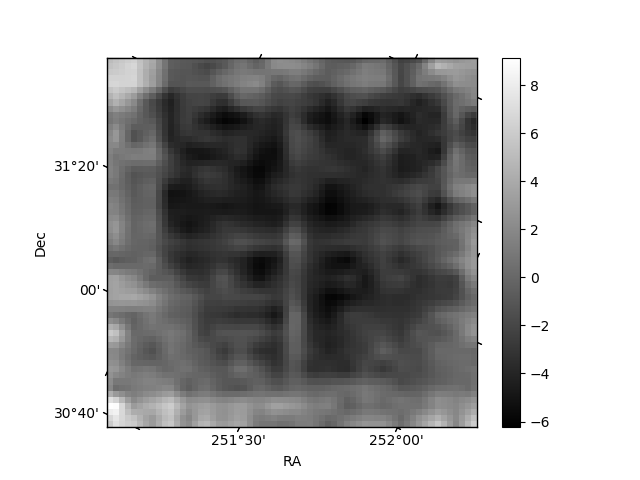
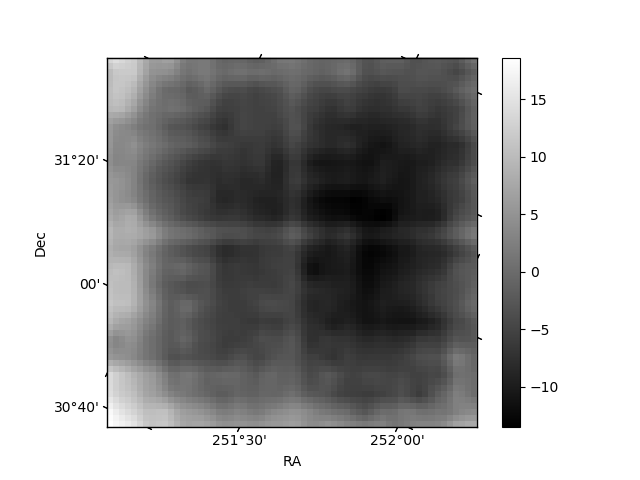
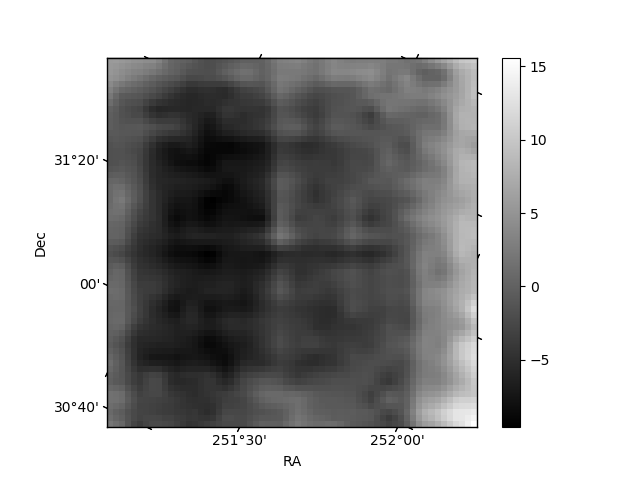
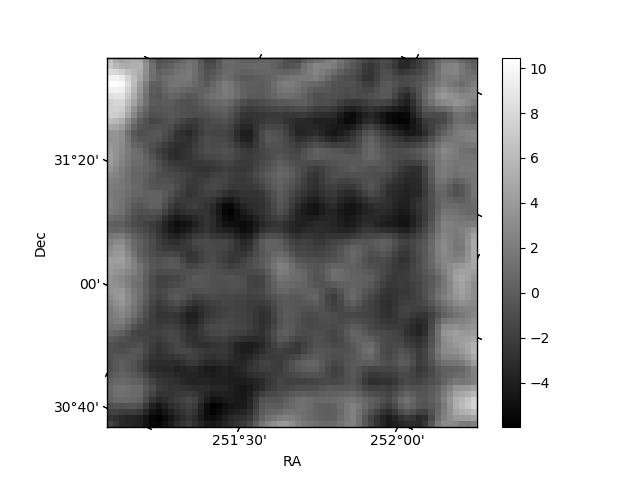
Histogram calculated using DETX and DETY for each event in the final _common_clean file
| Quadrant A | 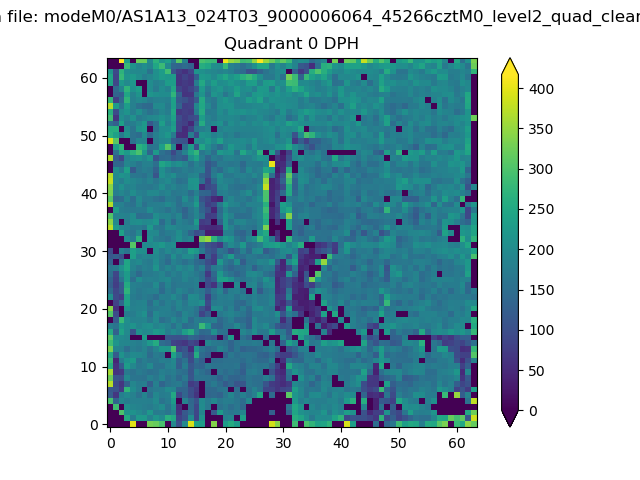 |
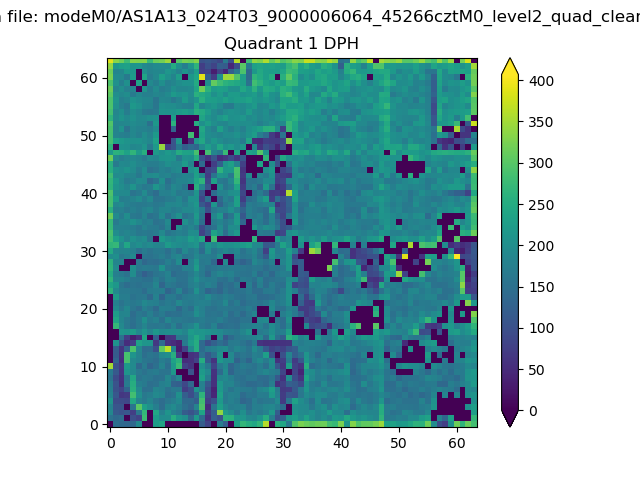 |
Quadrant B |
|---|---|---|---|
| Quadrant D | 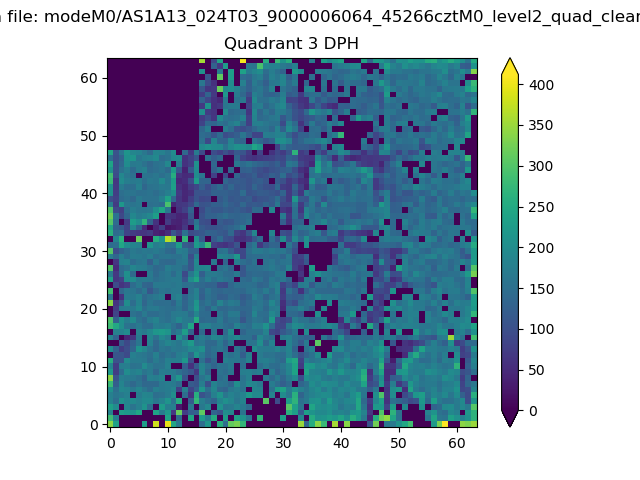 |
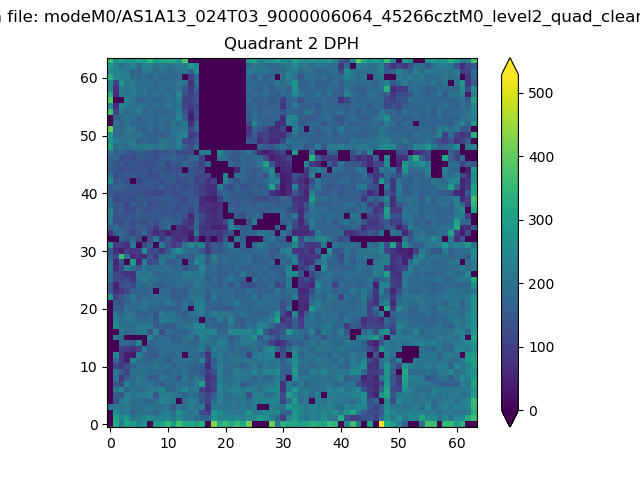 |
Quadrant C |
| Plot type | Count rate plots | Images |
|---|---|---|
| Comparison with Poisson distribution Blue bars denote a histogram of data divided into 1 sec bins. Red curve is a Poisson curve with rate = median count rate of data. |
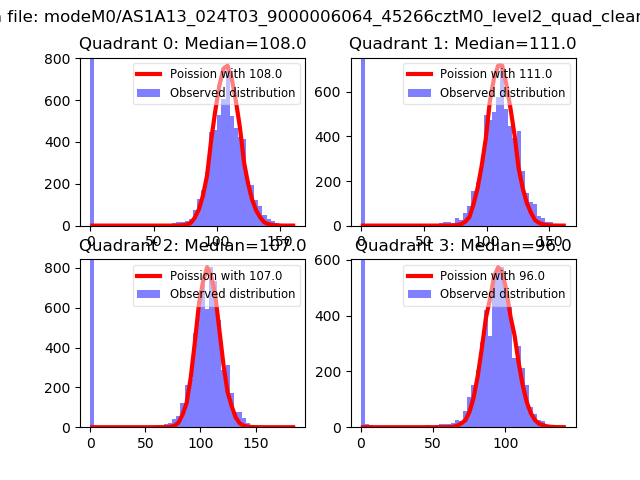 |
 |
| Quadrant-wise count rates Data is divided into 100 sec bins |
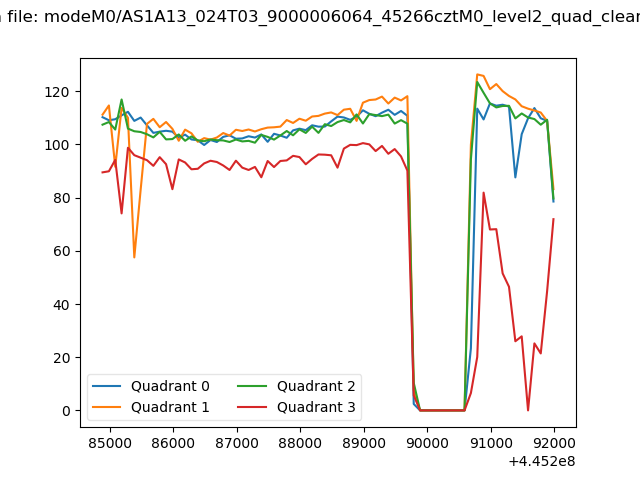 |
|
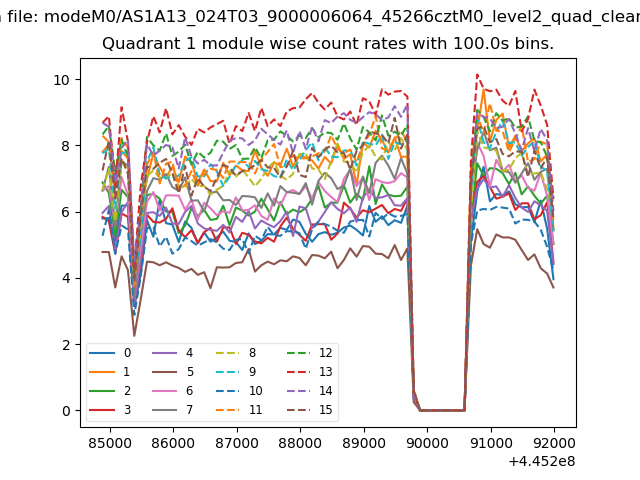
| Module-wise count rates for Quadrant A Data is divided into 100 sec bins |
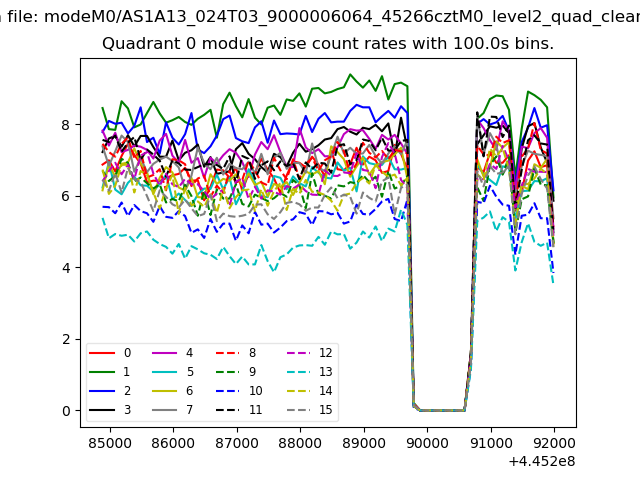 |
 |
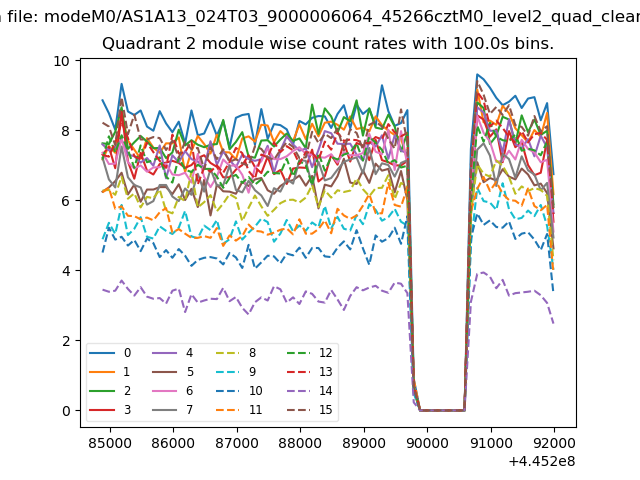
| Module-wise count rates for Quadrant B Data is divided into 100 sec bins |
 |
 |
| Module-wise count rates for Quadrant C Data is divided into 100 sec bins |
 |
 |
| Module-wise count rates for Quadrant D Data is divided into 100 sec bins |
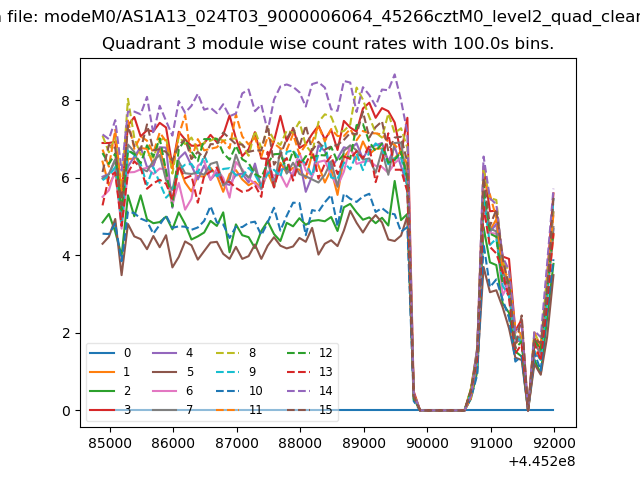 |
 |
| Parameter | Plot |
|---|---|
| CZT HV Monitor | 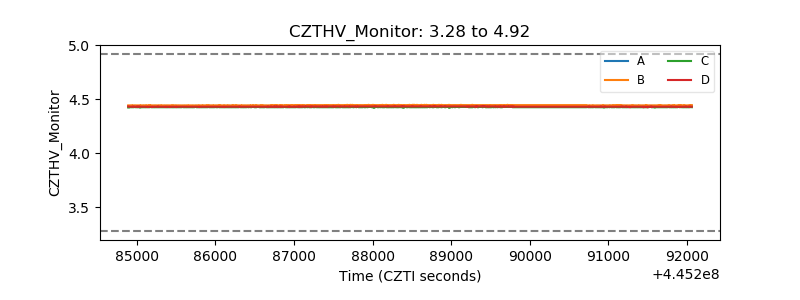 |
| D_VDD | 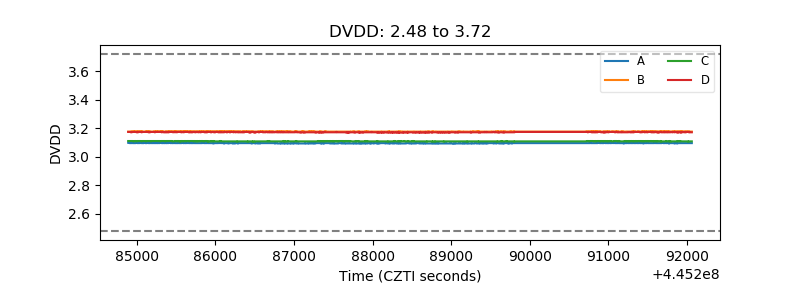 |
| Temperature 1 | 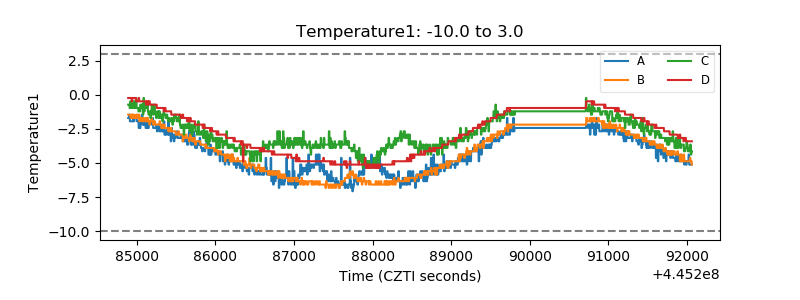 |
| Veto HV Monitor | 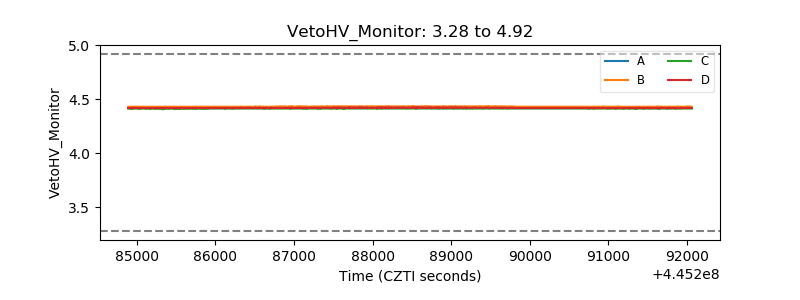 |
| Veto LLD | 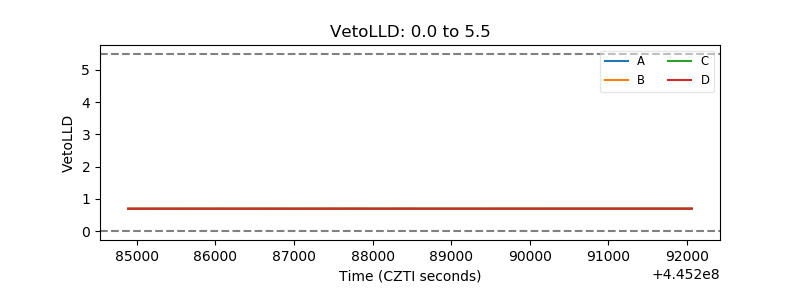 |
| Alpha Counter | 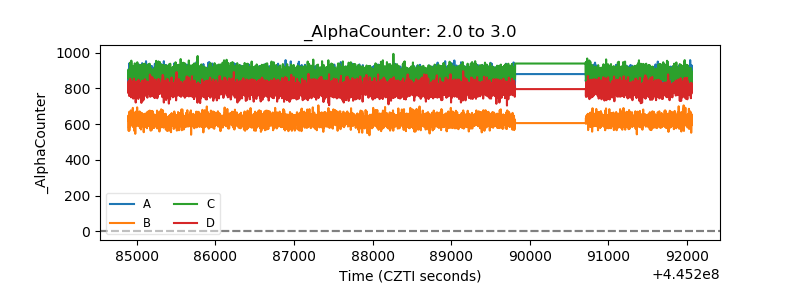 |
| _CPM_Rate | 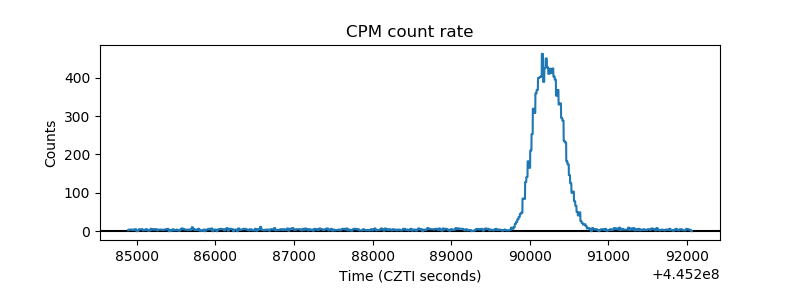 |
| CZT Counter | 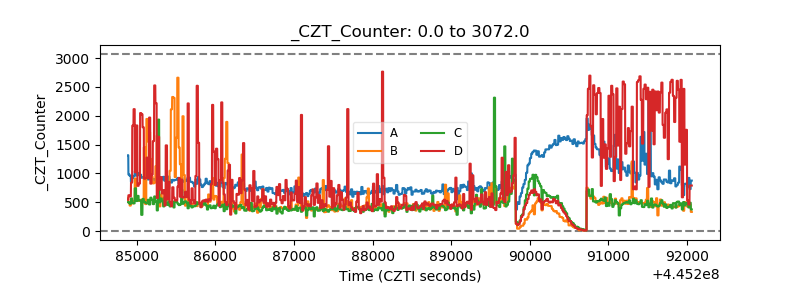 |
| +2.5 Volts monitor | 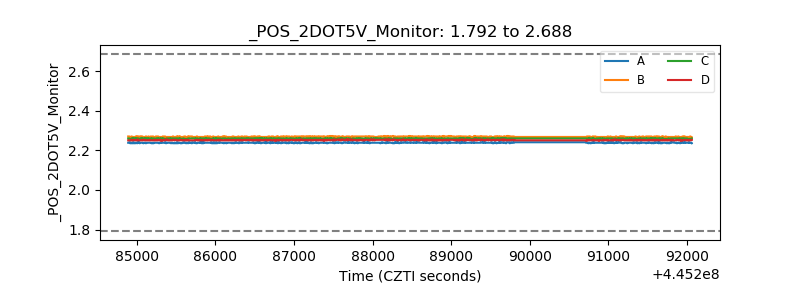 |
| +5 Volts monitor | 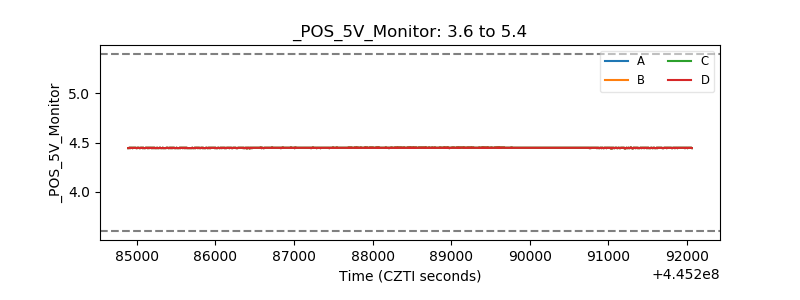 |
| _ROLL_ROT | 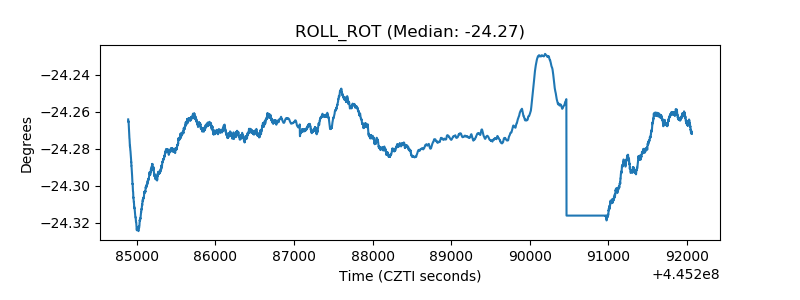 |
| _Roll_DEC | 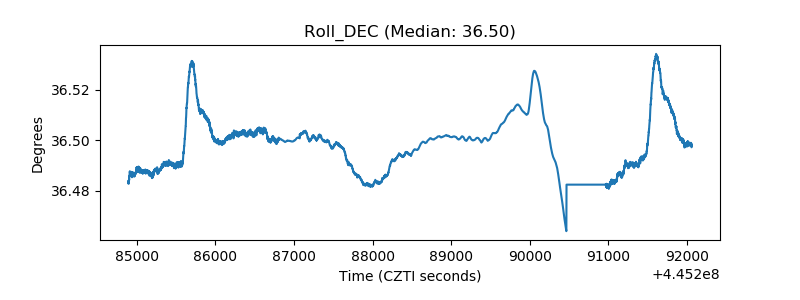 |
| _Roll_RA | 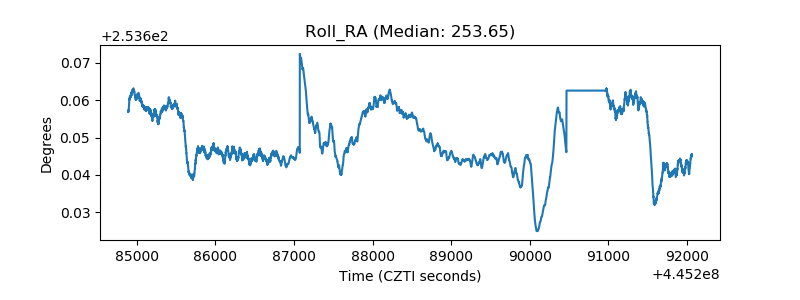 |
| Veto Counter | 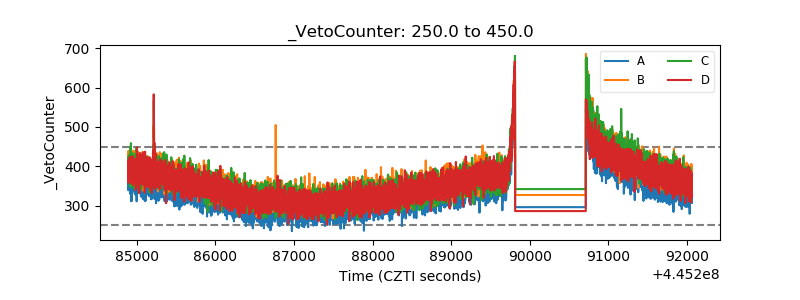 |