| Param | Original file | Final file |
|---|---|---|
| Filename | modeM0/AS1A13_024T03_9000006064_45268cztM0_level2.fits | modeM0/AS1A13_024T03_9000006064_45268cztM0_level2_quad_clean.evt |
| Size (bytes) | 510,874,560 | 100,140,480 |
| Size | 487.2 MB | 95.5 MB |
| Events in quadrant A | 5,366,694 | 684,774 |
| Events in quadrant B | 3,003,380 | 724,107 |
| Events in quadrant C | 2,846,643 | 697,142 |
| Events in quadrant D | 7,202,797 | 484,621 |
| Mode M0 | |||
|---|---|---|---|
| Quadrant | BADHDUFLAG | Total packets | Discarded packets |
| A | 0 | 20855 | 1 |
| B | 0 | 13152 | 1 |
| C | 0 | 12971 | 1 |
| D | 0 | 25902 | 5 |
| Mode SS | |||
|---|---|---|---|
| Quadrant | BADHDUFLAG | Total packets | Discarded packets |
| A | 0 | 126 | 0 |
| B | 0 | 126 | 0 |
| C | 0 | 126 | 0 |
| D | 0 | 126 | 0 |
| Mode M9 | |||
|---|---|---|---|
| Quadrant | BADHDUFLAG | Total packets | Discarded packets |
| A | 0 | 10 | 0 |
| B | 0 | 10 | 0 |
| C | 0 | 10 | 0 |
| D | 0 | 10 | 0 |
| Quadrant | Total seconds | Saturated seconds | Saturation percentage |
|---|---|---|---|
| A | 6325 | 242 | 3.826087% |
| B | 6326 | 60 | 0.948467% |
| C | 6326 | 38 | 0.600696% |
| D | 6325 | 1598 | 25.264822% |
Noise dominated data is calculated using 1-second bins in cleaned event files. If a bin has >2000 counts, and if more than 50% of those come from <1% of pixels, then it is considered to be noise-dominated and hence unusable.
| Quadrant | # 1 sec bins | Bins with >0 counts | Bins with >2000 counts | High rate bins dominated by noise | Noise dominated (total time) | Noise dominated (detector-on time) | Marked lightcurve |
|---|---|---|---|---|---|---|---|
| A | 7350 | 6325 | 62 | 62 | 0.84% | 0.98% | 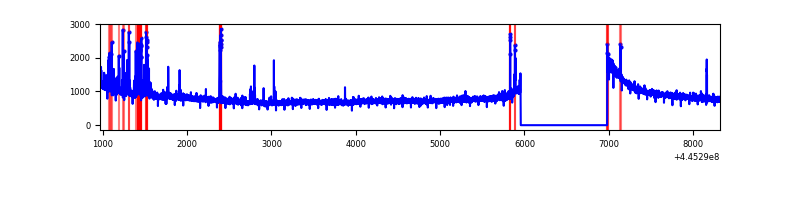 |
| B | 7351 | 6326 | 2 | 2 | 0.03% | 0.03% | 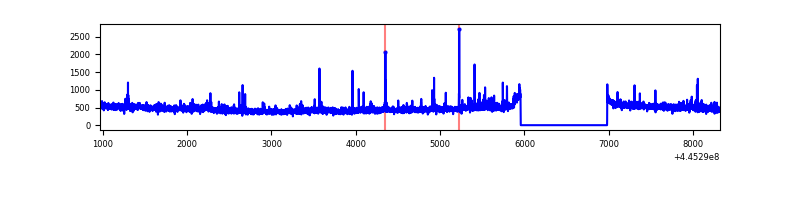 |
| C | 7351 | 6326 | 0 | 0 | 0.00% | 0.00% | 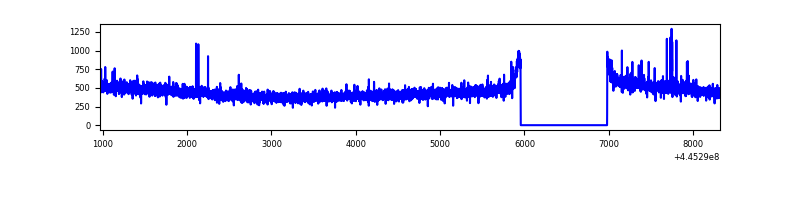 |
| D | 7350 | 6325 | 1400 | 1400 | 19.05% | 22.13% | 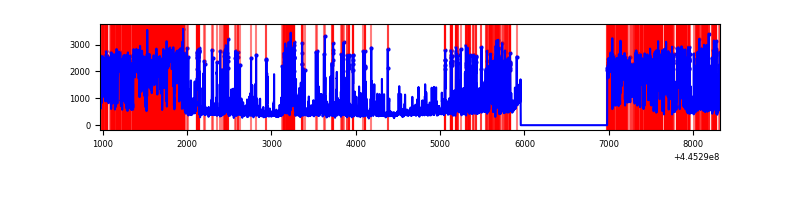 |
Top three noisy pixels from each quadrant. If the there are fewer than three noisy pixels in the level2.evt file, extra rows are filled as -1
| Pixel properties | Quadrant properties | ||||||
|---|---|---|---|---|---|---|---|
| Quadrant | DetID | PixID | Counts | Sigma | Mean | Median | Sigma |
| A | 10 | 83 | 2356486 | 15792.03 | 715 | 701 | 149.2 |
| A | 13 | 248 | 203552 | 1359.81 | 715 | 701 | 149.2 |
| A | 15 | 174 | 23197 | 150.8 | 715 | 701 | 149.2 |
| B | 5 | 255 | 24438 | 168.45 | 724 | 704 | 140.9 |
| B | 10 | 3 | 22808 | 156.89 | 724 | 704 | 140.9 |
| B | 12 | 111 | 18099 | 123.46 | 724 | 704 | 140.9 |
| C | 14 | 254 | 15541 | 87.61 | 717 | 722 | 169.1 |
| C | 3 | 233 | 10706 | 59.03 | 717 | 722 | 169.1 |
| C | 12 | 249 | 8082 | 43.51 | 717 | 722 | 169.1 |
| D | 13 | 249 | 3443713 | 22375.63 | 605 | 584 | 153.9 |
| D | 11 | 241 | 568151 | 3688.41 | 605 | 584 | 153.9 |
| D | 2 | 249 | 295214 | 1914.69 | 605 | 584 | 153.9 |
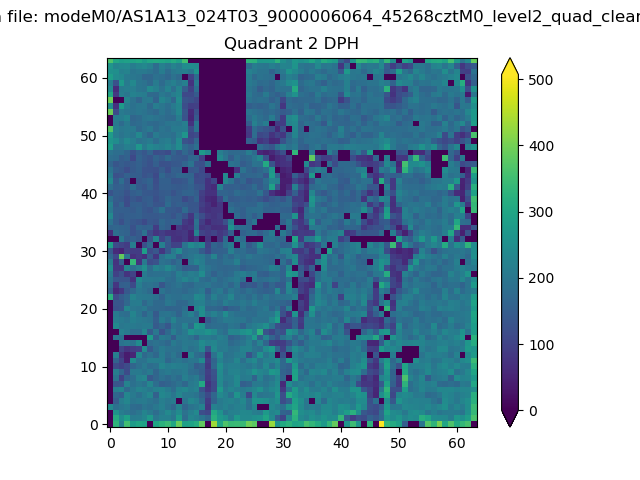
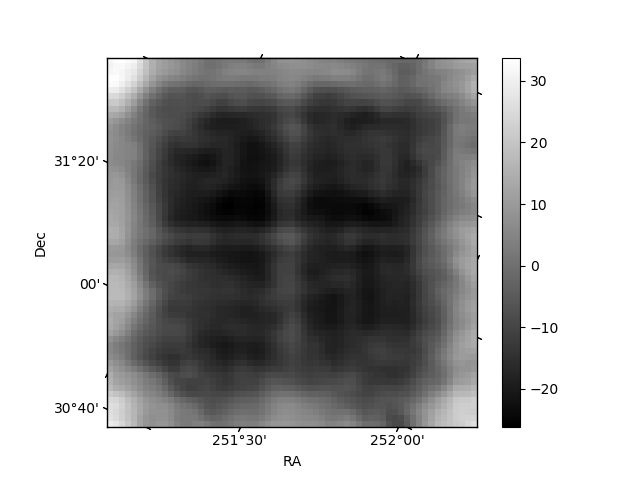
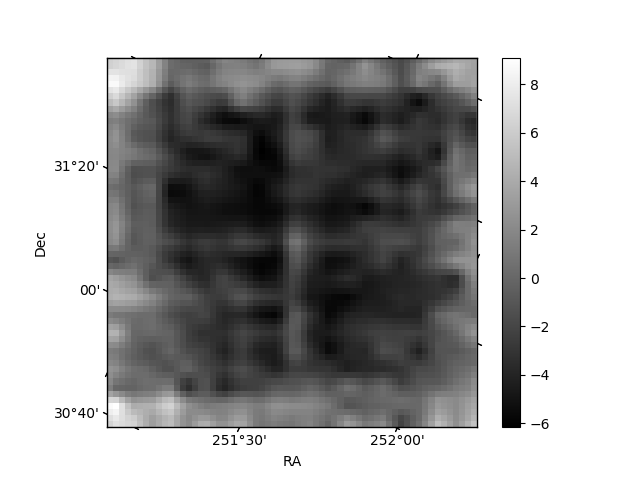
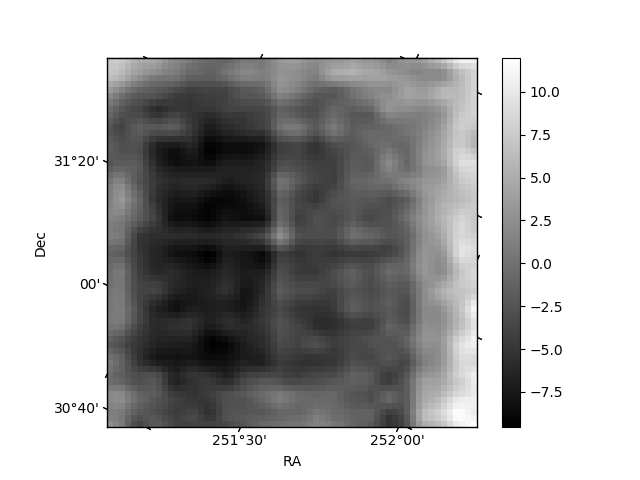
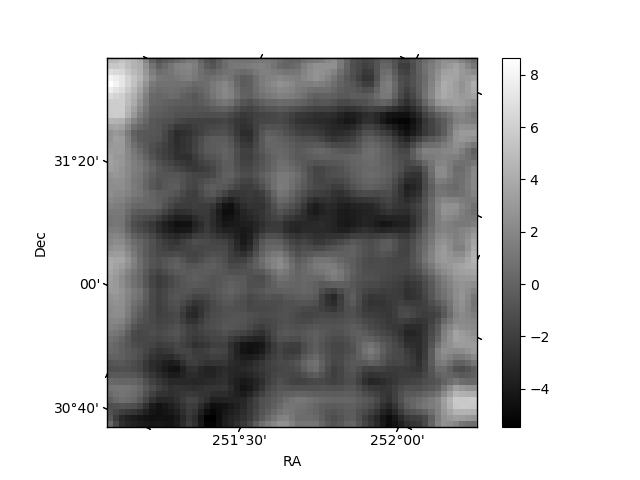
Histogram calculated using DETX and DETY for each event in the final _common_clean file
| Quadrant A | 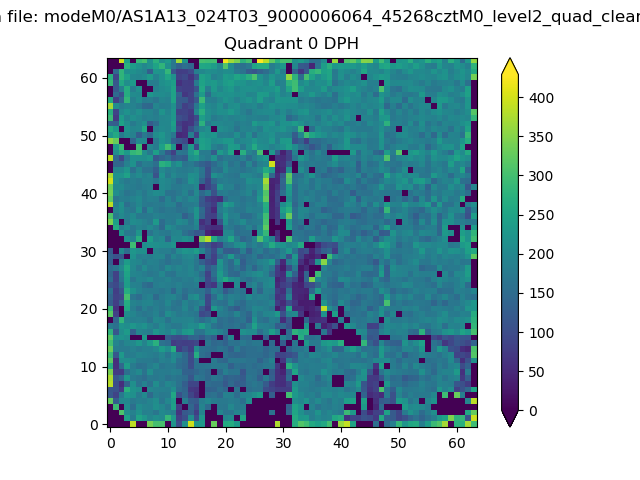 |
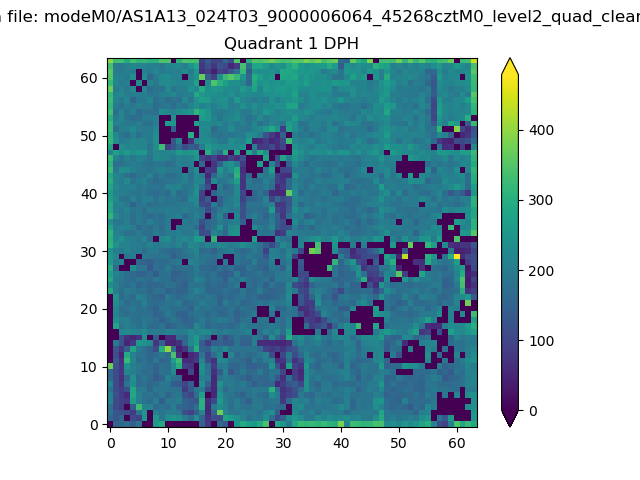 |
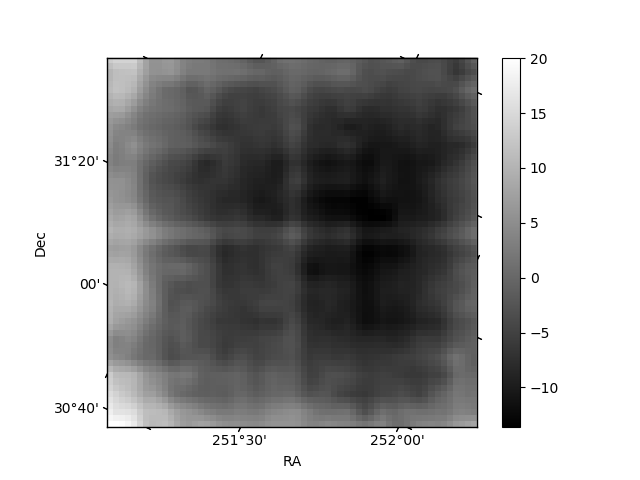
Quadrant B |
|---|---|---|---|
| Quadrant D | 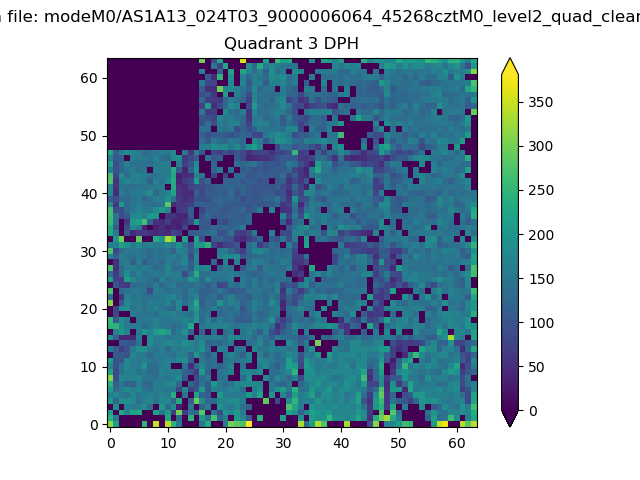 |
 |
Quadrant C |
| Plot type | Count rate plots | Images |
|---|---|---|
| Comparison with Poisson distribution Blue bars denote a histogram of data divided into 1 sec bins. Red curve is a Poisson curve with rate = median count rate of data. |
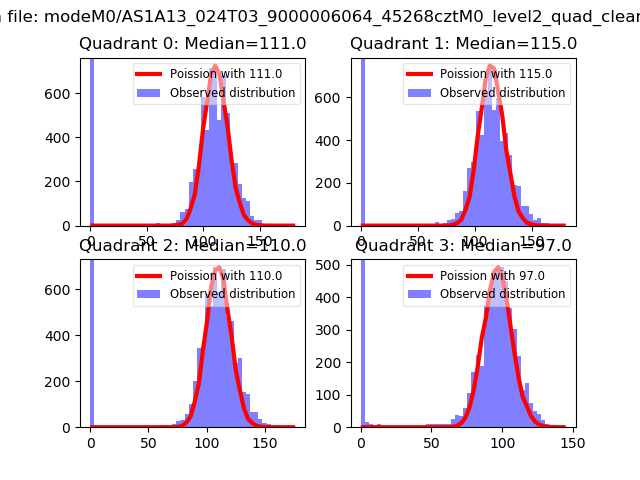 |
 |
| Quadrant-wise count rates Data is divided into 100 sec bins |
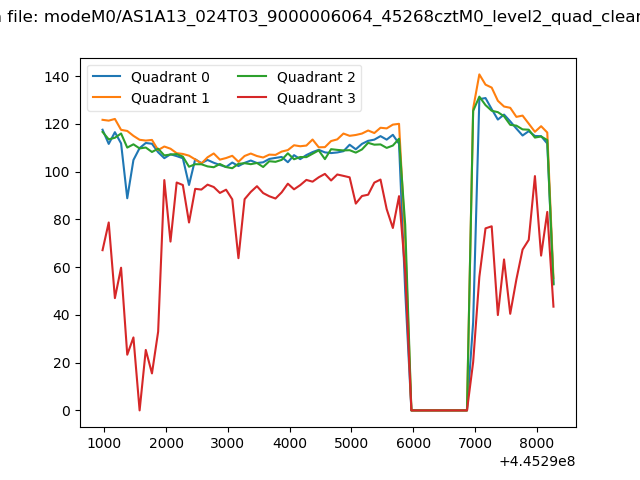 |
|
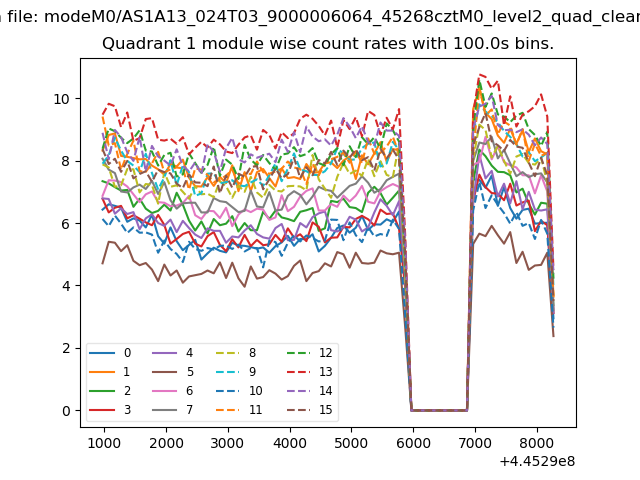
| Module-wise count rates for Quadrant A Data is divided into 100 sec bins |
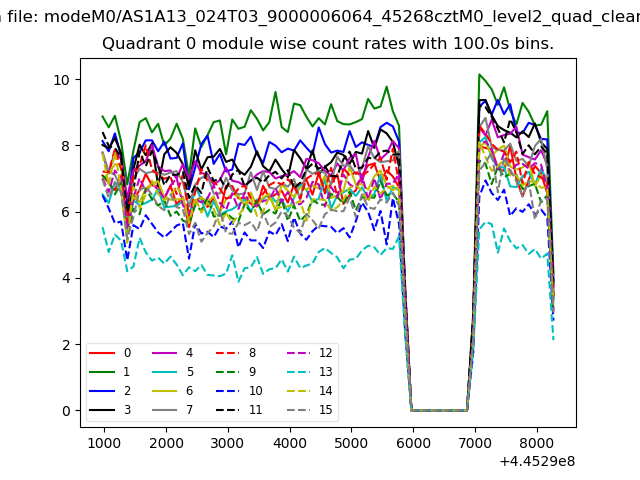 |
 |
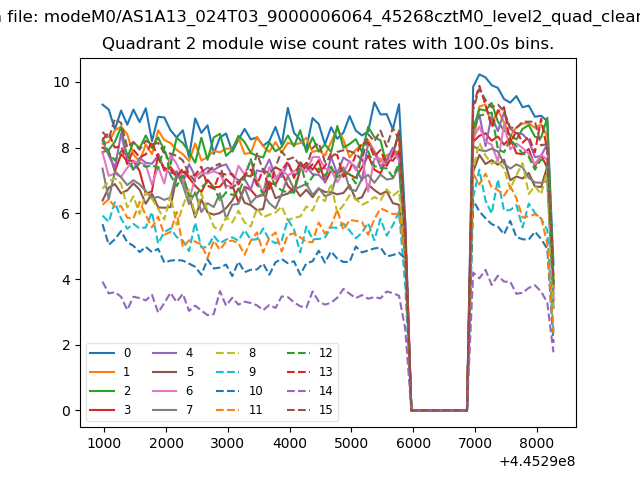
| Module-wise count rates for Quadrant B Data is divided into 100 sec bins |
 |
 |
| Module-wise count rates for Quadrant C Data is divided into 100 sec bins |
 |
 |
| Module-wise count rates for Quadrant D Data is divided into 100 sec bins |
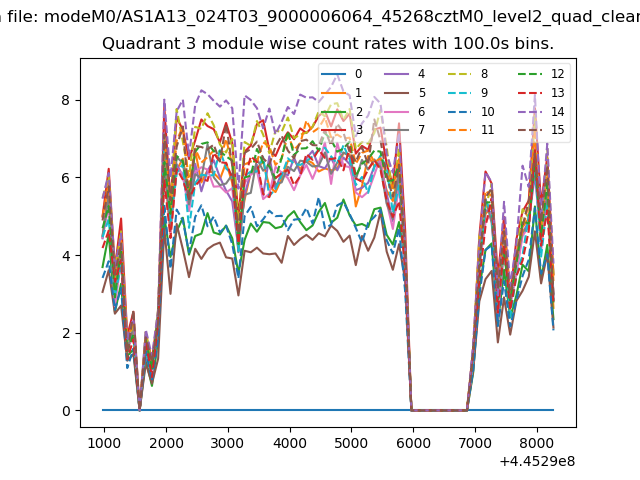 |
 |
| Parameter | Plot |
|---|---|
| CZT HV Monitor | 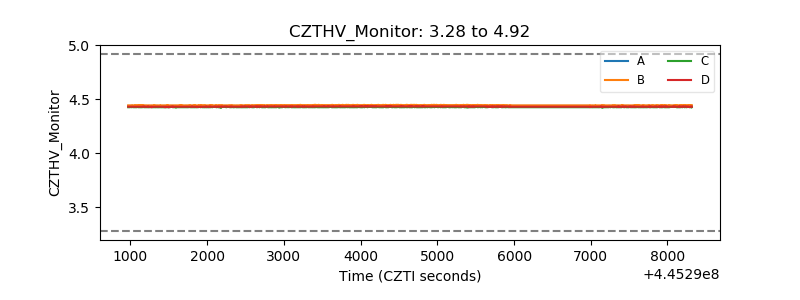 |
| D_VDD | 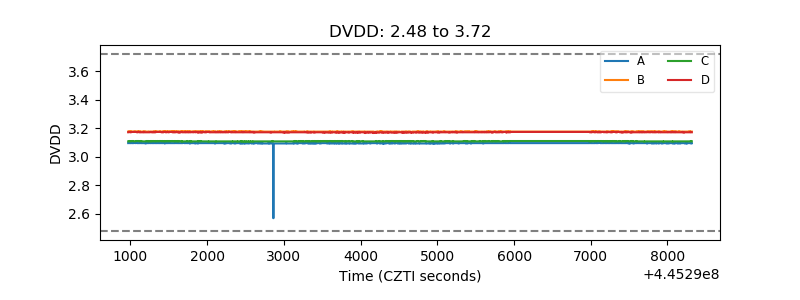 |
| Temperature 1 | 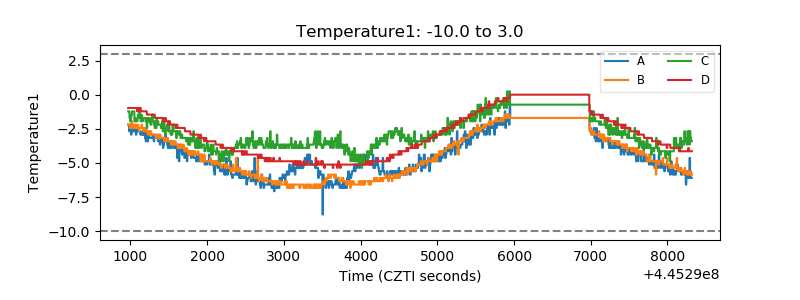 |
| Veto HV Monitor |  |
| Veto LLD | 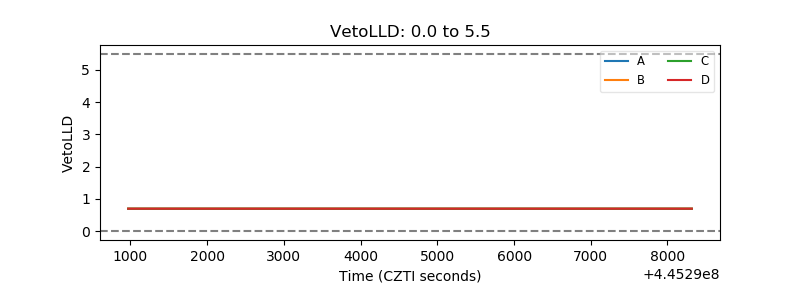 |
| Alpha Counter | 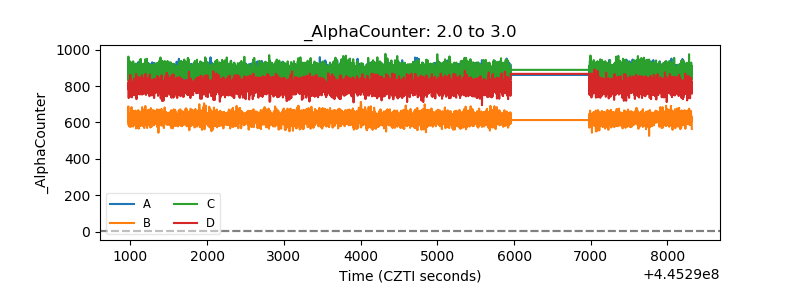 |
| _CPM_Rate | 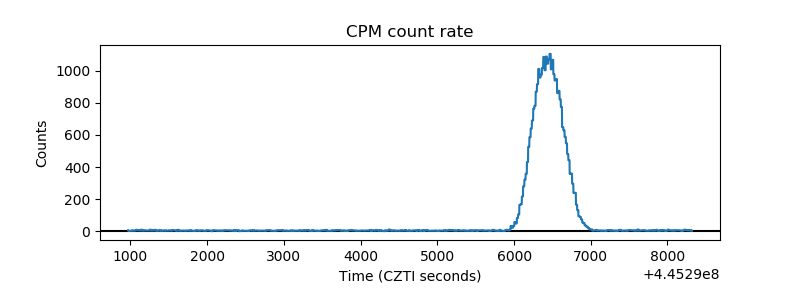 |
| CZT Counter | 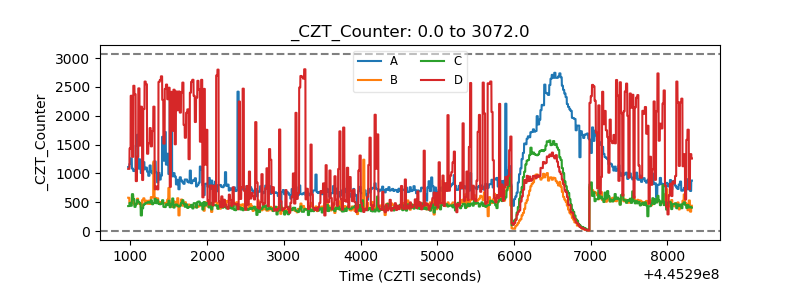 |
| +2.5 Volts monitor | 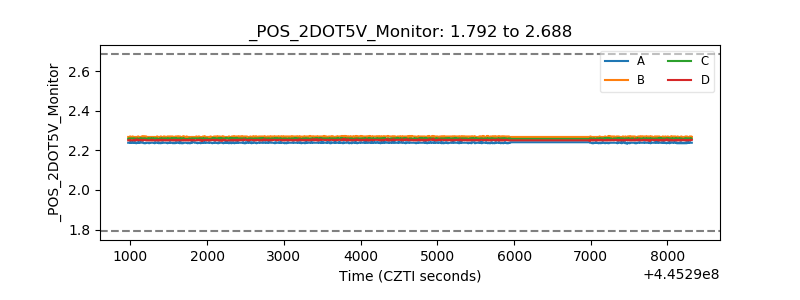 |
| +5 Volts monitor | 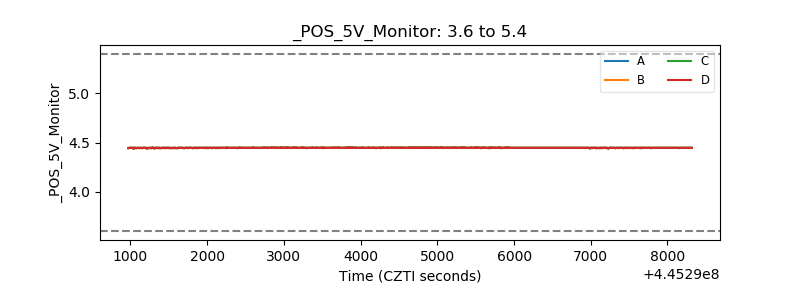 |
| _ROLL_ROT | 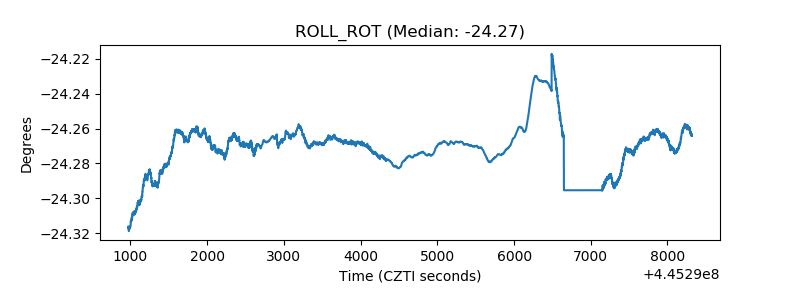 |
| _Roll_DEC | 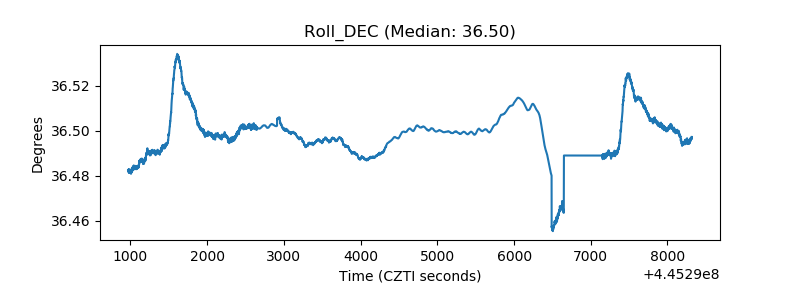 |
| _Roll_RA | 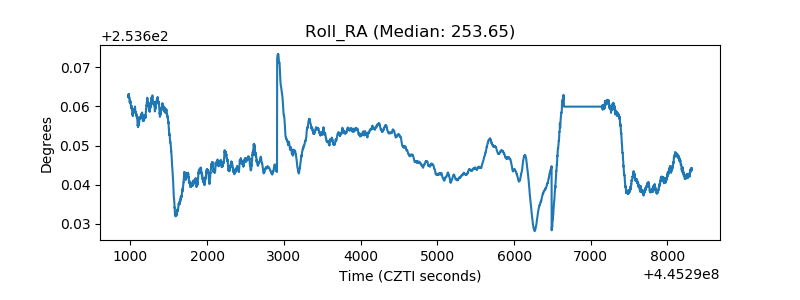 |
| Veto Counter | 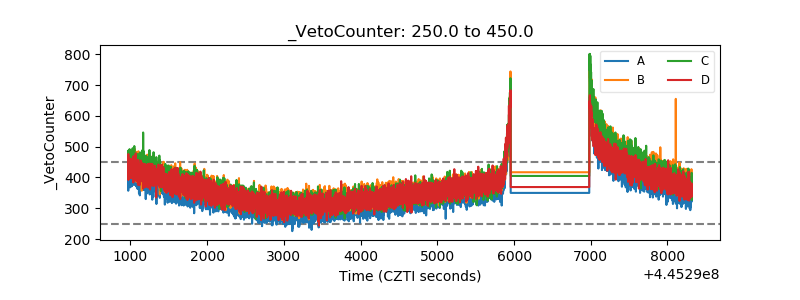 |