| Param | Original file | Final file |
|---|---|---|
| Filename | modeM0/AS1A13_024T03_9000006064_45269cztM0_level2.fits | modeM0/AS1A13_024T03_9000006064_45269cztM0_level2_quad_clean.evt |
| Size (bytes) | 474,554,880 | 105,474,240 |
| Size | 452.6 MB | 100.6 MB |
| Events in quadrant A | 5,199,436 | 712,985 |
| Events in quadrant B | 3,215,123 | 747,714 |
| Events in quadrant C | 3,096,127 | 717,406 |
| Events in quadrant D | 5,569,865 | 578,390 |
| Mode M0 | |||
|---|---|---|---|
| Quadrant | BADHDUFLAG | Total packets | Discarded packets |
| A | 0 | 20245 | 1 |
| B | 0 | 13716 | 2 |
| C | 0 | 13516 | 1 |
| D | 0 | 21029 | 1 |
| Mode SS | |||
|---|---|---|---|
| Quadrant | BADHDUFLAG | Total packets | Discarded packets |
| A | 0 | 128 | 0 |
| B | 0 | 128 | 0 |
| C | 0 | 128 | 0 |
| D | 0 | 128 | 0 |
| Mode M9 | |||
|---|---|---|---|
| Quadrant | BADHDUFLAG | Total packets | Discarded packets |
| A | 0 | 12 | 0 |
| B | 0 | 12 | 0 |
| C | 0 | 12 | 0 |
| D | 0 | 12 | 0 |
| Quadrant | Total seconds | Saturated seconds | Saturation percentage |
|---|---|---|---|
| A | 6259 | 151 | 2.412526% |
| B | 6258 | 83 | 1.326302% |
| C | 6259 | 45 | 0.718965% |
| D | 6259 | 834 | 13.324812% |
Noise dominated data is calculated using 1-second bins in cleaned event files. If a bin has >2000 counts, and if more than 50% of those come from <1% of pixels, then it is considered to be noise-dominated and hence unusable.
| Quadrant | # 1 sec bins | Bins with >0 counts | Bins with >2000 counts | High rate bins dominated by noise | Noise dominated (total time) | Noise dominated (detector-on time) | Marked lightcurve |
|---|---|---|---|---|---|---|---|
| A | 7439 | 6259 | 27 | 27 | 0.36% | 0.43% | 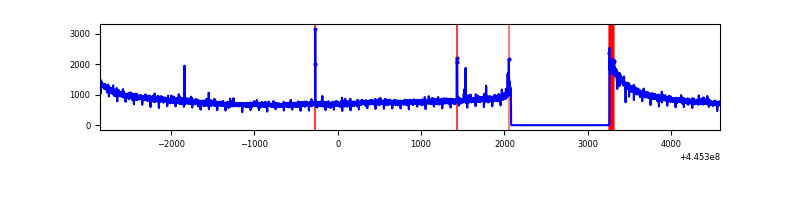 |
| B | 7438 | 6258 | 48 | 48 | 0.65% | 0.77% | 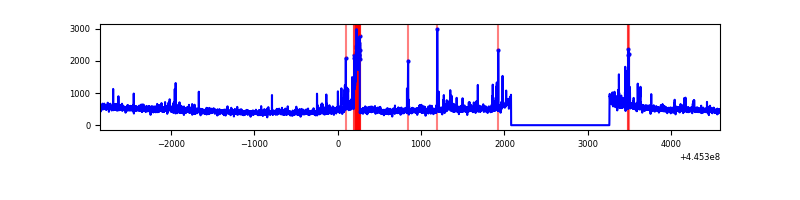 |
| C | 7439 | 6259 | 30 | 30 | 0.40% | 0.48% | 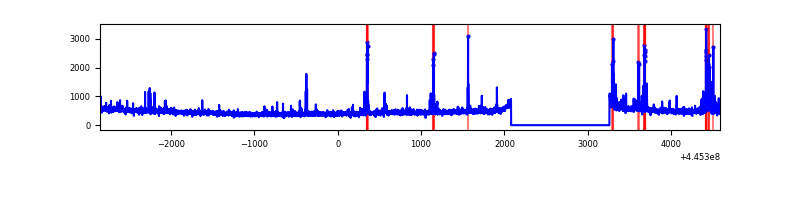 |
| D | 7439 | 6259 | 756 | 756 | 10.16% | 12.08% | 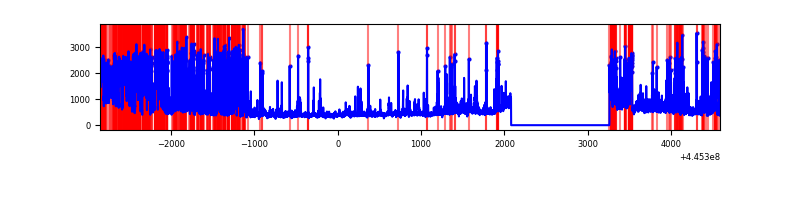 |
Top three noisy pixels from each quadrant. If the there are fewer than three noisy pixels in the level2.evt file, extra rows are filled as -1
| Pixel properties | Quadrant properties | ||||||
|---|---|---|---|---|---|---|---|
| Quadrant | DetID | PixID | Counts | Sigma | Mean | Median | Sigma |
| A | 10 | 83 | 2372005 | 15871.86 | 719 | 704 | 149.4 |
| A | 13 | 248 | 19510 | 125.87 | 719 | 704 | 149.4 |
| A | 0 | 243 | 10147 | 63.2 | 719 | 704 | 149.4 |
| B | 0 | 168 | 181312 | 1276.27 | 726 | 705 | 141.5 |
| B | 4 | 171 | 30611 | 211.33 | 726 | 705 | 141.5 |
| B | 5 | 255 | 21873 | 149.59 | 726 | 705 | 141.5 |
| C | 14 | 254 | 125819 | 744.48 | 715 | 720 | 168.0 |
| C | 12 | 2 | 101952 | 602.45 | 715 | 720 | 168.0 |
| C | 3 | 233 | 33333 | 194.08 | 715 | 720 | 168.0 |
| D | 13 | 249 | 1836241 | 10940.77 | 662 | 643 | 167.8 |
| D | 2 | 249 | 505861 | 3011.27 | 662 | 643 | 167.8 |
| D | 11 | 241 | 193272 | 1148.13 | 662 | 643 | 167.8 |
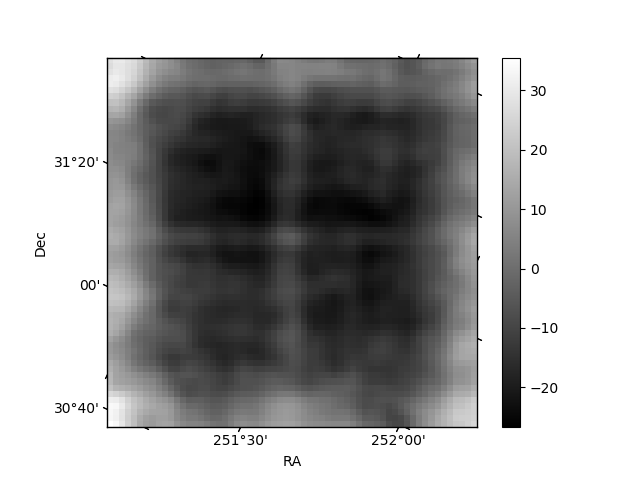
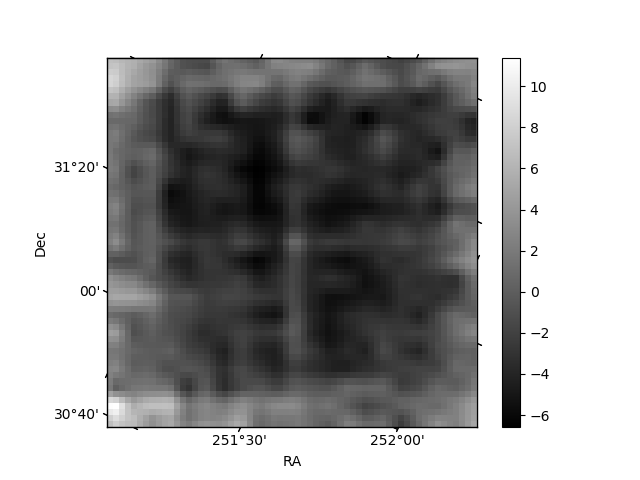
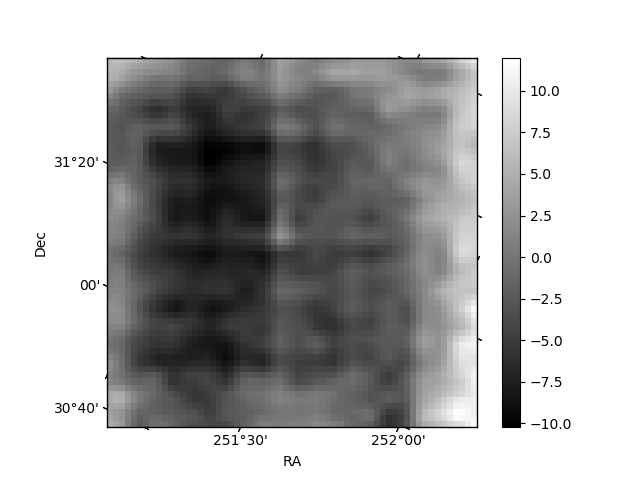
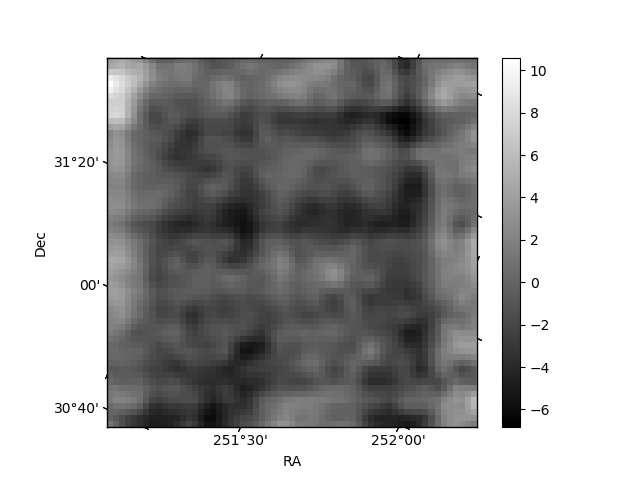
Histogram calculated using DETX and DETY for each event in the final _common_clean file
| Quadrant A | 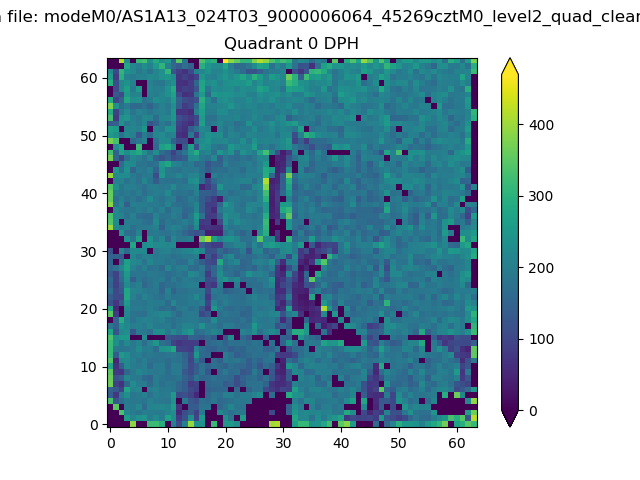 |
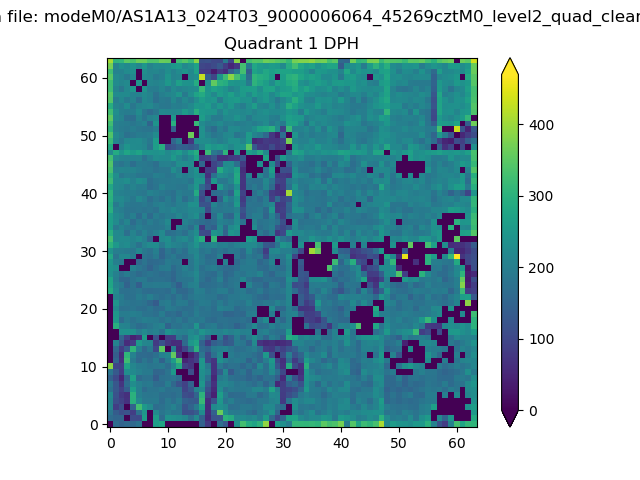 |
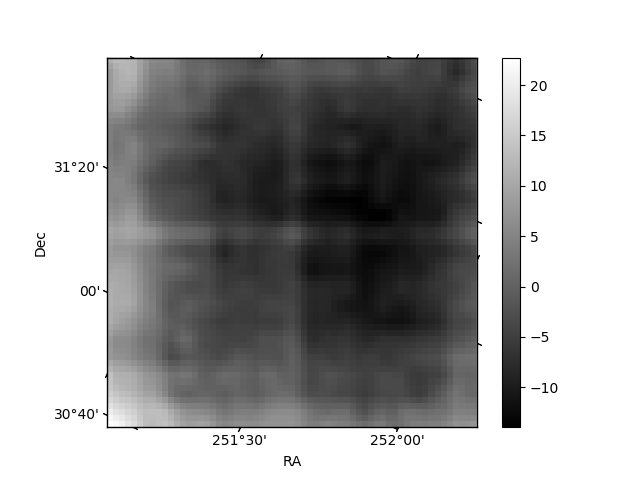
Quadrant B |
|---|---|---|---|
| Quadrant D | 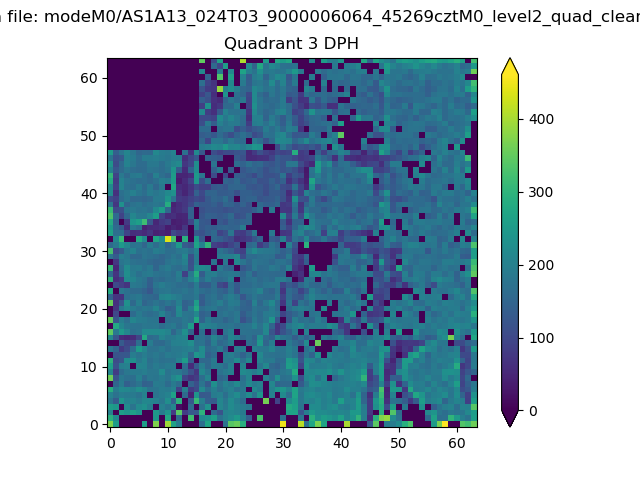 |
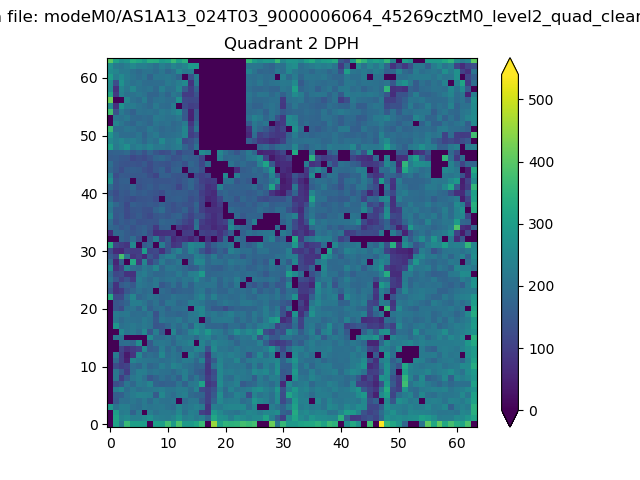 |
Quadrant C |
| Plot type | Count rate plots | Images |
|---|---|---|
| Comparison with Poisson distribution Blue bars denote a histogram of data divided into 1 sec bins. Red curve is a Poisson curve with rate = median count rate of data. |
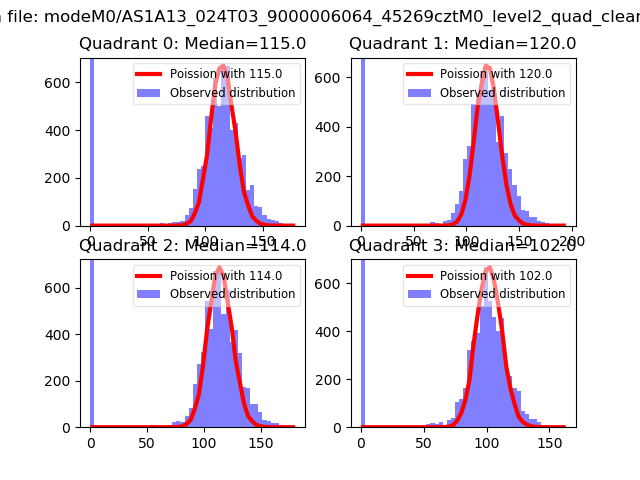 |
 |
| Quadrant-wise count rates Data is divided into 100 sec bins |
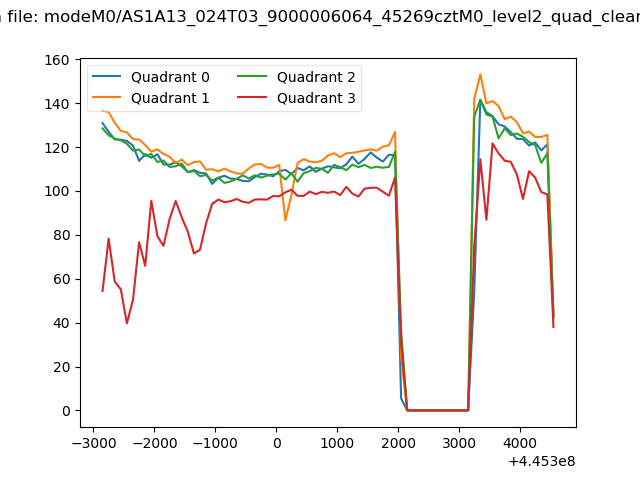 |
|
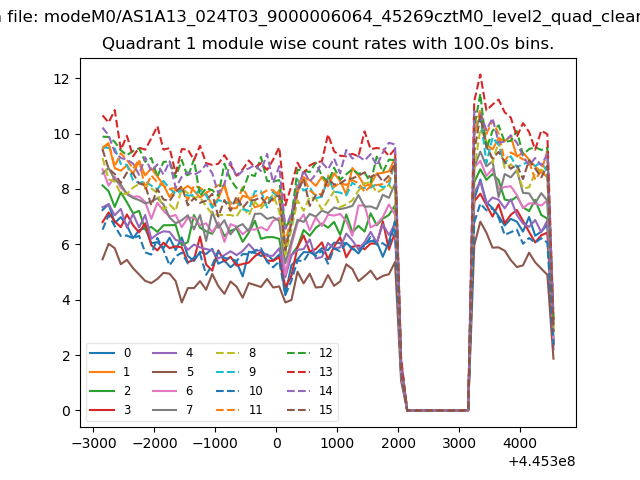
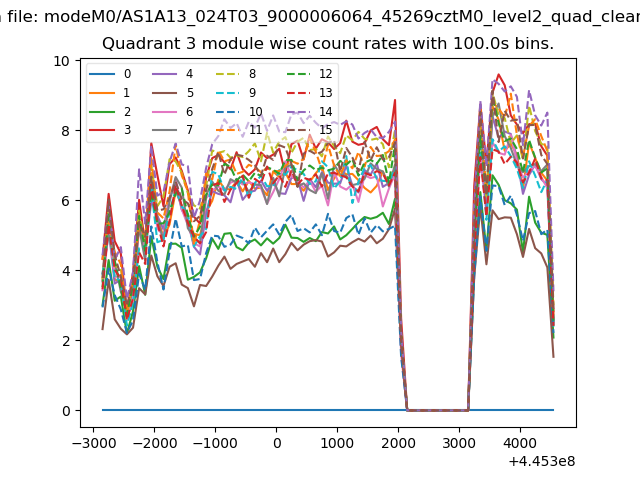
| Module-wise count rates for Quadrant A Data is divided into 100 sec bins |
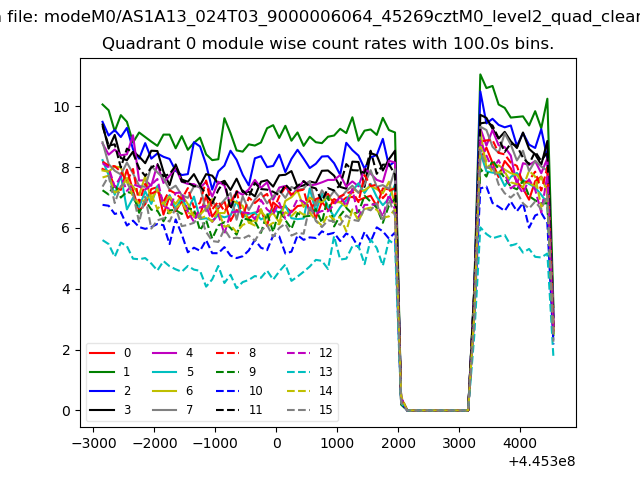 |
 |
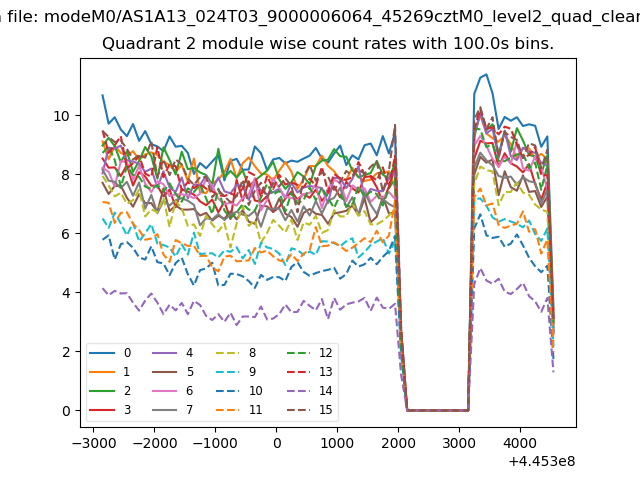
| Module-wise count rates for Quadrant B Data is divided into 100 sec bins |
 |
 |
| Module-wise count rates for Quadrant C Data is divided into 100 sec bins |
 |
 |
| Module-wise count rates for Quadrant D Data is divided into 100 sec bins |
 |
 |
| Parameter | Plot |
|---|---|
| CZT HV Monitor | 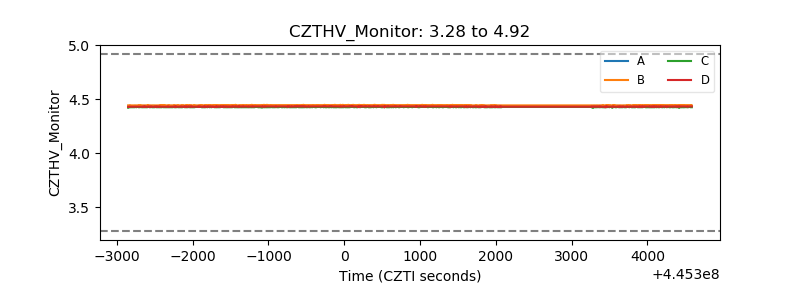 |
| D_VDD | 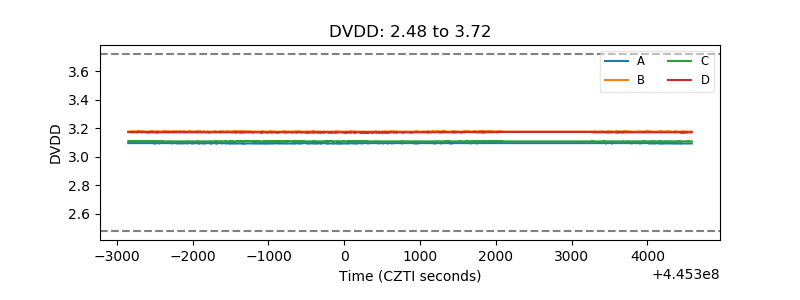 |
| Temperature 1 | 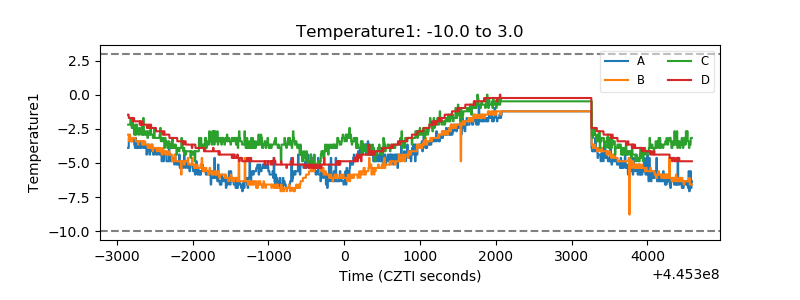 |
| Veto HV Monitor | 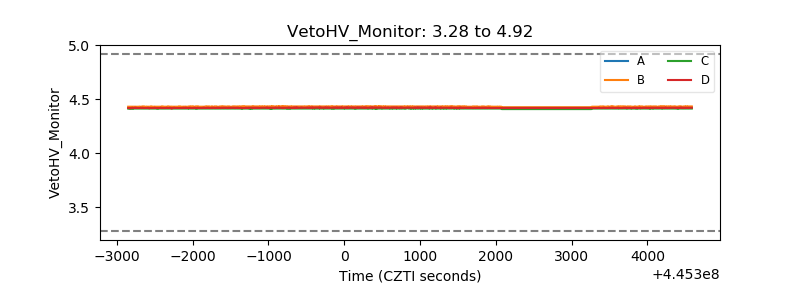 |
| Veto LLD | 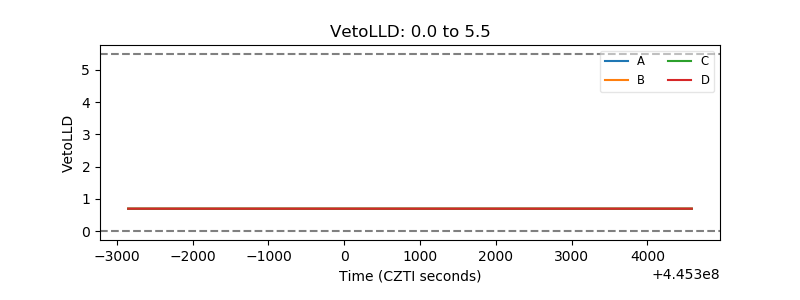 |
| Alpha Counter | 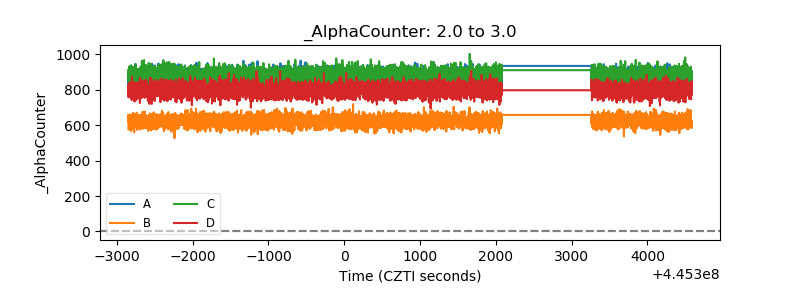 |
| _CPM_Rate | 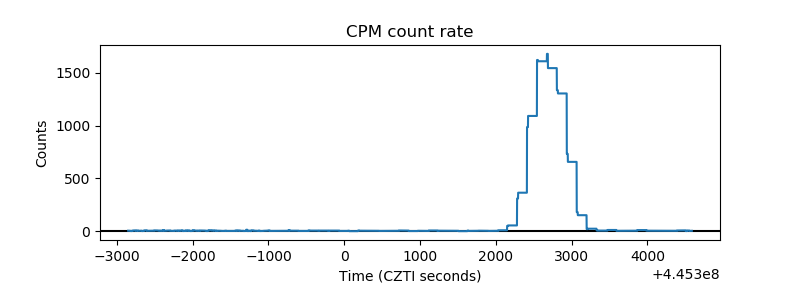 |
| CZT Counter | 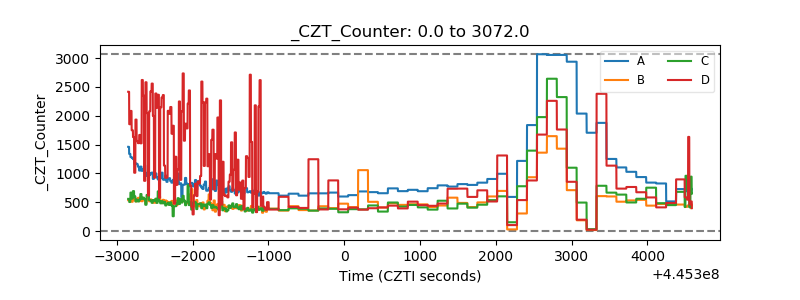 |
| +2.5 Volts monitor | 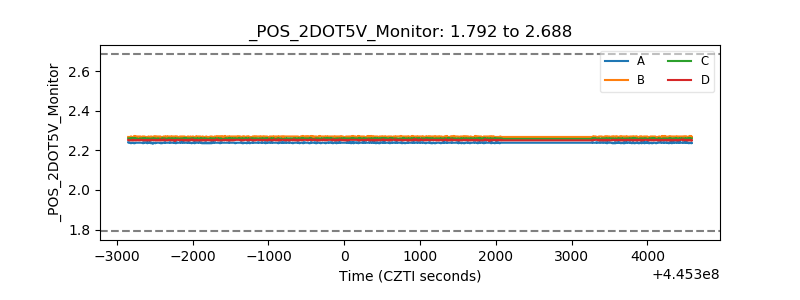 |
| +5 Volts monitor | 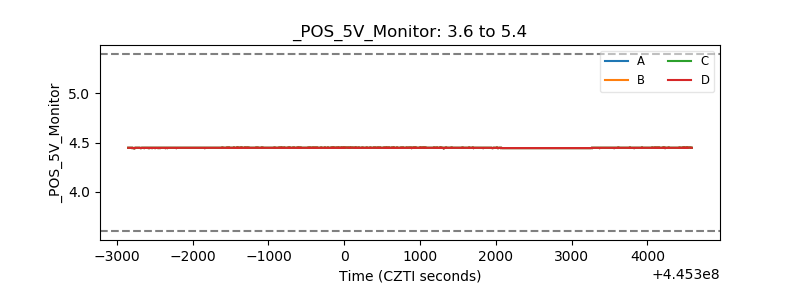 |
| _ROLL_ROT | 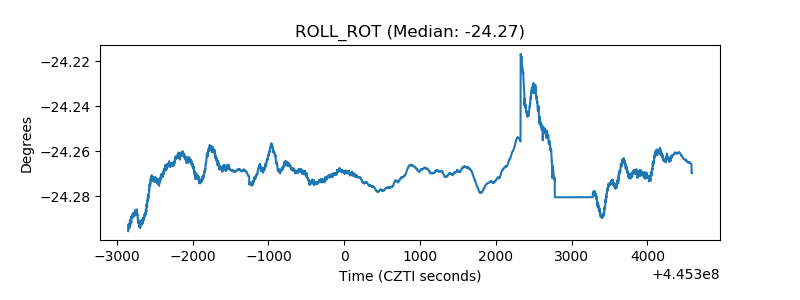 |
| _Roll_DEC | 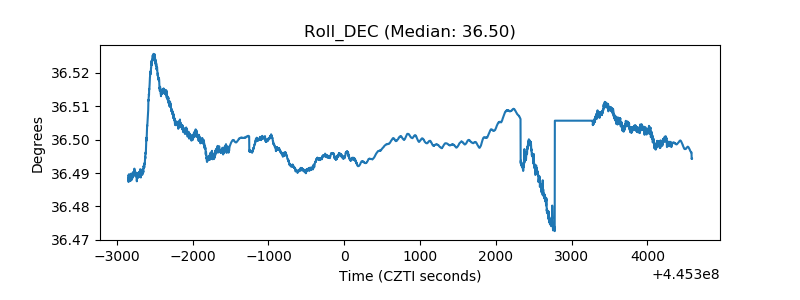 |
| _Roll_RA | 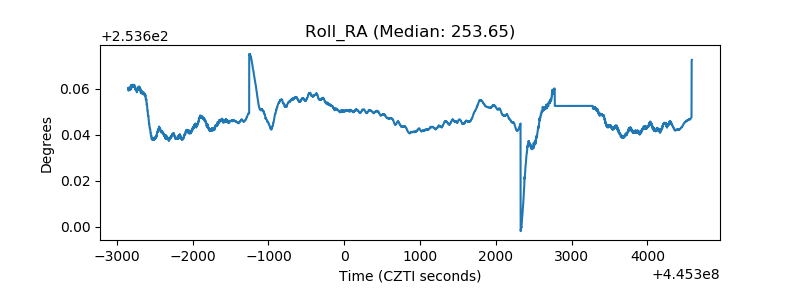 |
| Veto Counter | 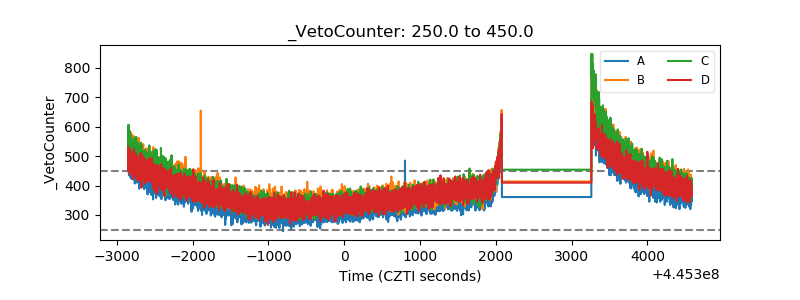 |