| Param | Original file | Final file |
|---|---|---|
| Filename | modeM0/AS1A13_024T03_9000006064_45270cztM0_level2.fits | modeM0/AS1A13_024T03_9000006064_45270cztM0_level2_quad_clean.evt |
| Size (bytes) | 478,402,560 | 109,578,240 |
| Size | 456.2 MB | 104.5 MB |
| Events in quadrant A | 5,352,643 | 736,525 |
| Events in quadrant B | 3,100,682 | 791,118 |
| Events in quadrant C | 3,663,471 | 728,466 |
| Events in quadrant D | 5,105,463 | 624,719 |
| Mode M0 | |||
|---|---|---|---|
| Quadrant | BADHDUFLAG | Total packets | Discarded packets |
| A | 0 | 20706 | 2 |
| B | 0 | 13408 | 3 |
| C | 0 | 15027 | 2 |
| D | 0 | 19698 | 2 |
| Mode SS | |||
|---|---|---|---|
| Quadrant | BADHDUFLAG | Total packets | Discarded packets |
| A | 0 | 126 | 0 |
| B | 0 | 126 | 0 |
| C | 0 | 126 | 0 |
| D | 0 | 126 | 0 |
| Mode M9 | |||
|---|---|---|---|
| Quadrant | BADHDUFLAG | Total packets | Discarded packets |
| A | 0 | 13 | 0 |
| B | 0 | 13 | 0 |
| C | 0 | 13 | 0 |
| D | 0 | 13 | 0 |
| Quadrant | Total seconds | Saturated seconds | Saturation percentage |
|---|---|---|---|
| A | 6268 | 214 | 3.414167% |
| B | 6268 | 49 | 0.781749% |
| C | 6268 | 228 | 3.637524% |
| D | 6268 | 588 | 9.380983% |
Noise dominated data is calculated using 1-second bins in cleaned event files. If a bin has >2000 counts, and if more than 50% of those come from <1% of pixels, then it is considered to be noise-dominated and hence unusable.
| Quadrant | # 1 sec bins | Bins with >0 counts | Bins with >2000 counts | High rate bins dominated by noise | Noise dominated (total time) | Noise dominated (detector-on time) | Marked lightcurve |
|---|---|---|---|---|---|---|---|
| A | 7523 | 6269 | 64 | 64 | 0.85% | 1.02% | 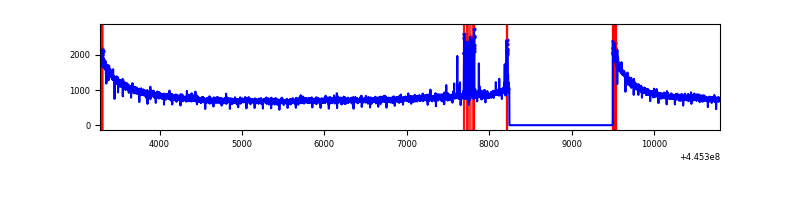 |
| B | 7523 | 6269 | 11 | 11 | 0.15% | 0.18% | 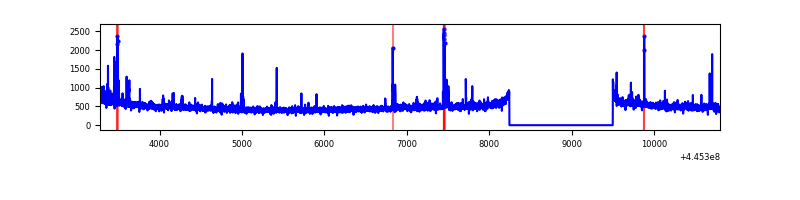 |
| C | 7523 | 6268 | 189 | 189 | 2.51% | 3.02% | 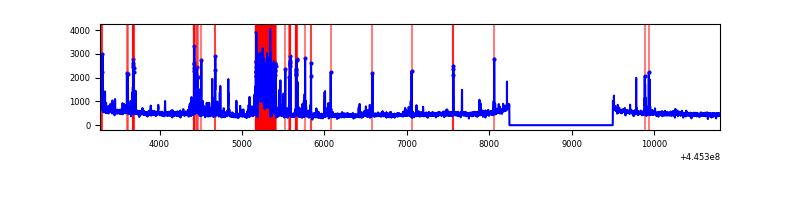 |
| D | 7523 | 6269 | 546 | 546 | 7.26% | 8.71% | 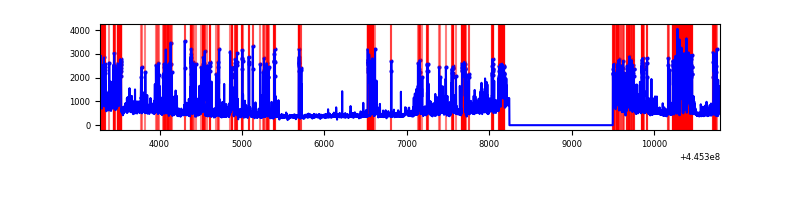 |
Top three noisy pixels from each quadrant. If the there are fewer than three noisy pixels in the level2.evt file, extra rows are filled as -1
| Pixel properties | Quadrant properties | ||||||
|---|---|---|---|---|---|---|---|
| Quadrant | DetID | PixID | Counts | Sigma | Mean | Median | Sigma |
| A | 10 | 83 | 2421405 | 15959.82 | 732 | 718 | 151.7 |
| A | 13 | 248 | 92652 | 606.13 | 732 | 718 | 151.7 |
| A | 13 | 254 | 9266 | 56.36 | 732 | 718 | 151.7 |
| B | 4 | 171 | 43196 | 293.77 | 745 | 724 | 144.6 |
| B | 5 | 255 | 26690 | 179.6 | 745 | 724 | 144.6 |
| B | 5 | 172 | 25515 | 171.47 | 745 | 724 | 144.6 |
| C | 14 | 254 | 551002 | 3281.38 | 718 | 724 | 167.7 |
| C | 12 | 2 | 256464 | 1525.01 | 718 | 724 | 167.7 |
| C | 3 | 233 | 31303 | 182.35 | 718 | 724 | 167.7 |
| D | 13 | 249 | 697608 | 3985.51 | 689 | 667 | 174.9 |
| D | 9 | 49 | 429650 | 2453.17 | 689 | 667 | 174.9 |
| D | 2 | 249 | 427784 | 2442.5 | 689 | 667 | 174.9 |
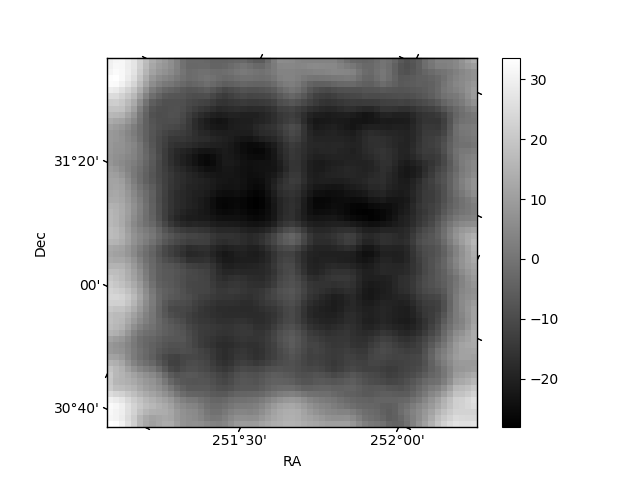
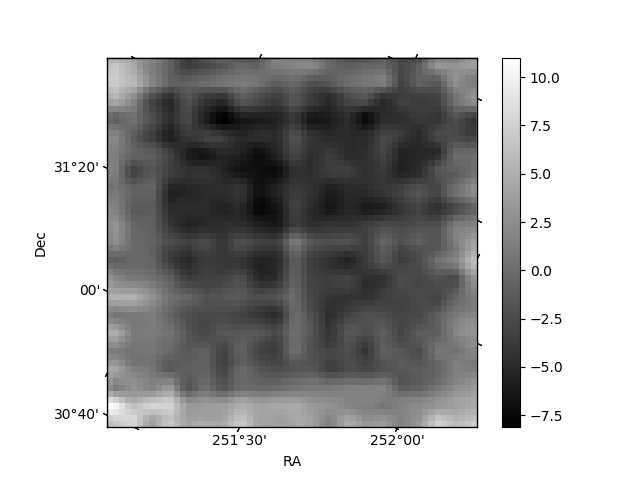
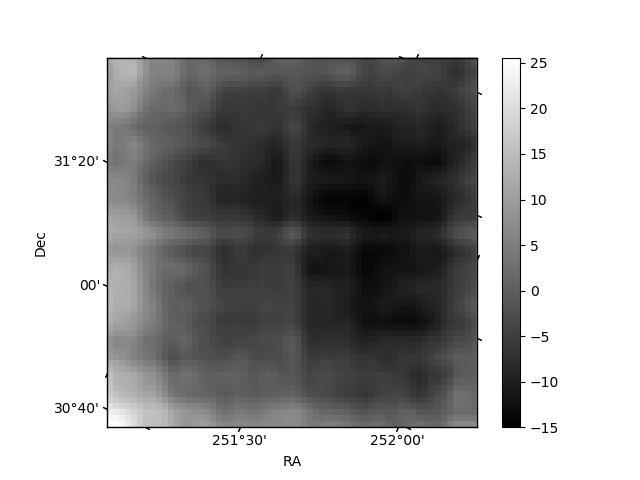
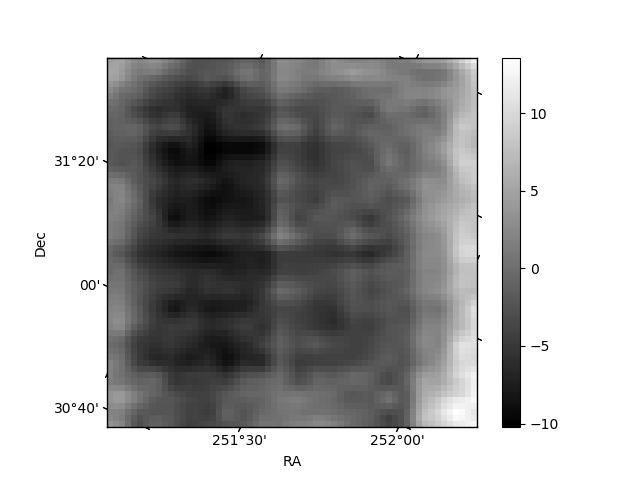
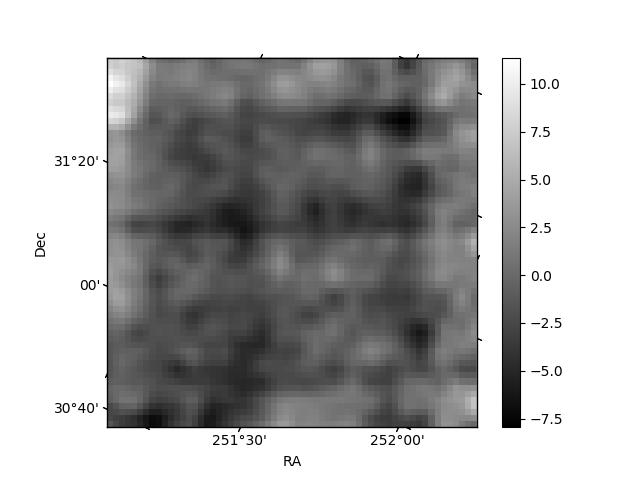
Histogram calculated using DETX and DETY for each event in the final _common_clean file
| Quadrant A | 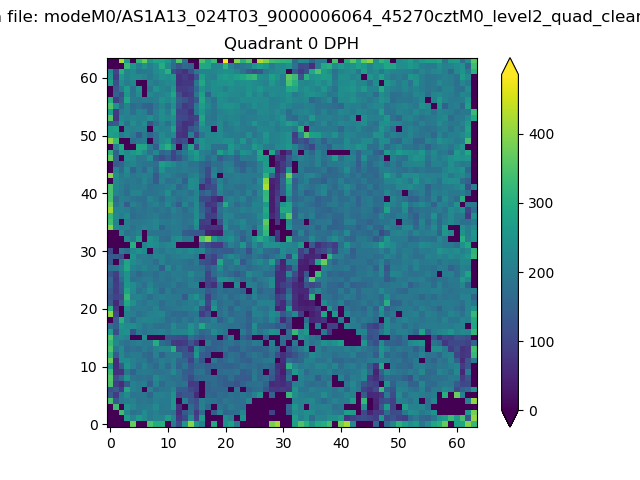 |
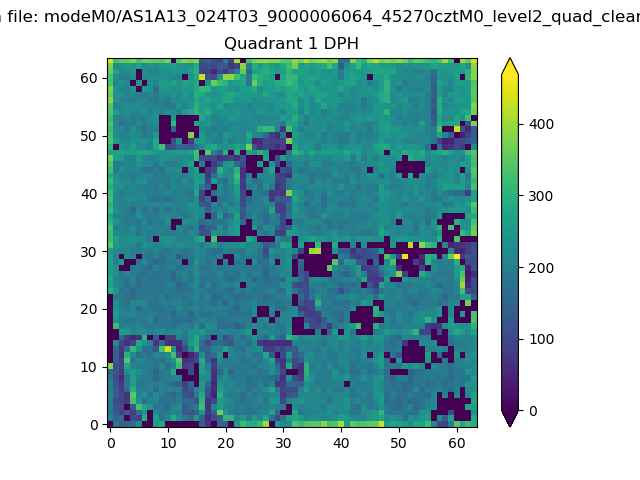 |
Quadrant B |
|---|---|---|---|
| Quadrant D | 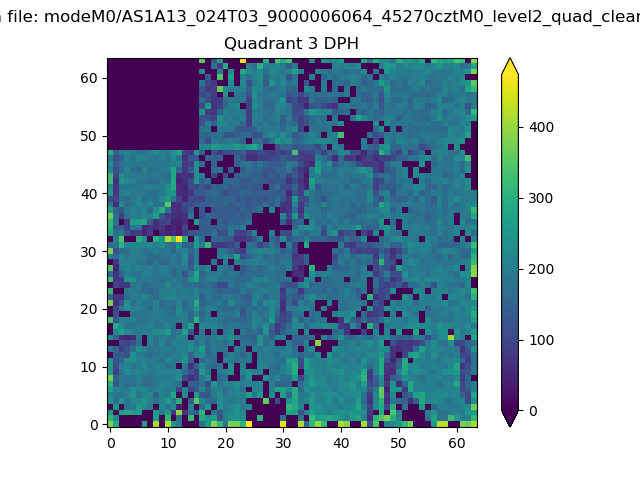 |
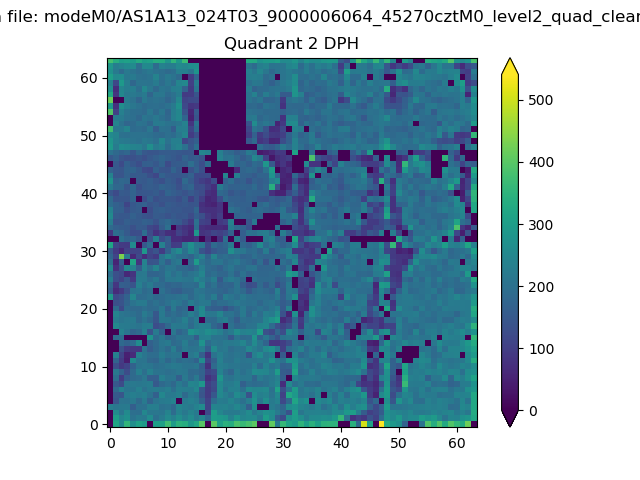 |
Quadrant C |
| Plot type | Count rate plots | Images |
|---|---|---|
| Comparison with Poisson distribution Blue bars denote a histogram of data divided into 1 sec bins. Red curve is a Poisson curve with rate = median count rate of data. |
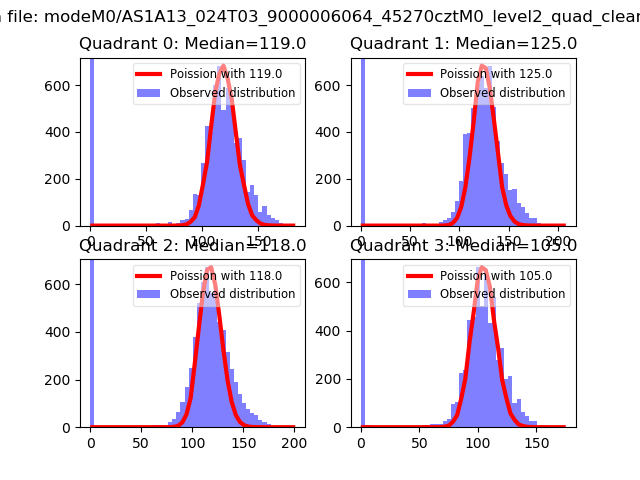 |
 |
| Quadrant-wise count rates Data is divided into 100 sec bins |
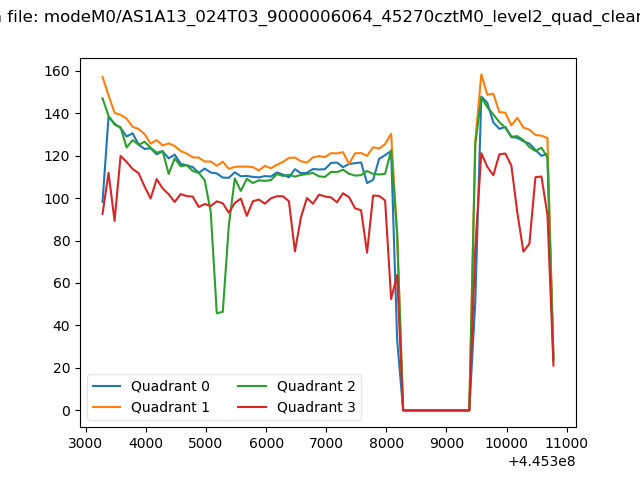 |
|
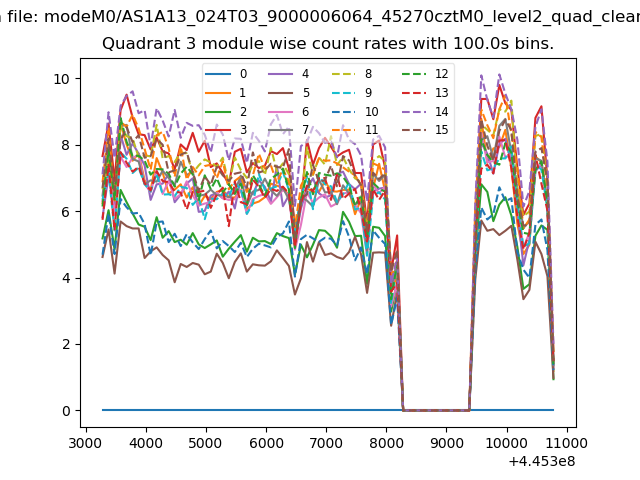
| Module-wise count rates for Quadrant A Data is divided into 100 sec bins |
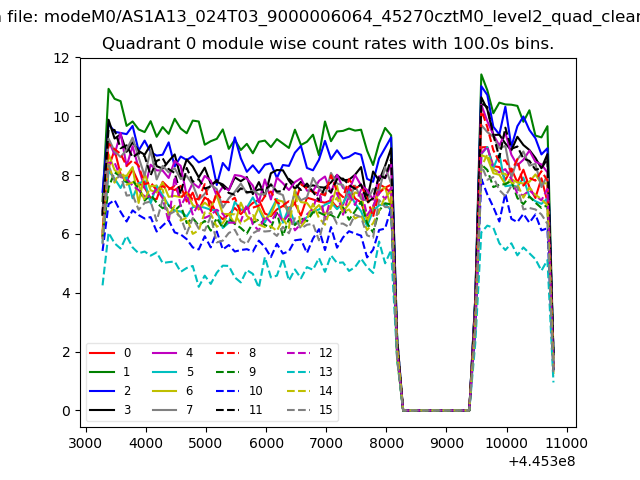 |
 |
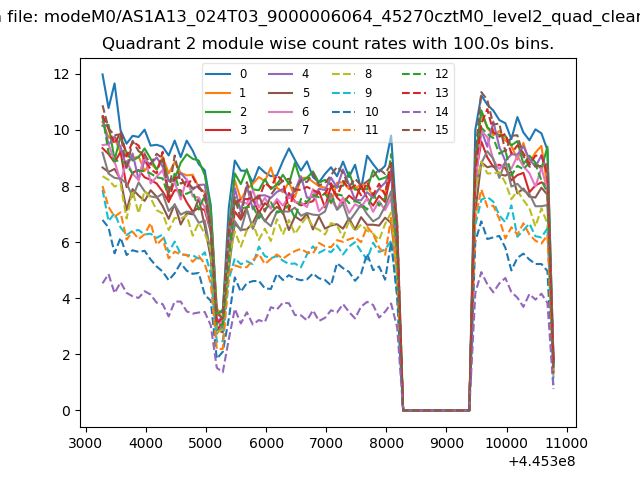
| Module-wise count rates for Quadrant B Data is divided into 100 sec bins |
 |
 |
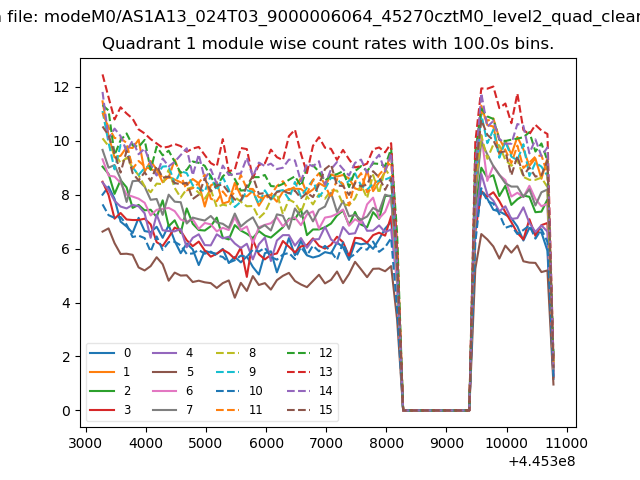
| Module-wise count rates for Quadrant C Data is divided into 100 sec bins |
 |
 |
| Module-wise count rates for Quadrant D Data is divided into 100 sec bins |
 |
 |
| Parameter | Plot |
|---|---|
| CZT HV Monitor | 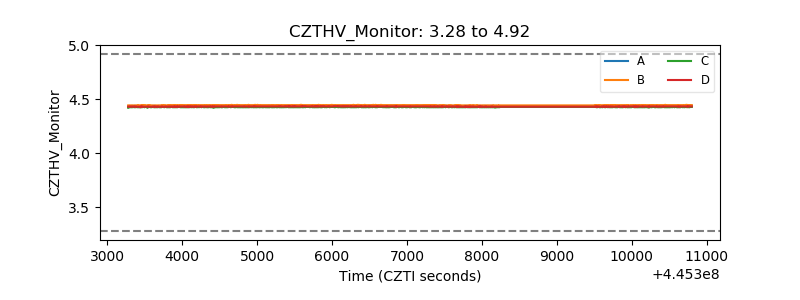 |
| D_VDD | 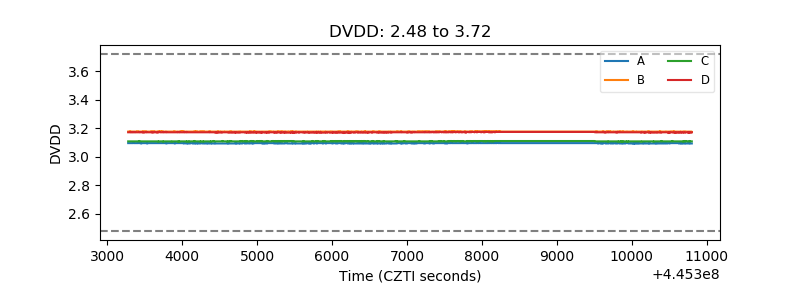 |
| Temperature 1 | 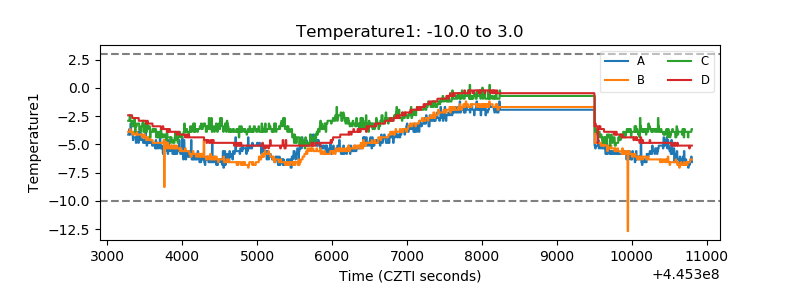 |
| Veto HV Monitor | 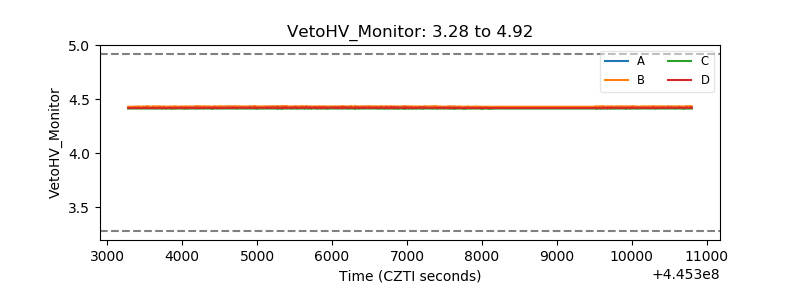 |
| Veto LLD | 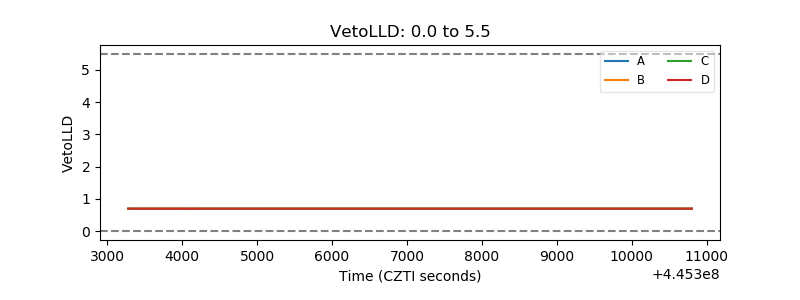 |
| Alpha Counter | 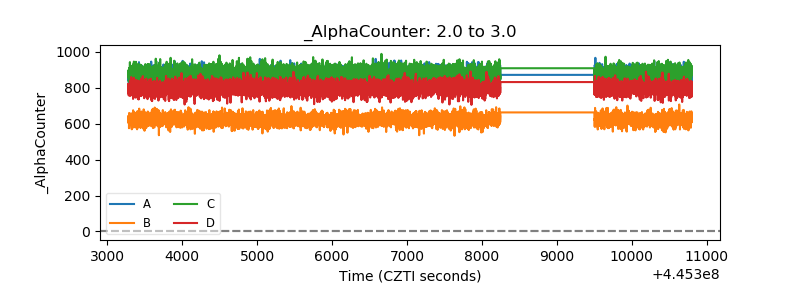 |
| _CPM_Rate | 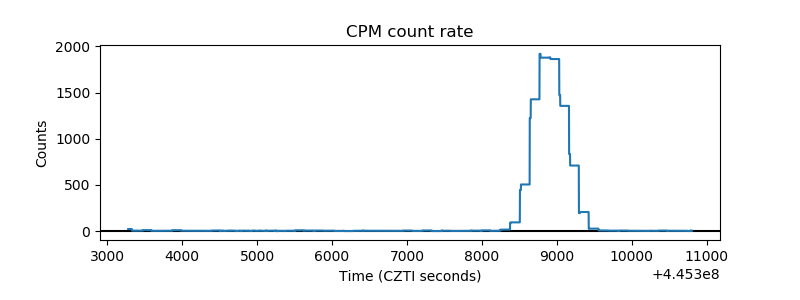 |
| CZT Counter | 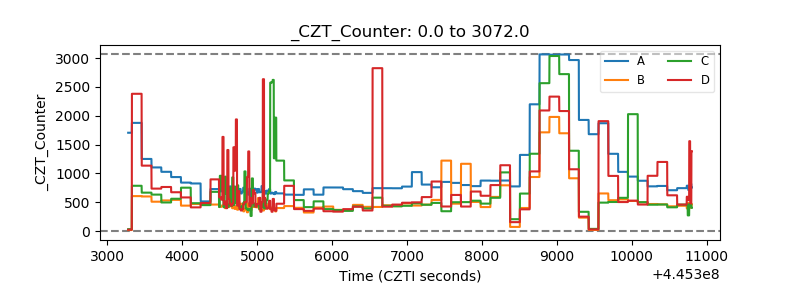 |
| +2.5 Volts monitor | 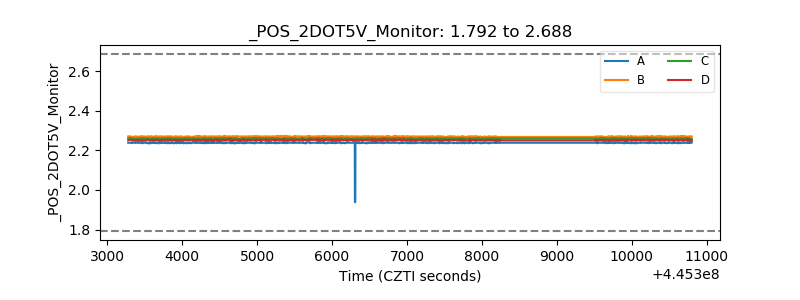 |
| +5 Volts monitor | 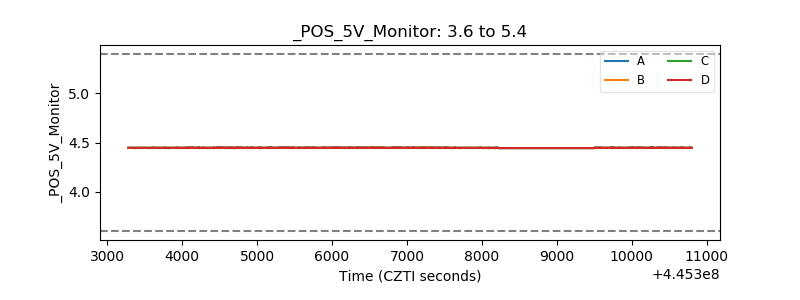 |
| _ROLL_ROT | 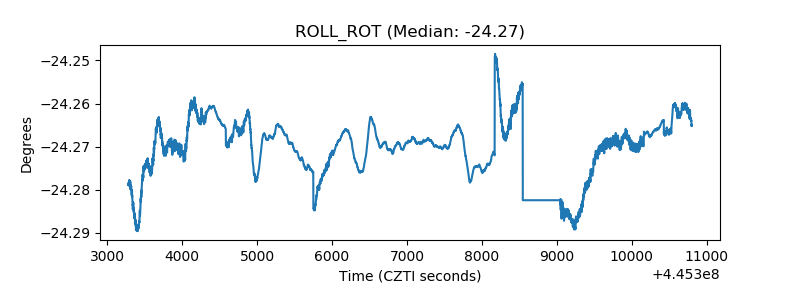 |
| _Roll_DEC | 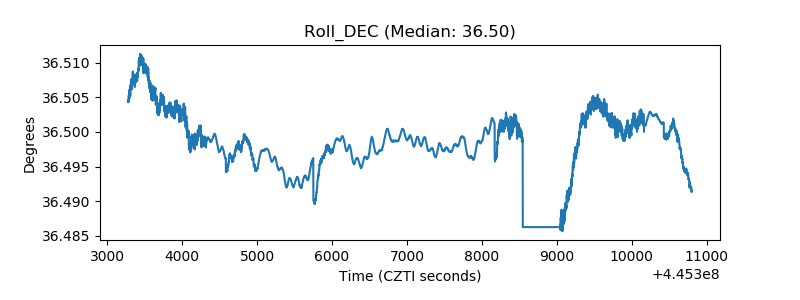 |
| _Roll_RA | 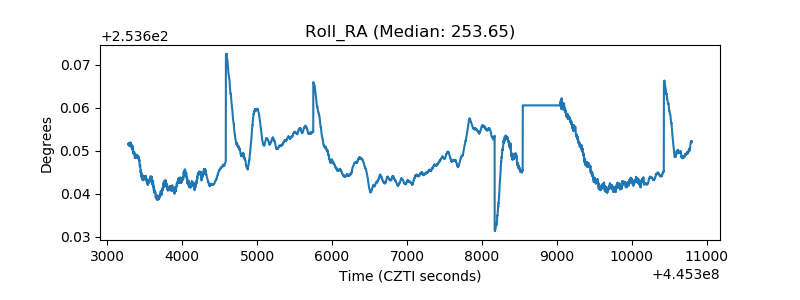 |
| Veto Counter | 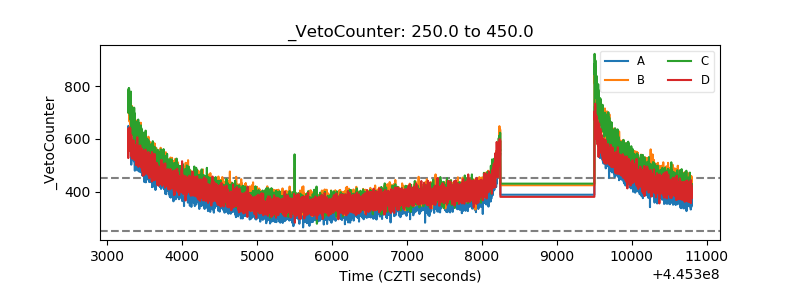 |