| Param | Original file | Final file |
|---|---|---|
| Filename | modeM0/AS1A13_024T03_9000006064_45271cztM0_level2.fits | modeM0/AS1A13_024T03_9000006064_45271cztM0_level2_quad_clean.evt |
| Size (bytes) | 500,063,040 | 118,025,280 |
| Size | 476.9 MB | 112.6 MB |
| Events in quadrant A | 5,633,465 | 792,860 |
| Events in quadrant B | 3,389,075 | 849,352 |
| Events in quadrant C | 3,227,701 | 802,537 |
| Events in quadrant D | 5,744,895 | 666,040 |
| Mode M0 | |||
|---|---|---|---|
| Quadrant | BADHDUFLAG | Total packets | Discarded packets |
| A | 0 | 21696 | 2 |
| B | 0 | 14495 | 2 |
| C | 0 | 14209 | 3 |
| D | 0 | 21721 | 2 |
| Mode SS | |||
|---|---|---|---|
| Quadrant | BADHDUFLAG | Total packets | Discarded packets |
| A | 0 | 134 | 0 |
| B | 0 | 134 | 0 |
| C | 0 | 134 | 0 |
| D | 0 | 134 | 0 |
| Mode M9 | |||
|---|---|---|---|
| Quadrant | BADHDUFLAG | Total packets | Discarded packets |
| A | 0 | 17 | 0 |
| B | 0 | 18 | 0 |
| C | 0 | 18 | 0 |
| D | 0 | 18 | 0 |
| Quadrant | Total seconds | Saturated seconds | Saturation percentage |
|---|---|---|---|
| A | 6647 | 178 | 2.677900% |
| B | 6647 | 83 | 1.248684% |
| C | 6646 | 25 | 0.376166% |
| D | 6646 | 620 | 9.328920% |
Noise dominated data is calculated using 1-second bins in cleaned event files. If a bin has >2000 counts, and if more than 50% of those come from <1% of pixels, then it is considered to be noise-dominated and hence unusable.
| Quadrant | # 1 sec bins | Bins with >0 counts | Bins with >2000 counts | High rate bins dominated by noise | Noise dominated (total time) | Noise dominated (detector-on time) | Marked lightcurve |
|---|---|---|---|---|---|---|---|
| A | 7902 | 6647 | 34 | 34 | 0.43% | 0.51% | 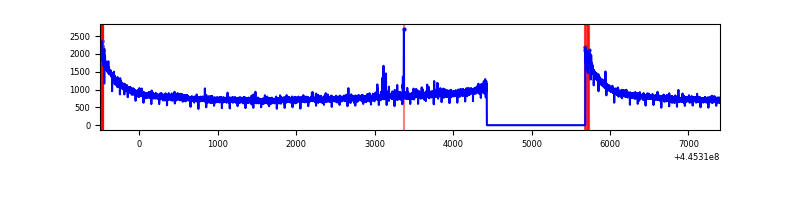 |
| B | 7902 | 6648 | 36 | 36 | 0.46% | 0.54% | 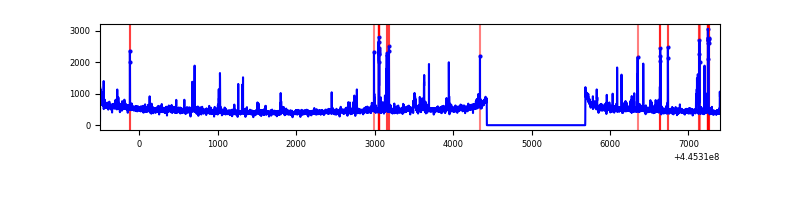 |
| C | 7901 | 6647 | 18 | 18 | 0.23% | 0.27% | 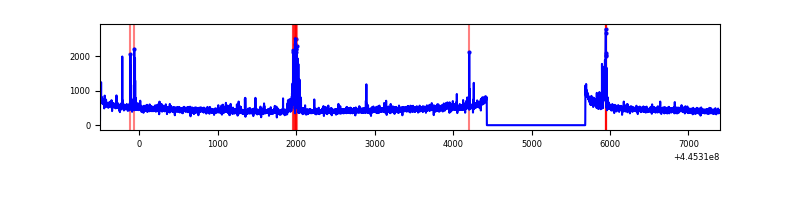 |
| D | 7901 | 6646 | 578 | 578 | 7.32% | 8.70% | 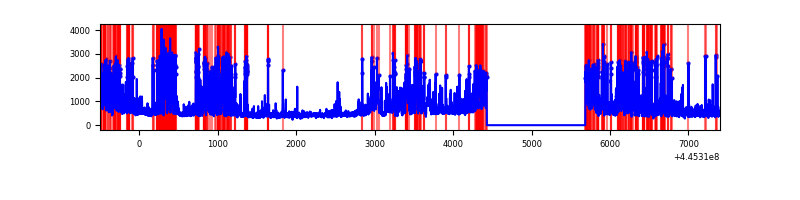 |
Top three noisy pixels from each quadrant. If the there are fewer than three noisy pixels in the level2.evt file, extra rows are filled as -1
| Pixel properties | Quadrant properties | ||||||
|---|---|---|---|---|---|---|---|
| Quadrant | DetID | PixID | Counts | Sigma | Mean | Median | Sigma |
| A | 10 | 83 | 2596712 | 16351.18 | 777 | 762 | 158.8 |
| A | 13 | 248 | 26449 | 161.8 | 777 | 762 | 158.8 |
| A | 13 | 254 | 9180 | 53.02 | 777 | 762 | 158.8 |
| B | 4 | 171 | 131380 | 854.04 | 790 | 769 | 152.9 |
| B | 5 | 255 | 62297 | 402.32 | 790 | 769 | 152.9 |
| B | 0 | 168 | 31907 | 203.6 | 790 | 769 | 152.9 |
| C | 14 | 254 | 134792 | 739.86 | 773 | 776 | 181.1 |
| C | 12 | 2 | 57656 | 314.02 | 773 | 776 | 181.1 |
| C | 3 | 233 | 19755 | 104.78 | 773 | 776 | 181.1 |
| D | 11 | 241 | 711249 | 3879.9 | 728 | 707 | 183.1 |
| D | 9 | 49 | 648800 | 3538.9 | 728 | 707 | 183.1 |
| D | 13 | 249 | 596588 | 3253.79 | 728 | 707 | 183.1 |
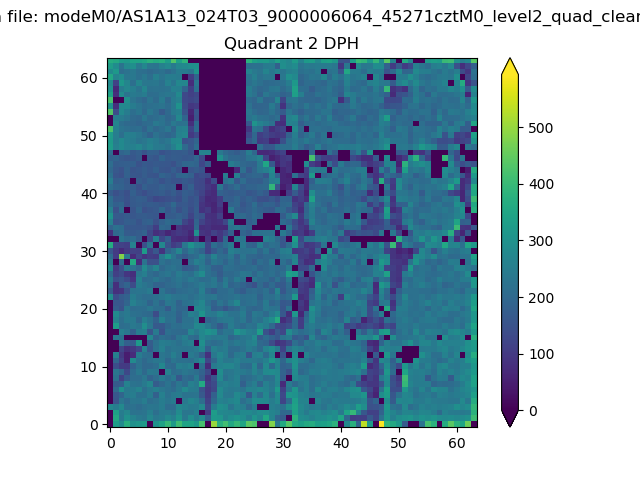
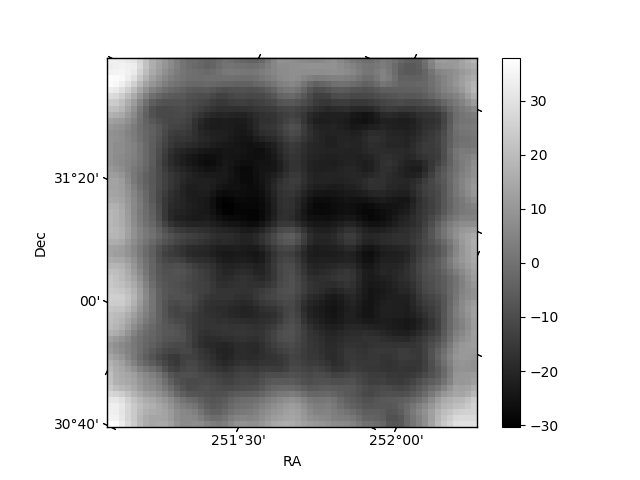
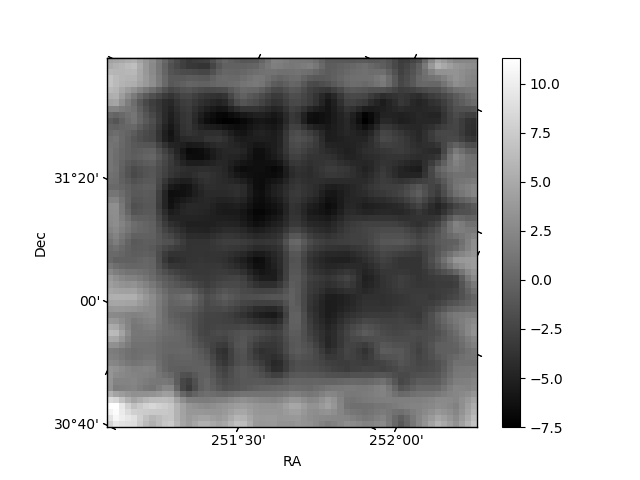
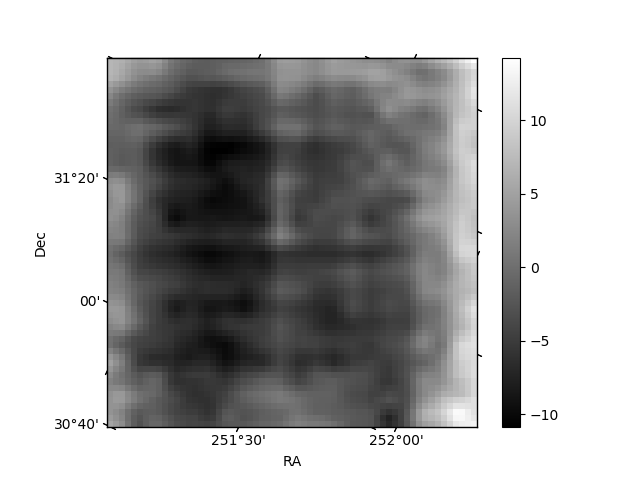
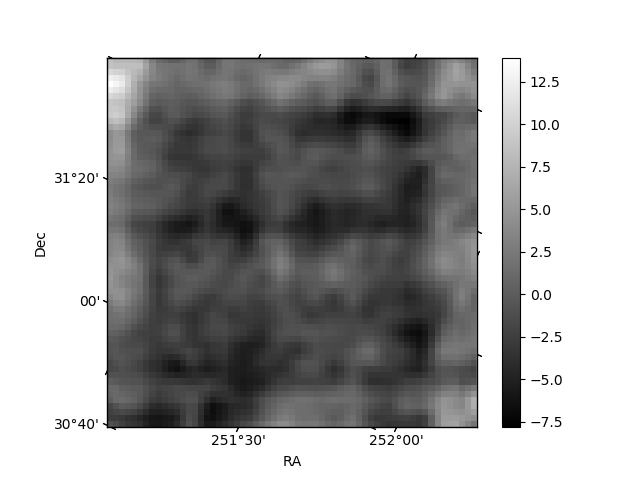
Histogram calculated using DETX and DETY for each event in the final _common_clean file
| Quadrant A | 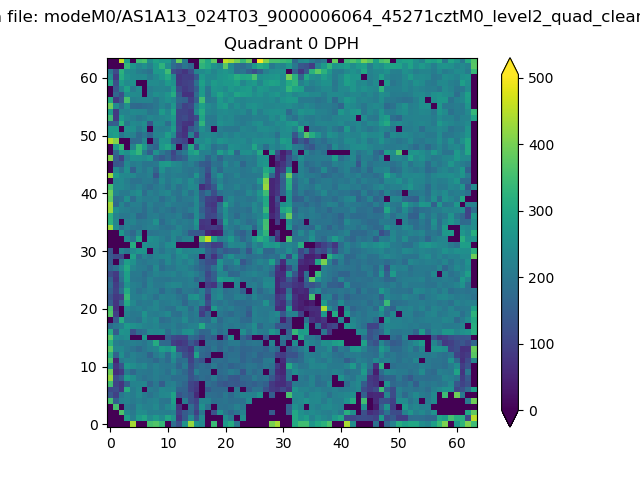 |
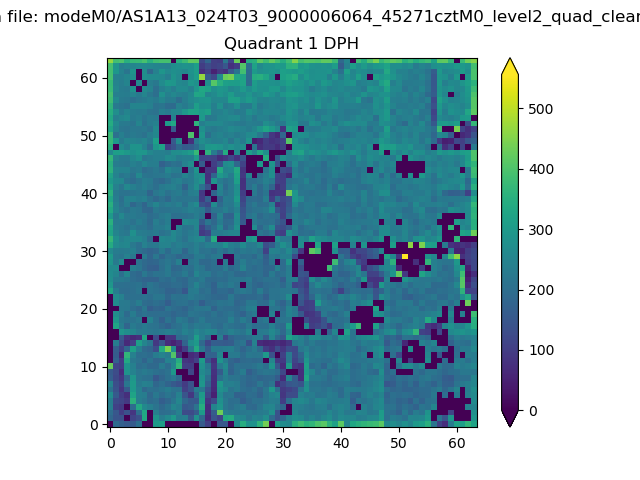 |
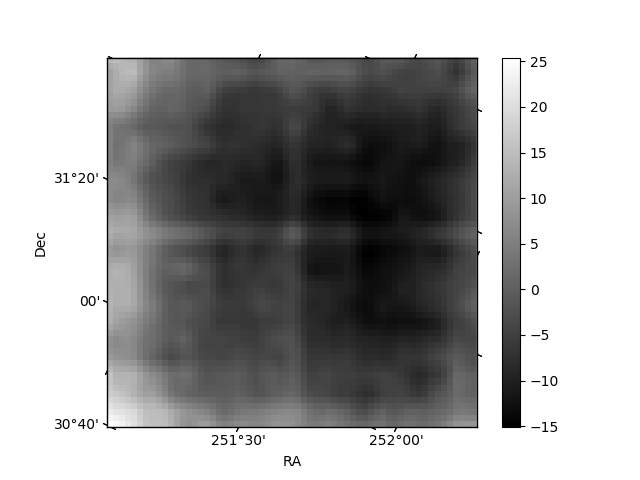
Quadrant B |
|---|---|---|---|
| Quadrant D | 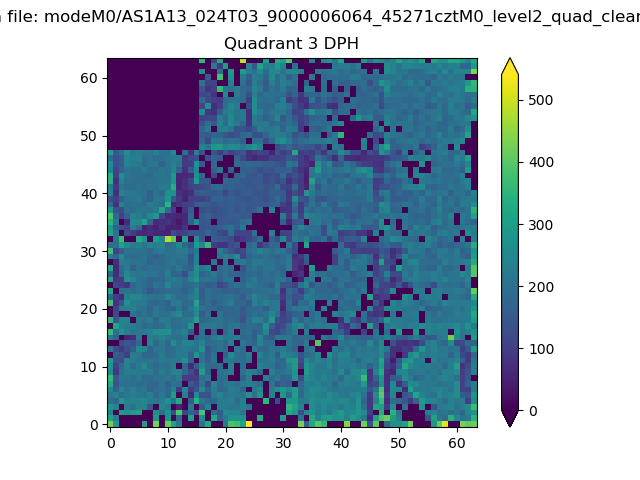 |
 |
Quadrant C |
| Plot type | Count rate plots | Images |
|---|---|---|
| Comparison with Poisson distribution Blue bars denote a histogram of data divided into 1 sec bins. Red curve is a Poisson curve with rate = median count rate of data. |
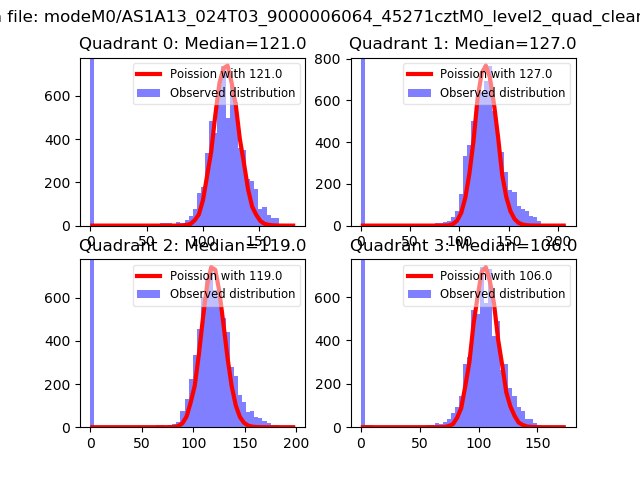 |
 |
| Quadrant-wise count rates Data is divided into 100 sec bins |
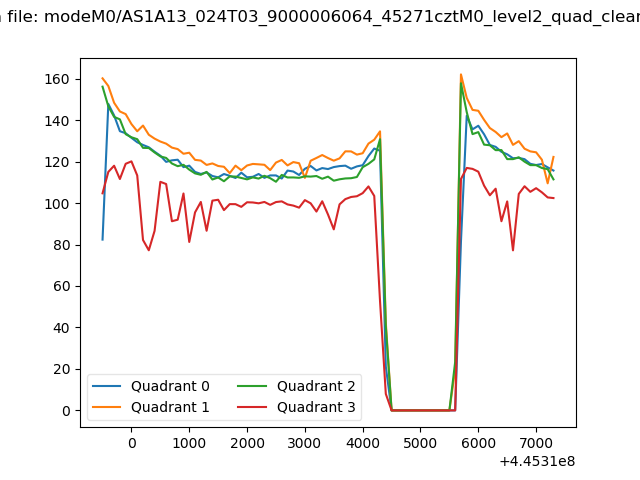 |
|
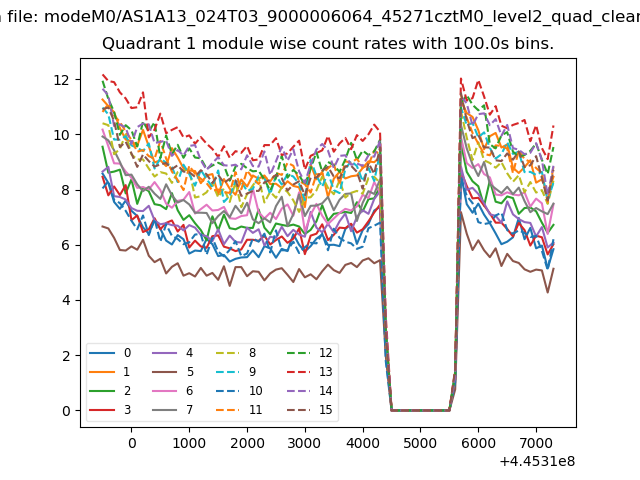
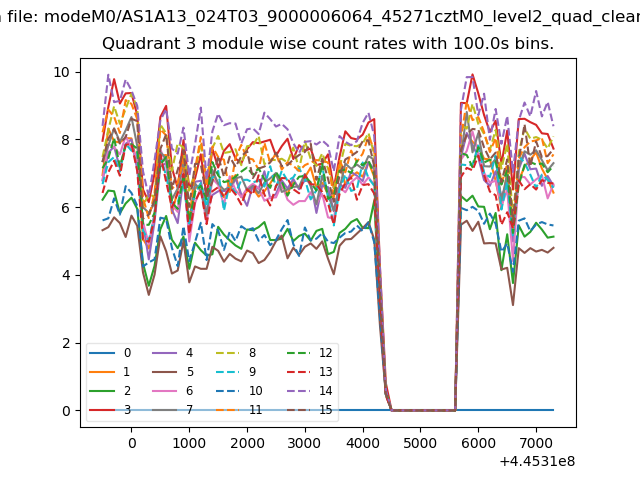
| Module-wise count rates for Quadrant A Data is divided into 100 sec bins |
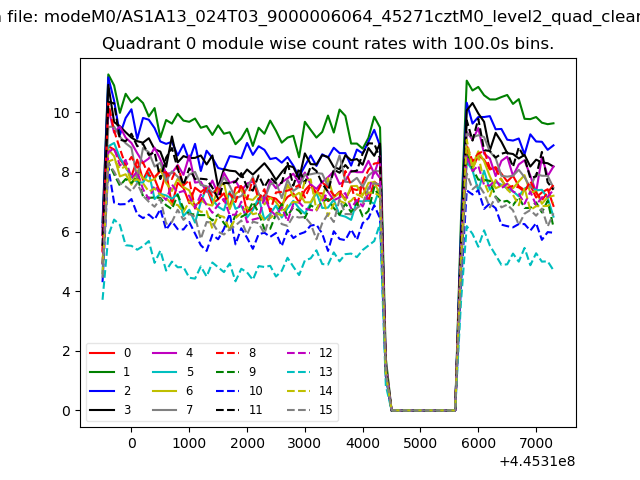 |
 |
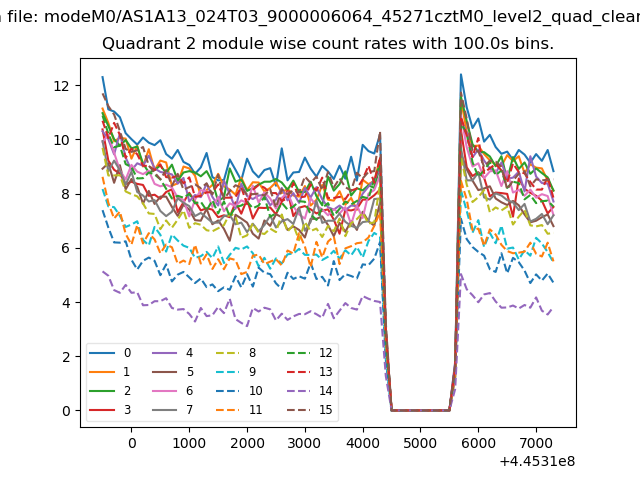
| Module-wise count rates for Quadrant B Data is divided into 100 sec bins |
 |
 |
| Module-wise count rates for Quadrant C Data is divided into 100 sec bins |
 |
 |
| Module-wise count rates for Quadrant D Data is divided into 100 sec bins |
 |
 |
| Parameter | Plot |
|---|---|
| CZT HV Monitor | 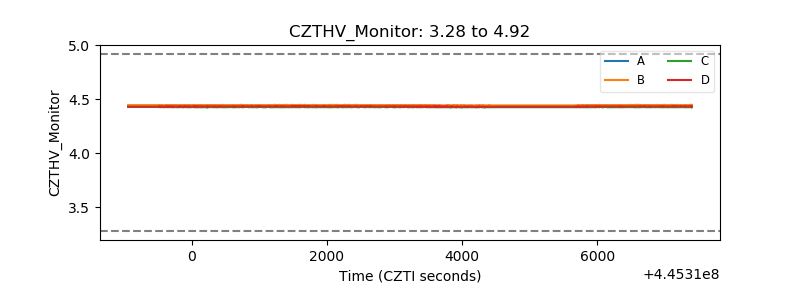 |
| D_VDD | 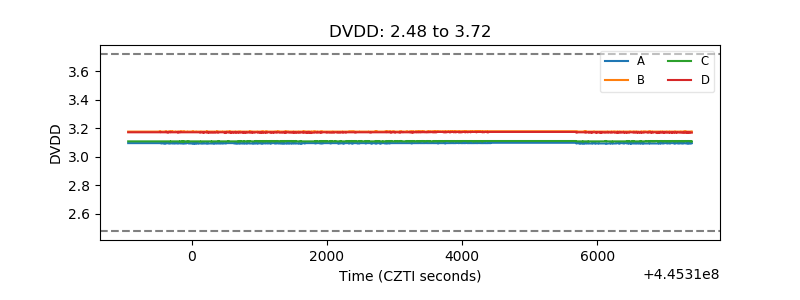 |
| Temperature 1 | 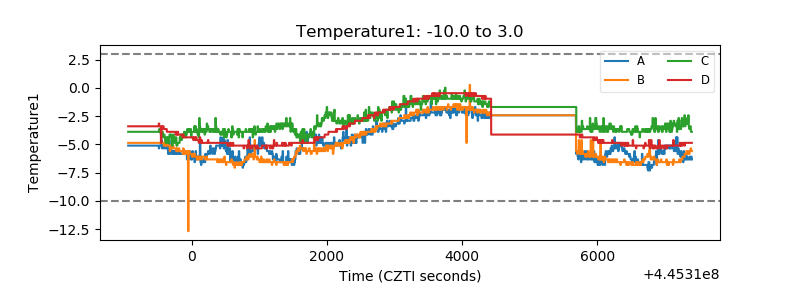 |
| Veto HV Monitor | 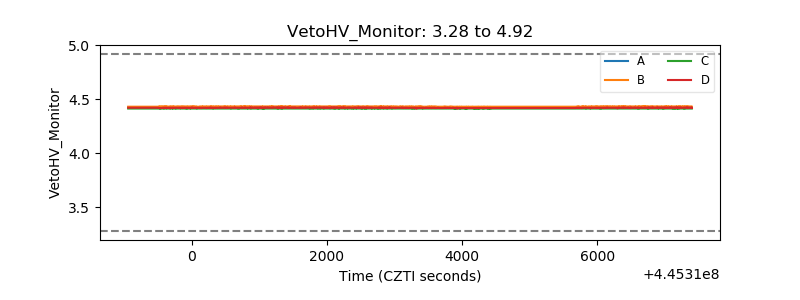 |
| Veto LLD | 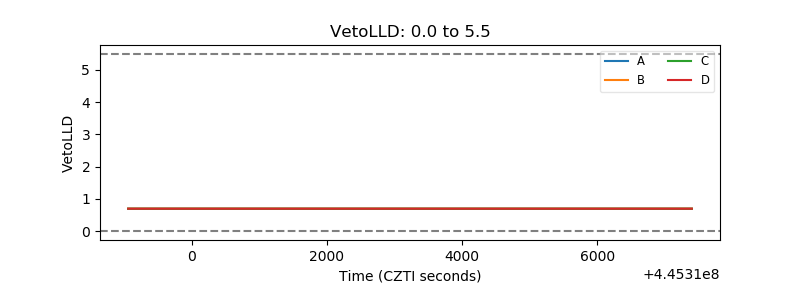 |
| Alpha Counter | 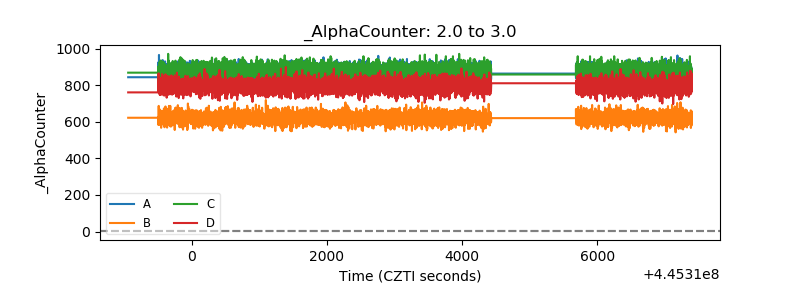 |
| _CPM_Rate | 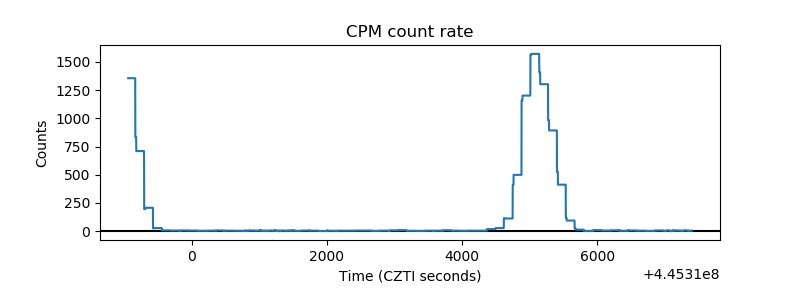 |
| CZT Counter | 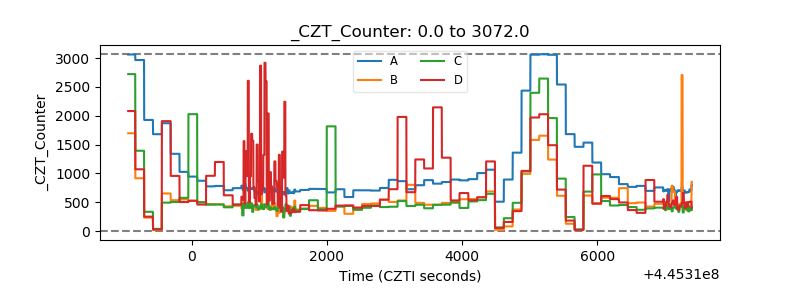 |
| +2.5 Volts monitor | 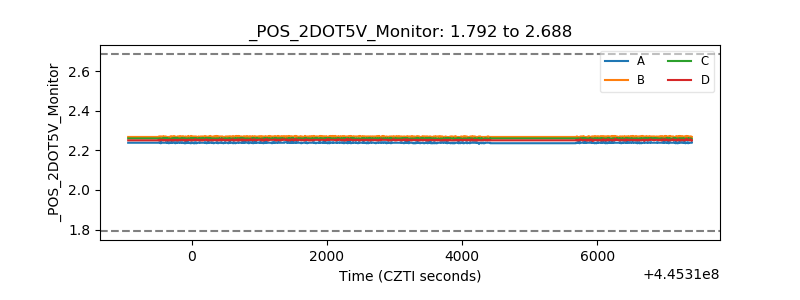 |
| +5 Volts monitor | 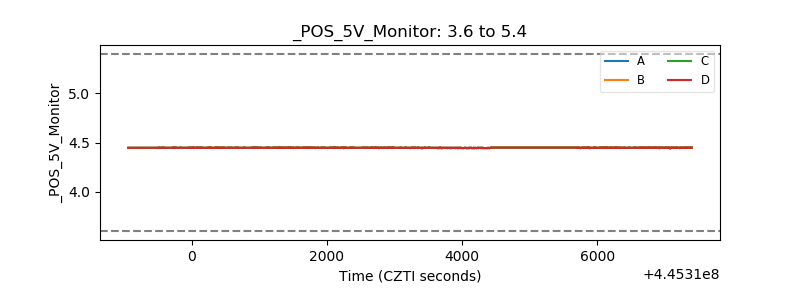 |
| _ROLL_ROT | 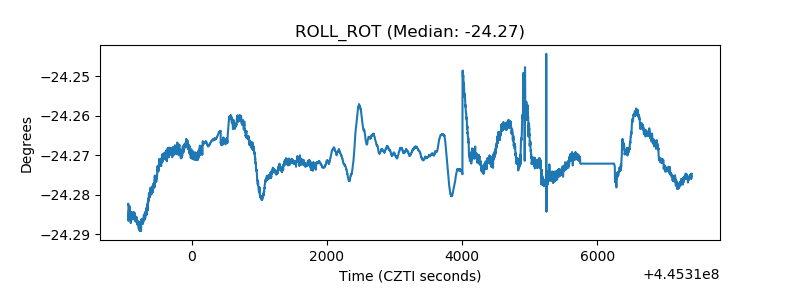 |
| _Roll_DEC | 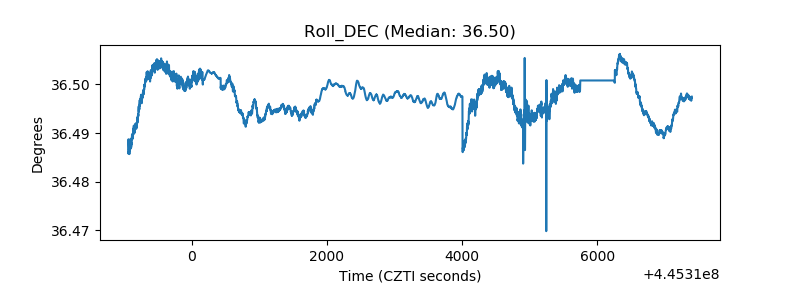 |
| _Roll_RA | 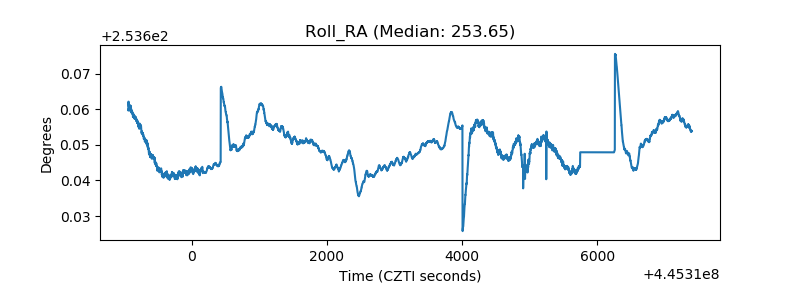 |
| Veto Counter | 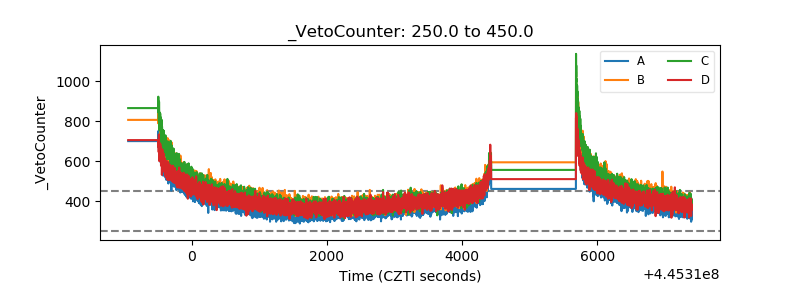 |