| Param | Original file | Final file |
|---|---|---|
| Filename | modeM0/AS1A13_024T03_9000006064_45272cztM0_level2.fits | modeM0/AS1A13_024T03_9000006064_45272cztM0_level2_quad_clean.evt |
| Size (bytes) | 445,348,800 | 105,816,960 |
| Size | 424.7 MB | 100.9 MB |
| Events in quadrant A | 5,015,583 | 714,889 |
| Events in quadrant B | 3,102,432 | 753,223 |
| Events in quadrant C | 2,916,968 | 704,004 |
| Events in quadrant D | 4,972,363 | 602,191 |
| Mode M0 | |||
|---|---|---|---|
| Quadrant | BADHDUFLAG | Total packets | Discarded packets |
| A | 0 | 19527 | 1 |
| B | 0 | 13410 | 1 |
| C | 0 | 13090 | 1 |
| D | 0 | 19096 | 9 |
| Mode SS | |||
|---|---|---|---|
| Quadrant | BADHDUFLAG | Total packets | Discarded packets |
| A | 0 | 126 | 0 |
| B | 0 | 126 | 0 |
| C | 0 | 126 | 0 |
| D | 0 | 126 | 0 |
| Mode M9 | |||
|---|---|---|---|
| Quadrant | BADHDUFLAG | Total packets | Discarded packets |
| A | 0 | 12 | 0 |
| B | 0 | 12 | 0 |
| C | 0 | 12 | 0 |
| D | 0 | 12 | 0 |
| Quadrant | Total seconds | Saturated seconds | Saturation percentage |
|---|---|---|---|
| A | 6156 | 111 | 1.803119% |
| B | 6156 | 104 | 1.689409% |
| C | 6157 | 75 | 1.218126% |
| D | 6154 | 469 | 7.621059% |
Noise dominated data is calculated using 1-second bins in cleaned event files. If a bin has >2000 counts, and if more than 50% of those come from <1% of pixels, then it is considered to be noise-dominated and hence unusable.
| Quadrant | # 1 sec bins | Bins with >0 counts | Bins with >2000 counts | High rate bins dominated by noise | Noise dominated (total time) | Noise dominated (detector-on time) | Marked lightcurve |
|---|---|---|---|---|---|---|---|
| A | 7366 | 6156 | 13 | 13 | 0.18% | 0.21% | 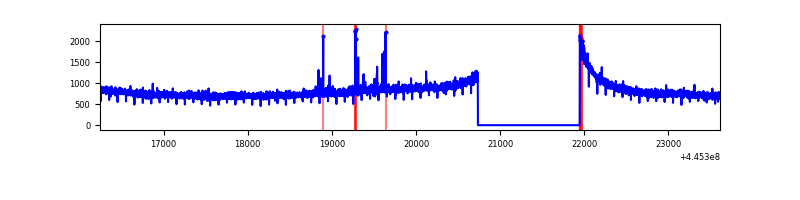 |
| B | 7366 | 6156 | 47 | 47 | 0.64% | 0.76% | 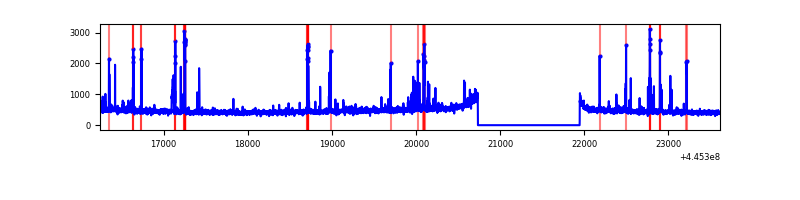 |
| C | 7367 | 6158 | 22 | 22 | 0.30% | 0.36% | 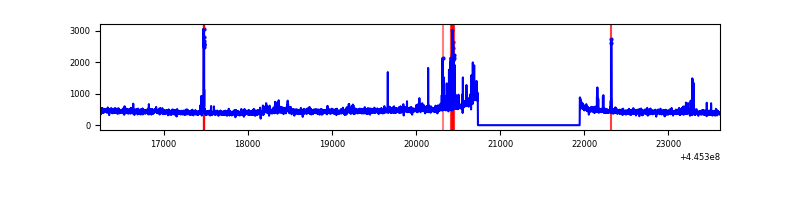 |
| D | 7367 | 6156 | 482 | 482 | 6.54% | 7.83% | 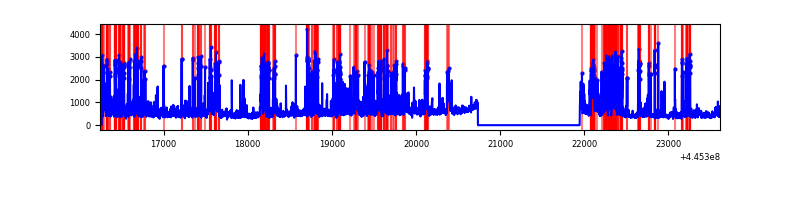 |
Top three noisy pixels from each quadrant. If the there are fewer than three noisy pixels in the level2.evt file, extra rows are filled as -1
| Pixel properties | Quadrant properties | ||||||
|---|---|---|---|---|---|---|---|
| Quadrant | DetID | PixID | Counts | Sigma | Mean | Median | Sigma |
| A | 10 | 83 | 2252217 | 15413.19 | 702 | 686 | 146.1 |
| A | 13 | 248 | 34687 | 232.76 | 702 | 686 | 146.1 |
| A | 7 | 16 | 14053 | 91.51 | 702 | 686 | 146.1 |
| B | 4 | 171 | 208353 | 1485.1 | 708 | 687 | 139.8 |
| B | 7 | 221 | 26176 | 182.28 | 708 | 687 | 139.8 |
| B | 12 | 111 | 17045 | 116.98 | 708 | 687 | 139.8 |
| C | 12 | 2 | 100427 | 621.13 | 688 | 691 | 160.6 |
| C | 14 | 254 | 97129 | 600.59 | 688 | 691 | 160.6 |
| C | 3 | 233 | 24623 | 149.04 | 688 | 691 | 160.6 |
| D | 13 | 249 | 1035107 | 6291.54 | 659 | 640 | 164.4 |
| D | 2 | 249 | 549836 | 3340.17 | 659 | 640 | 164.4 |
| D | 11 | 241 | 367829 | 2233.21 | 659 | 640 | 164.4 |
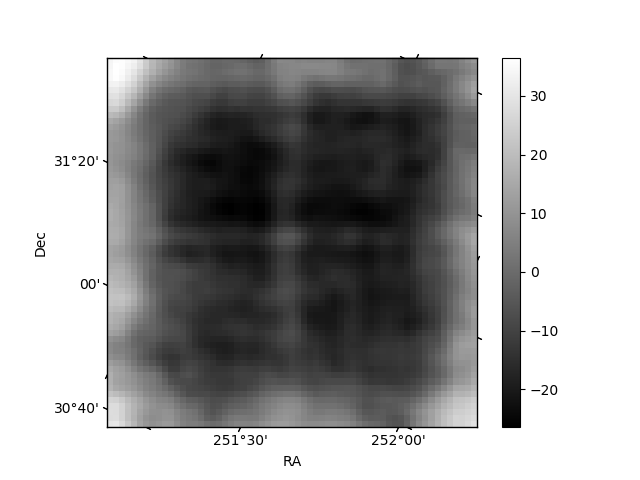
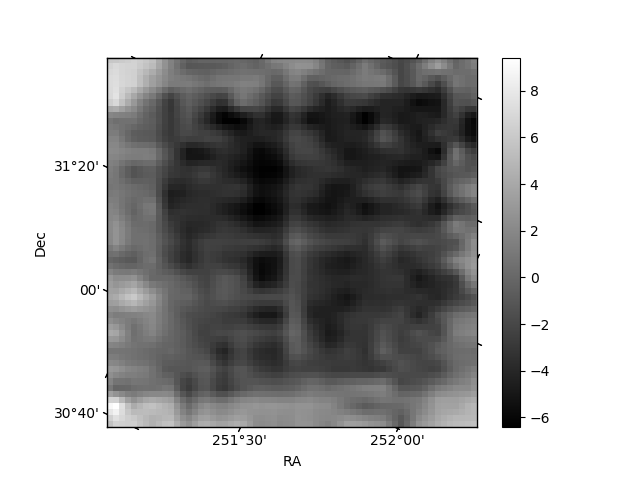
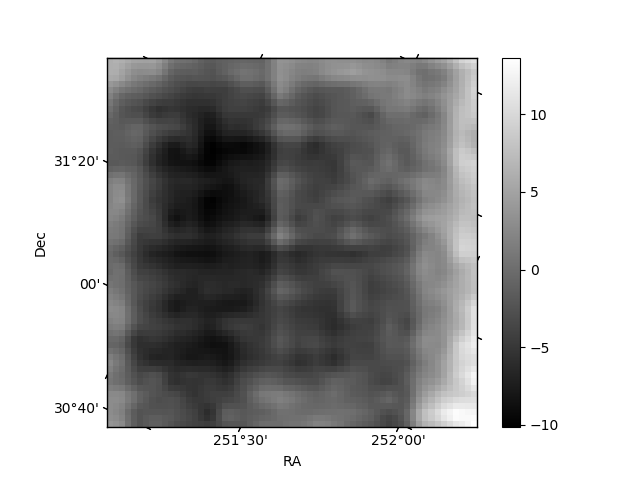
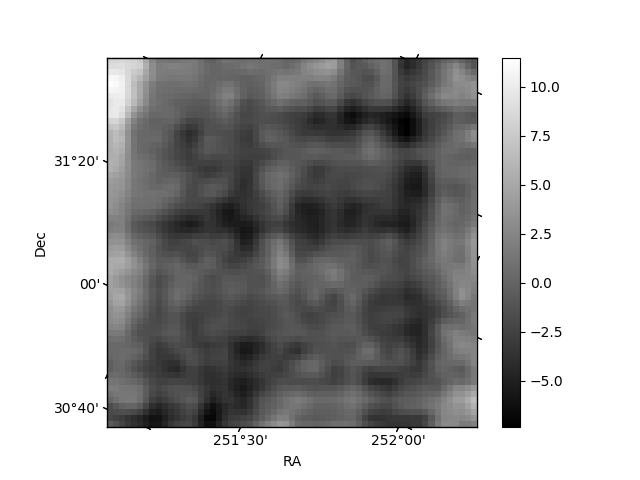
Histogram calculated using DETX and DETY for each event in the final _common_clean file
| Quadrant A | 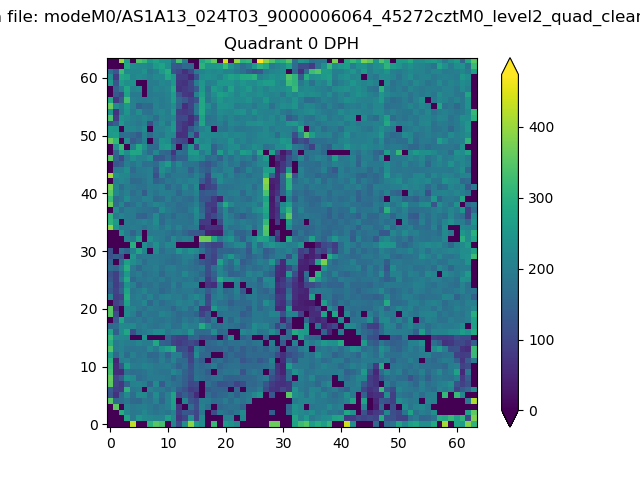 |
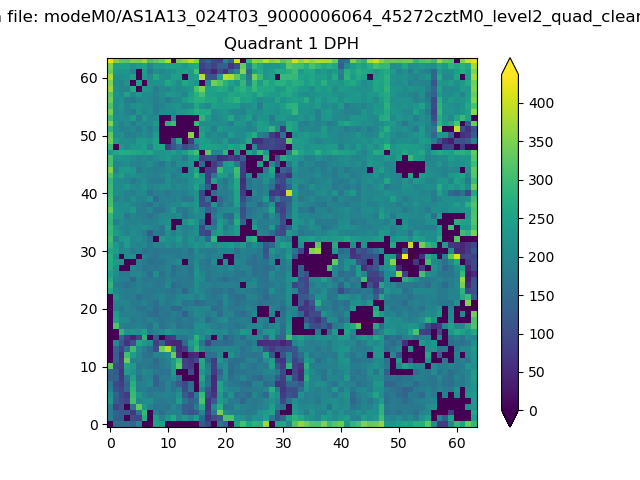 |
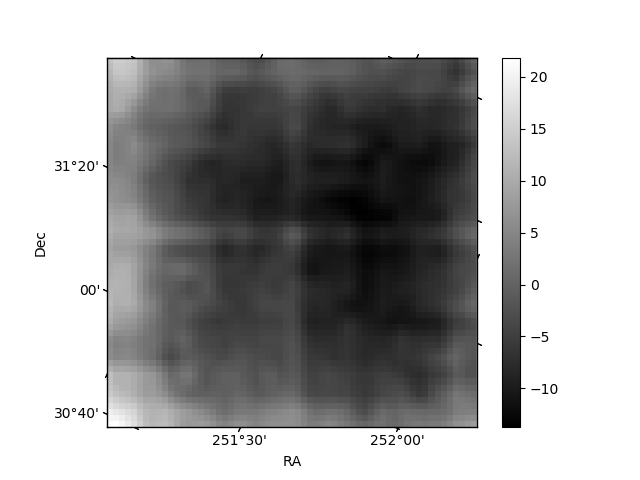
Quadrant B |
|---|---|---|---|
| Quadrant D | 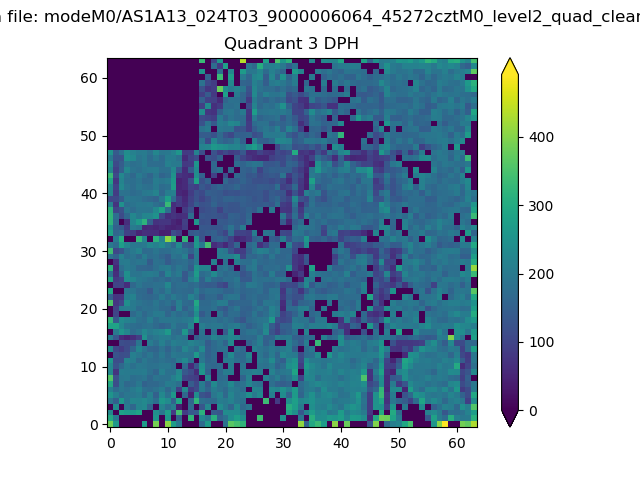 |
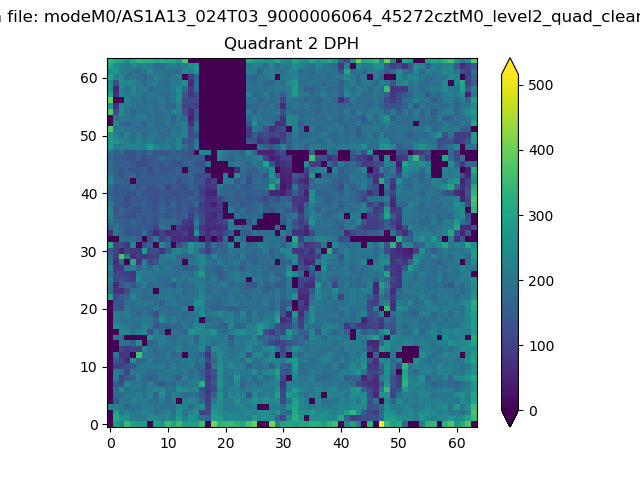 |
Quadrant C |
| Plot type | Count rate plots | Images |
|---|---|---|
| Comparison with Poisson distribution Blue bars denote a histogram of data divided into 1 sec bins. Red curve is a Poisson curve with rate = median count rate of data. |
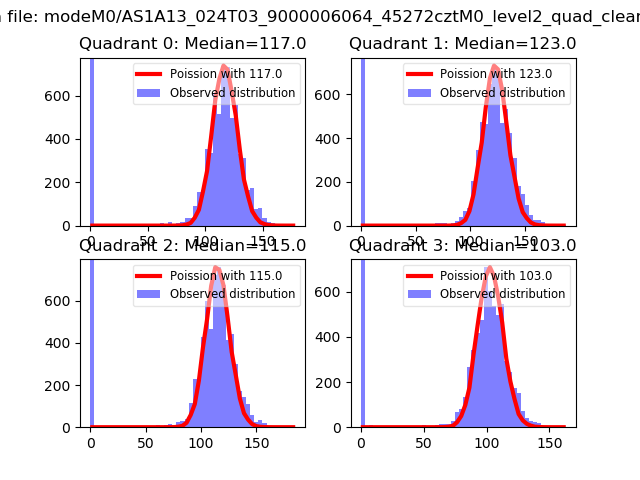 |
 |
| Quadrant-wise count rates Data is divided into 100 sec bins |
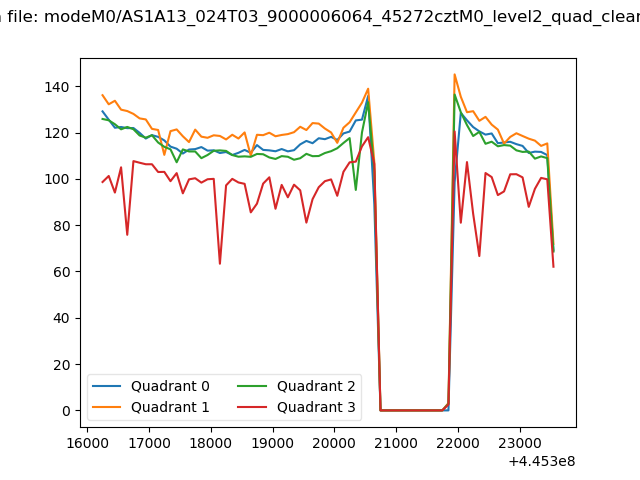 |
|
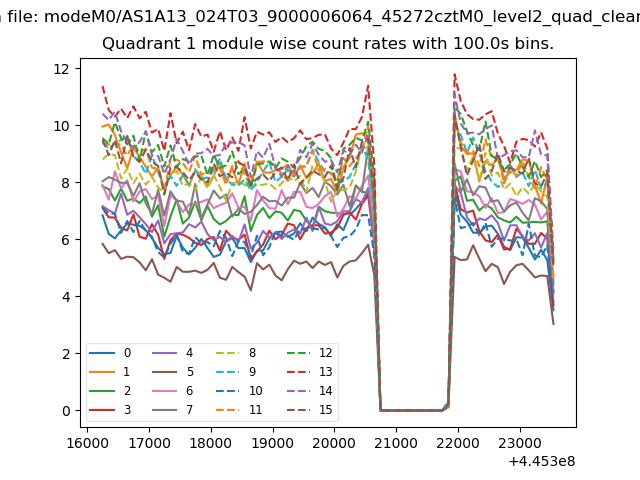
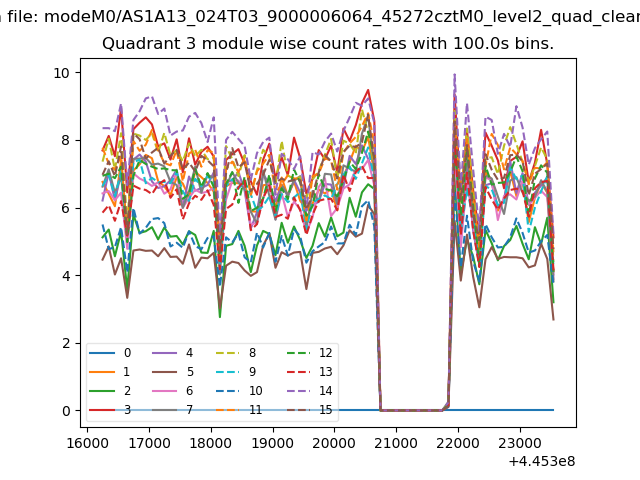
| Module-wise count rates for Quadrant A Data is divided into 100 sec bins |
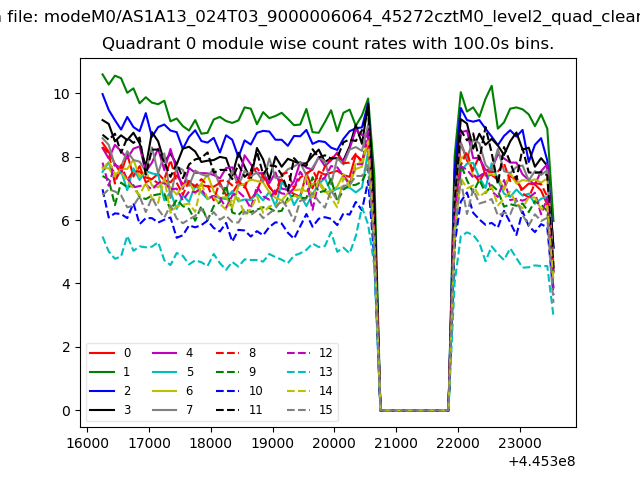 |
 |
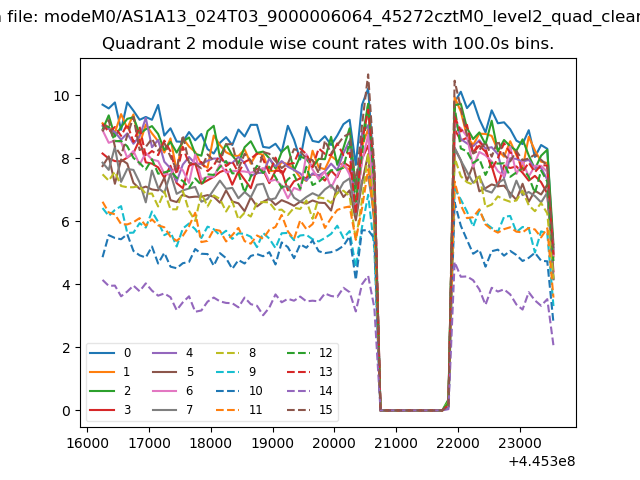
| Module-wise count rates for Quadrant B Data is divided into 100 sec bins |
 |
 |
| Module-wise count rates for Quadrant C Data is divided into 100 sec bins |
 |
 |
| Module-wise count rates for Quadrant D Data is divided into 100 sec bins |
 |
 |
| Parameter | Plot |
|---|---|
| CZT HV Monitor | 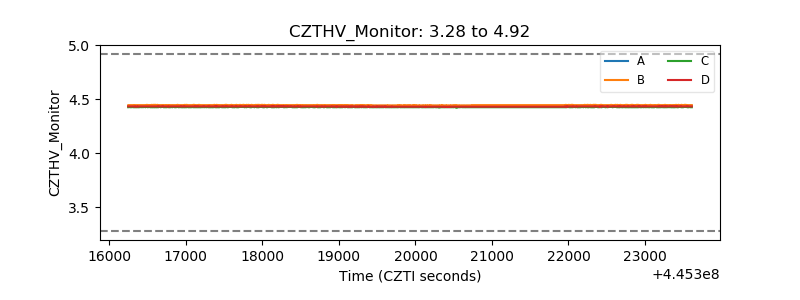 |
| D_VDD | 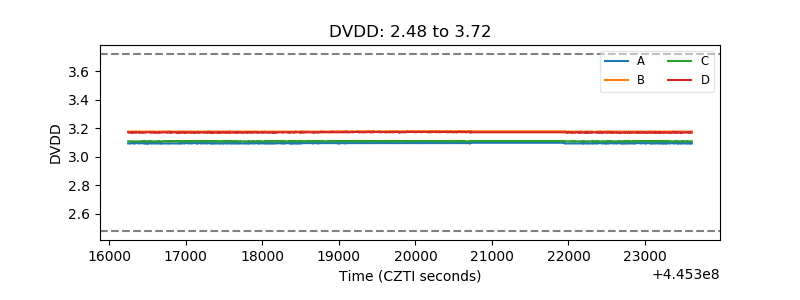 |
| Temperature 1 | 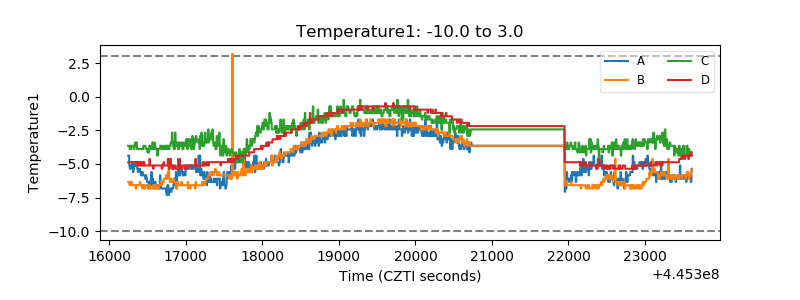 |
| Veto HV Monitor |  |
| Veto LLD | 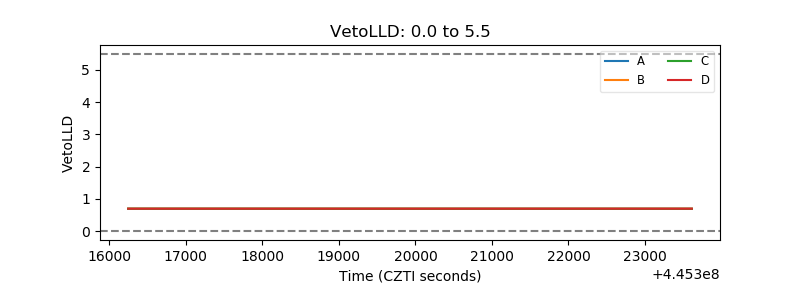 |
| Alpha Counter | 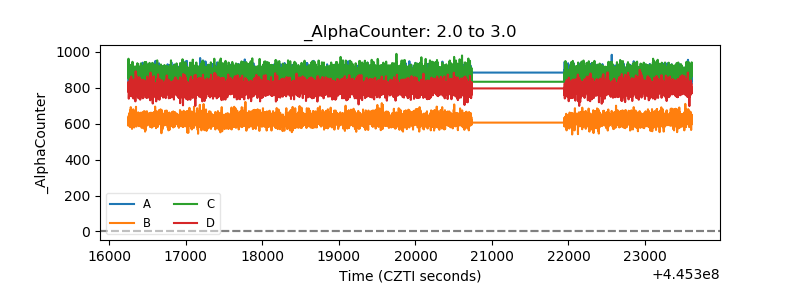 |
| _CPM_Rate | 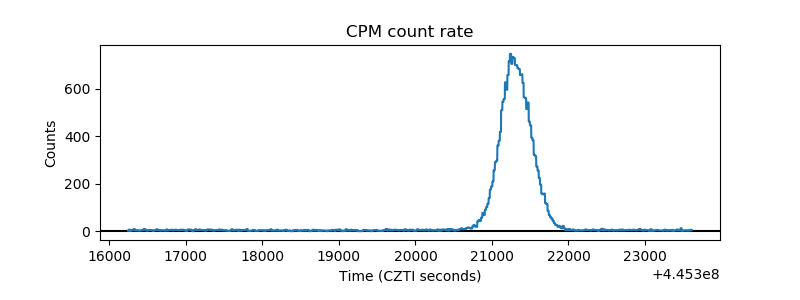 |
| CZT Counter | 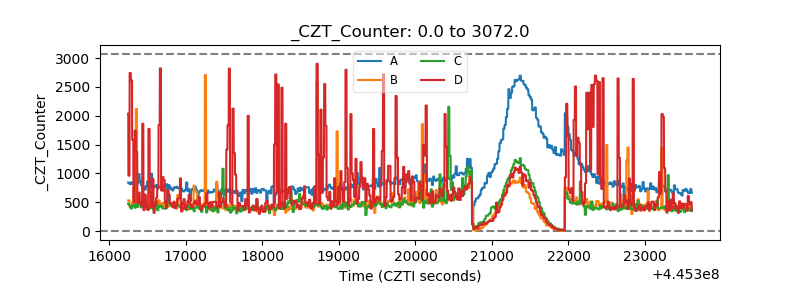 |
| +2.5 Volts monitor | 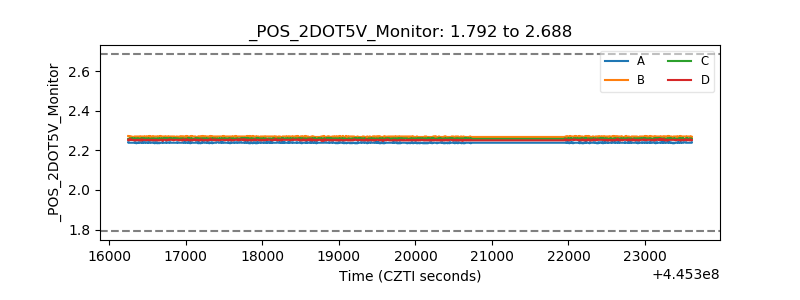 |
| +5 Volts monitor | 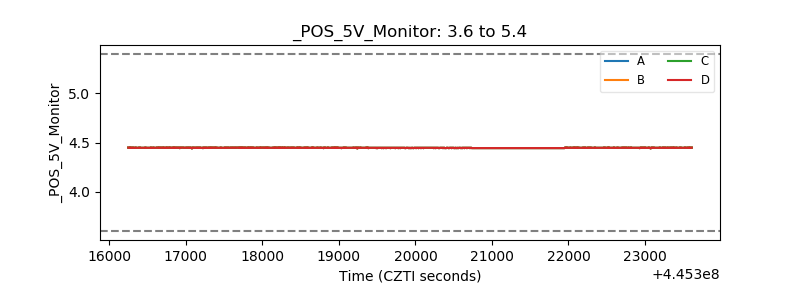 |
| _ROLL_ROT | 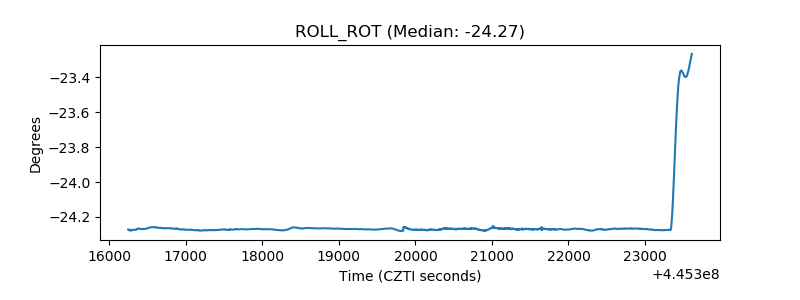 |
| _Roll_DEC | 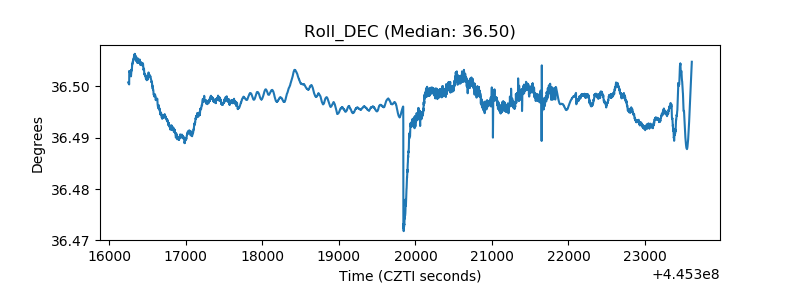 |
| _Roll_RA | 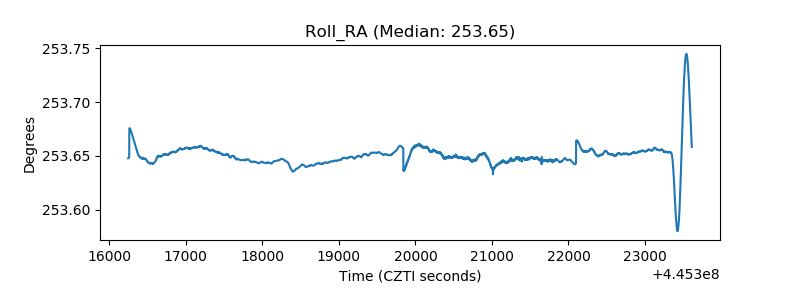 |
| Veto Counter | 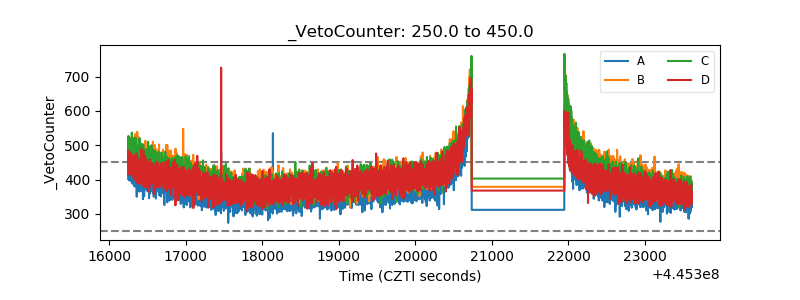 |