| Param | Original file | Final file |
|---|---|---|
| Filename | modeM0/AS1A13_024T03_9000006064_45273cztM0_level2.fits | modeM0/AS1A13_024T03_9000006064_45273cztM0_level2_quad_clean.evt |
| Size (bytes) | 465,877,440 | 109,229,760 |
| Size | 444.3 MB | 104.2 MB |
| Events in quadrant A | 5,361,081 | 735,558 |
| Events in quadrant B | 3,263,277 | 768,971 |
| Events in quadrant C | 3,100,927 | 728,185 |
| Events in quadrant D | 5,006,227 | 613,776 |
| Mode M0 | |||
|---|---|---|---|
| Quadrant | BADHDUFLAG | Total packets | Discarded packets |
| A | 0 | 20828 | 1 |
| B | 0 | 14336 | 1 |
| C | 0 | 14151 | 1 |
| D | 0 | 19616 | 1 |
| Mode SS | |||
|---|---|---|---|
| Quadrant | BADHDUFLAG | Total packets | Discarded packets |
| A | 0 | 134 | 0 |
| B | 0 | 134 | 0 |
| C | 0 | 134 | 0 |
| D | 0 | 134 | 0 |
| Mode M9 | |||
|---|---|---|---|
| Quadrant | BADHDUFLAG | Total packets | Discarded packets |
| A | 0 | 10 | 0 |
| B | 0 | 10 | 0 |
| C | 0 | 10 | 0 |
| D | 0 | 10 | 0 |
| Quadrant | Total seconds | Saturated seconds | Saturation percentage |
|---|---|---|---|
| A | 6611 | 153 | 2.314325% |
| B | 6611 | 131 | 1.981546% |
| C | 6612 | 75 | 1.134301% |
| D | 6611 | 559 | 8.455604% |
Noise dominated data is calculated using 1-second bins in cleaned event files. If a bin has >2000 counts, and if more than 50% of those come from <1% of pixels, then it is considered to be noise-dominated and hence unusable.
| Quadrant | # 1 sec bins | Bins with >0 counts | Bins with >2000 counts | High rate bins dominated by noise | Noise dominated (total time) | Noise dominated (detector-on time) | Marked lightcurve |
|---|---|---|---|---|---|---|---|
| A | 7581 | 6612 | 7 | 7 | 0.09% | 0.11% | 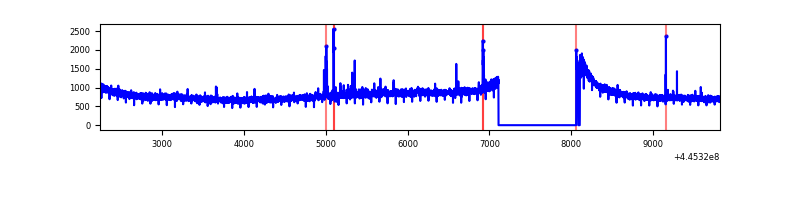 |
| B | 7581 | 6612 | 27 | 27 | 0.36% | 0.41% | 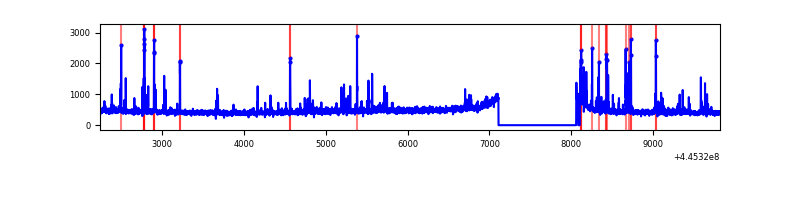 |
| C | 7582 | 6614 | 32 | 32 | 0.42% | 0.48% | 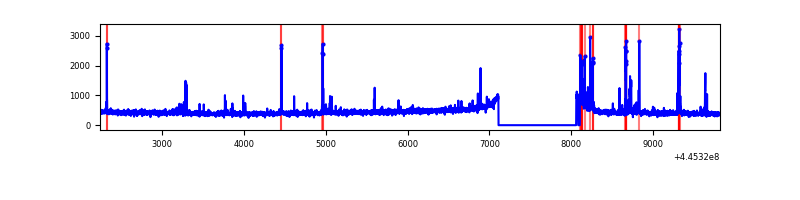 |
| D | 7581 | 6612 | 514 | 514 | 6.78% | 7.77% | 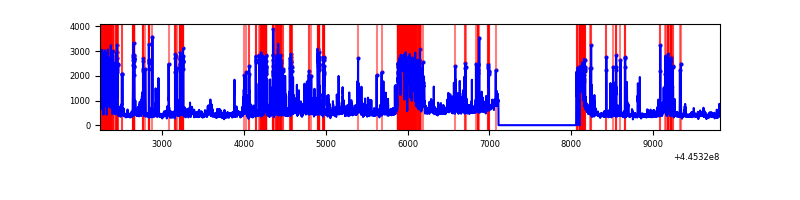 |
Top three noisy pixels from each quadrant. If the there are fewer than three noisy pixels in the level2.evt file, extra rows are filled as -1
| Pixel properties | Quadrant properties | ||||||
|---|---|---|---|---|---|---|---|
| Quadrant | DetID | PixID | Counts | Sigma | Mean | Median | Sigma |
| A | 10 | 83 | 2420928 | 15470.58 | 746 | 730 | 156.4 |
| A | 13 | 248 | 39428 | 247.37 | 746 | 730 | 156.4 |
| A | 15 | 174 | 9182 | 54.03 | 746 | 730 | 156.4 |
| B | 4 | 171 | 172311 | 1171.36 | 747 | 725 | 146.5 |
| B | 5 | 172 | 36344 | 243.16 | 747 | 725 | 146.5 |
| B | 0 | 168 | 29506 | 196.48 | 747 | 725 | 146.5 |
| C | 14 | 254 | 133513 | 769.26 | 732 | 737 | 172.6 |
| C | 12 | 2 | 92756 | 533.13 | 732 | 737 | 172.6 |
| C | 2 | 14 | 10059 | 54.01 | 732 | 737 | 172.6 |
| D | 13 | 249 | 1176573 | 6780.08 | 697 | 676 | 173.4 |
| D | 2 | 249 | 713349 | 4109.19 | 697 | 676 | 173.4 |
| D | 11 | 241 | 206082 | 1184.35 | 697 | 676 | 173.4 |
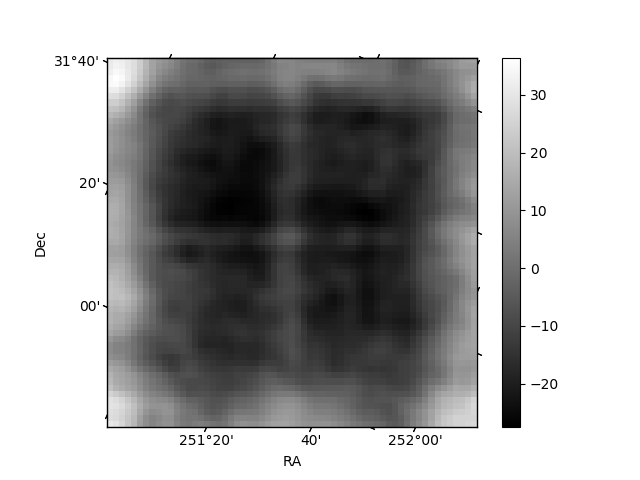
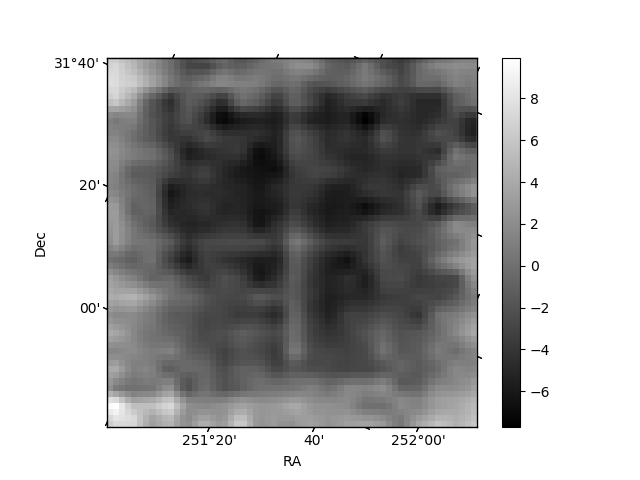
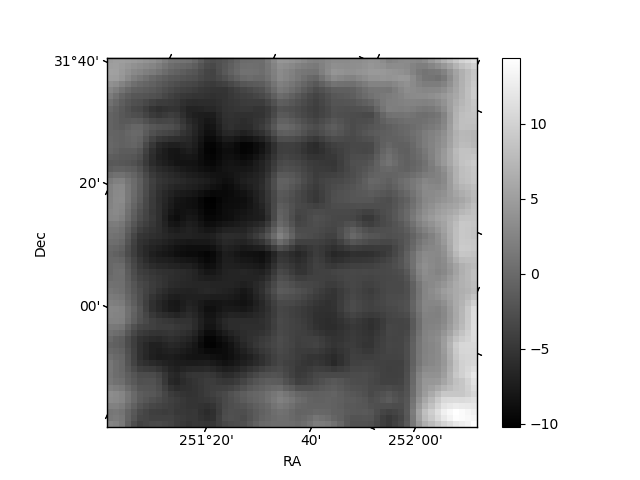
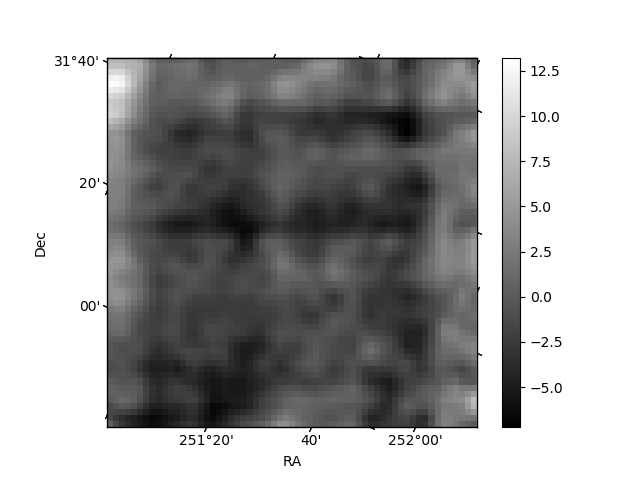
Histogram calculated using DETX and DETY for each event in the final _common_clean file
| Quadrant A | 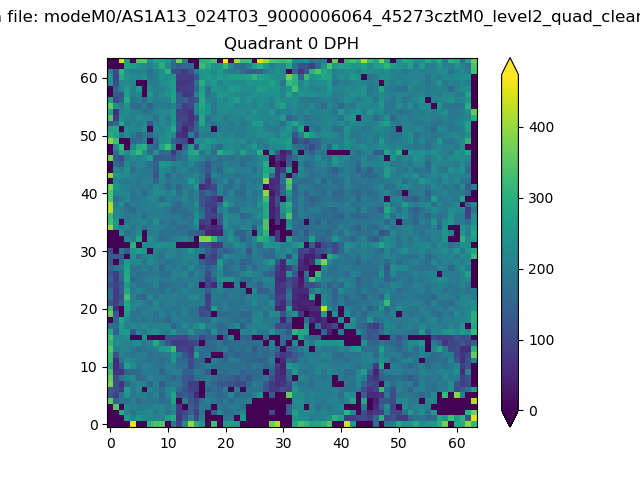 |
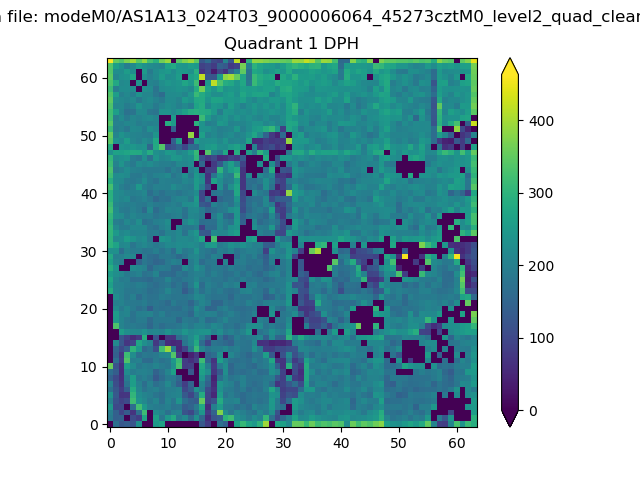 |
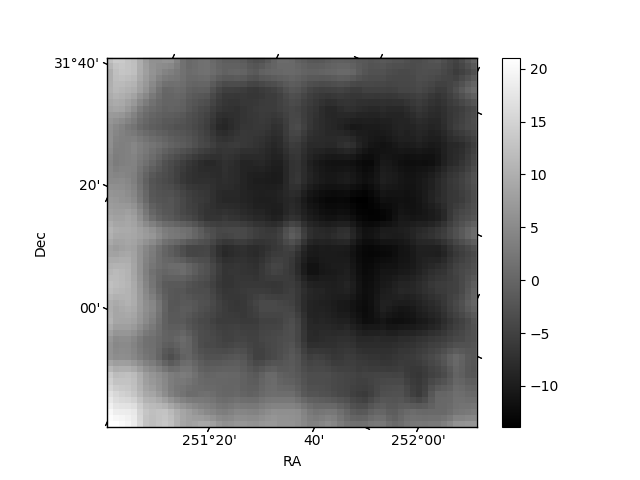
Quadrant B |
|---|---|---|---|
| Quadrant D | 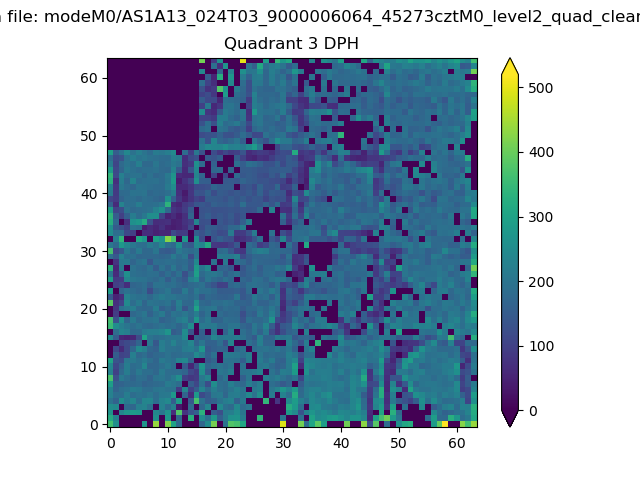 |
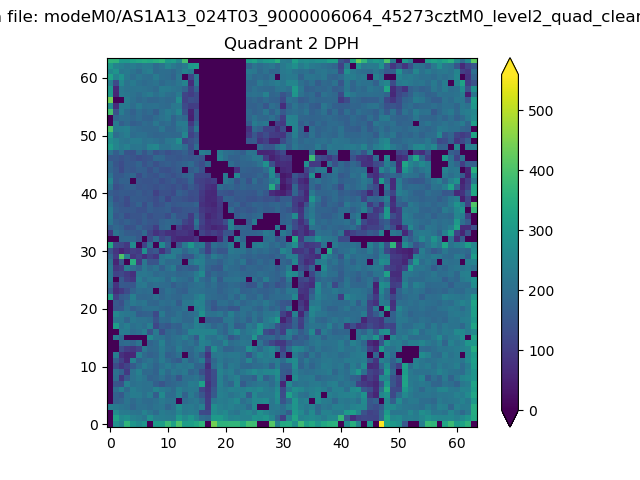 |
Quadrant C |
| Plot type | Count rate plots | Images |
|---|---|---|
| Comparison with Poisson distribution Blue bars denote a histogram of data divided into 1 sec bins. Red curve is a Poisson curve with rate = median count rate of data. |
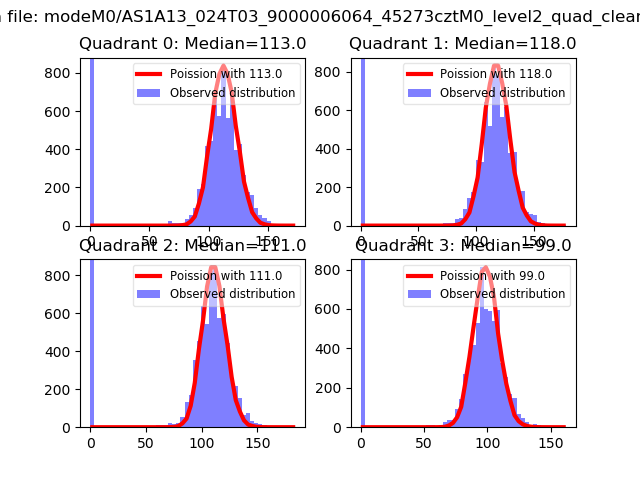 |
 |
| Quadrant-wise count rates Data is divided into 100 sec bins |
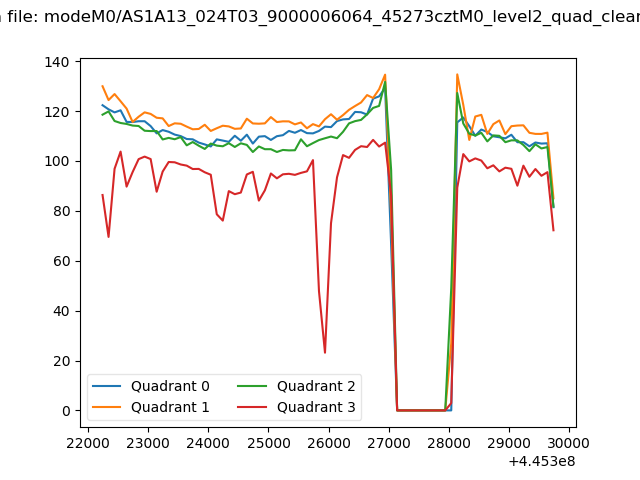 |
|
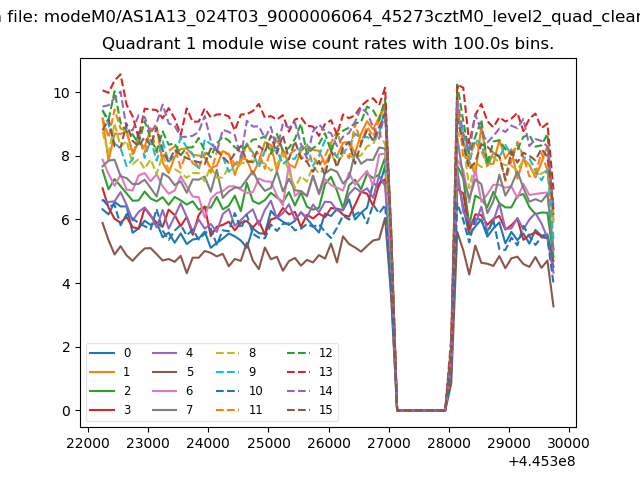
| Module-wise count rates for Quadrant A Data is divided into 100 sec bins |
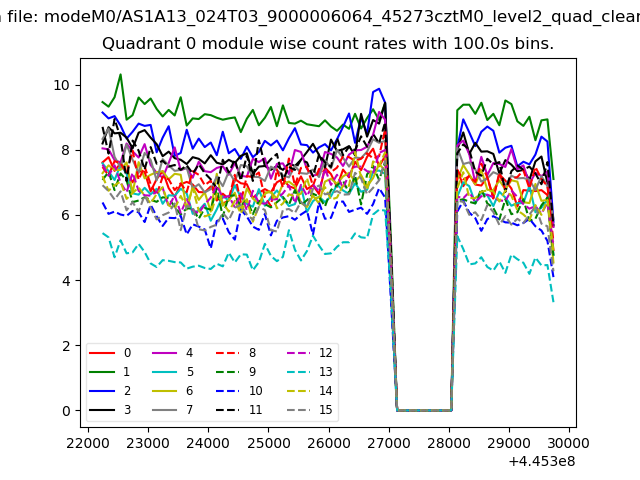 |
 |
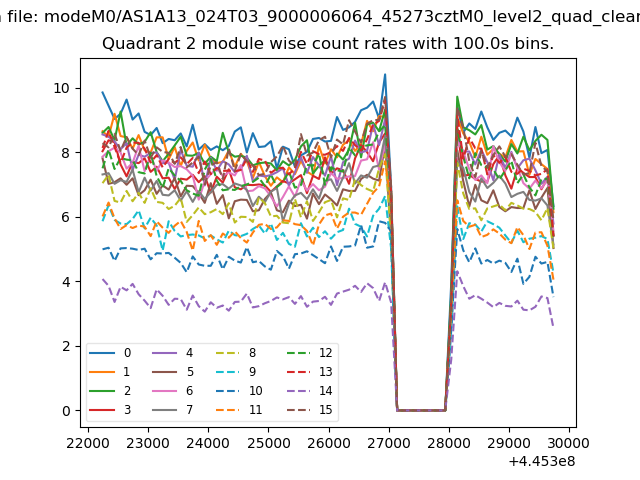
| Module-wise count rates for Quadrant B Data is divided into 100 sec bins |
 |
 |
| Module-wise count rates for Quadrant C Data is divided into 100 sec bins |
 |
 |
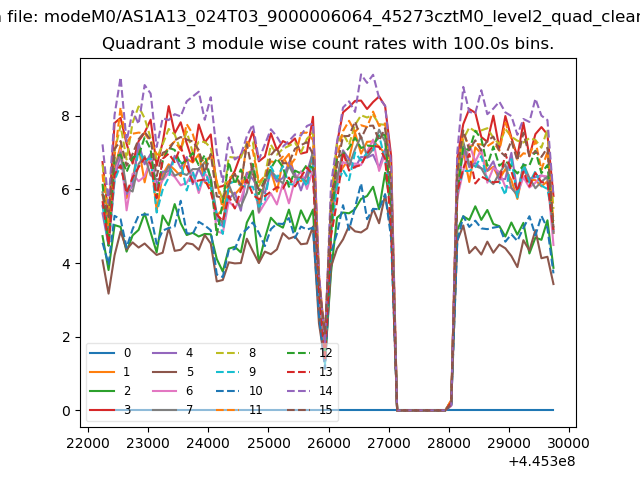
| Module-wise count rates for Quadrant D Data is divided into 100 sec bins |
 |
 |
| Parameter | Plot |
|---|---|
| CZT HV Monitor | 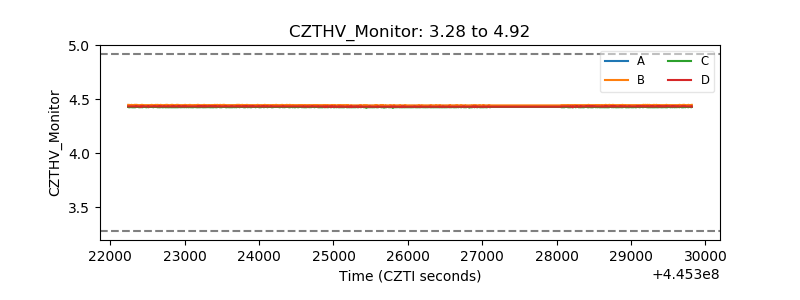 |
| D_VDD | 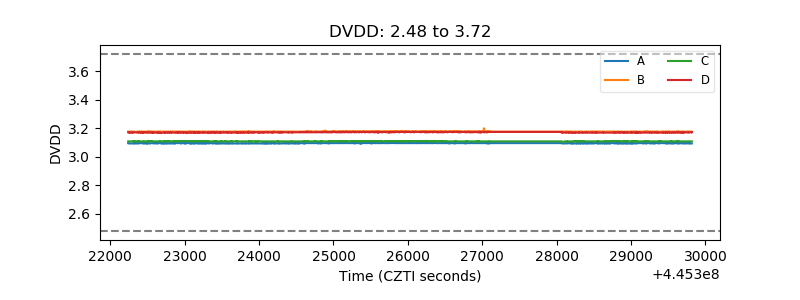 |
| Temperature 1 | 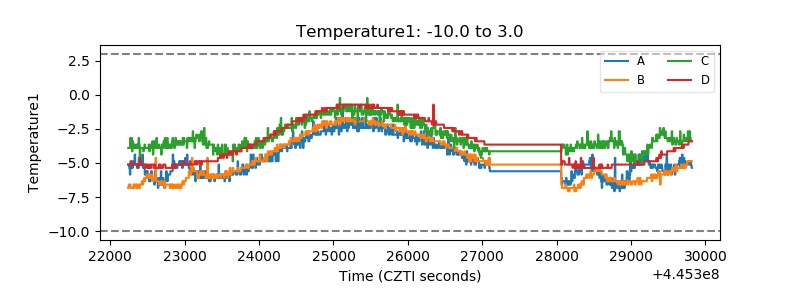 |
| Veto HV Monitor | 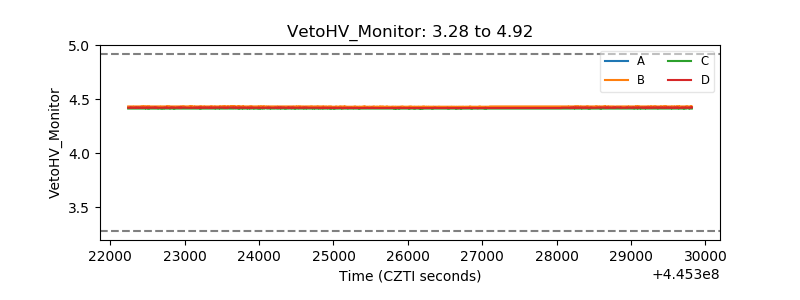 |
| Veto LLD | 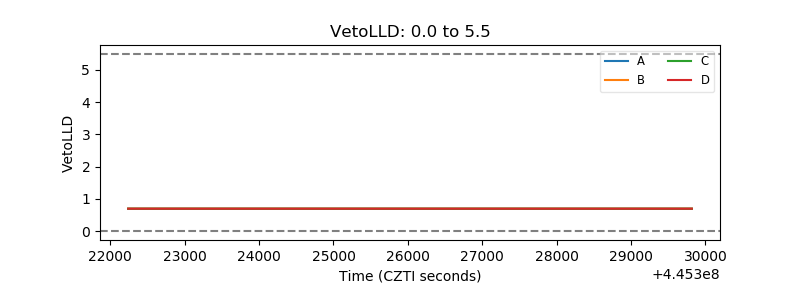 |
| Alpha Counter | 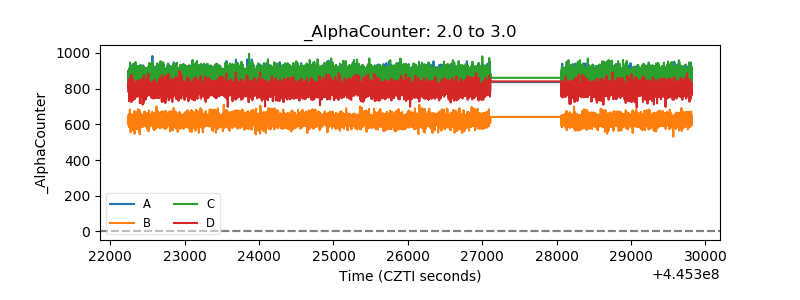 |
| _CPM_Rate | 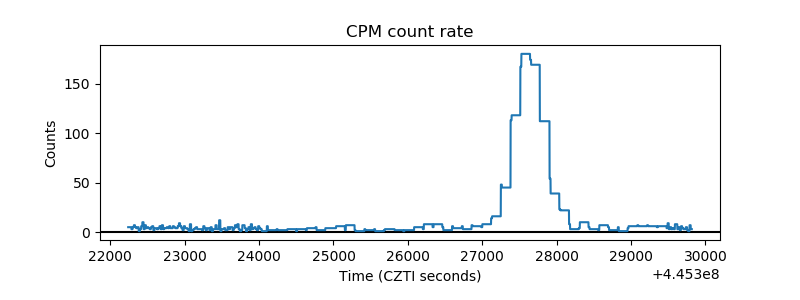 |
| CZT Counter | 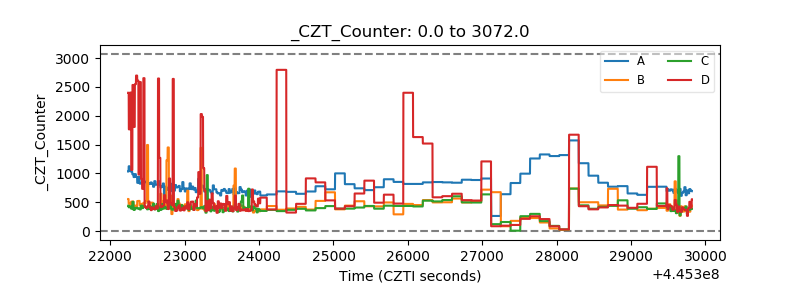 |
| +2.5 Volts monitor | 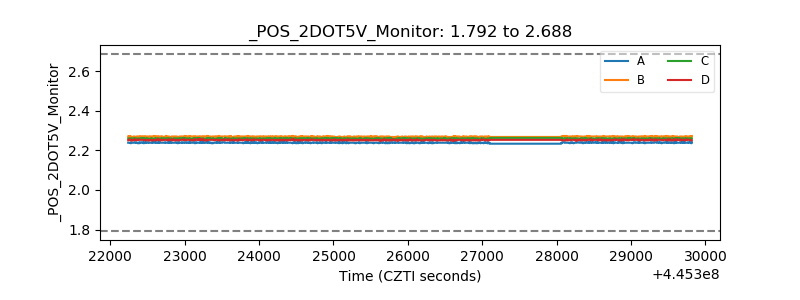 |
| +5 Volts monitor | 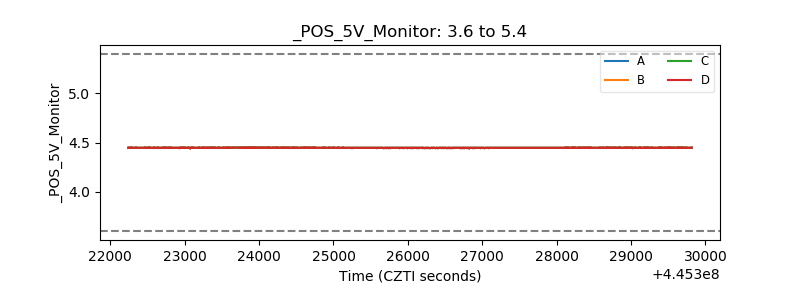 |
| _ROLL_ROT | 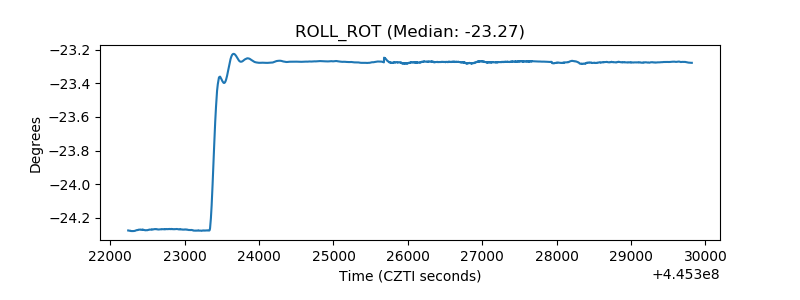 |
| _Roll_DEC | 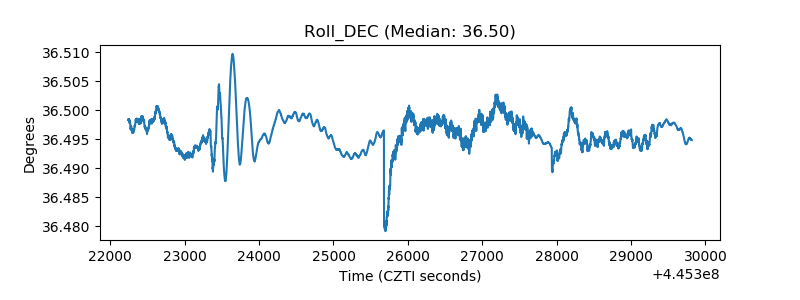 |
| _Roll_RA | 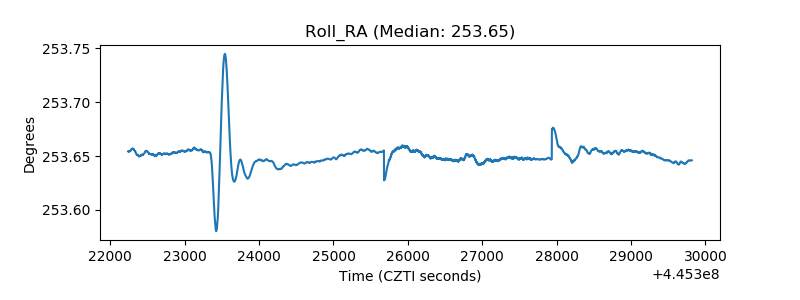 |
| Veto Counter | 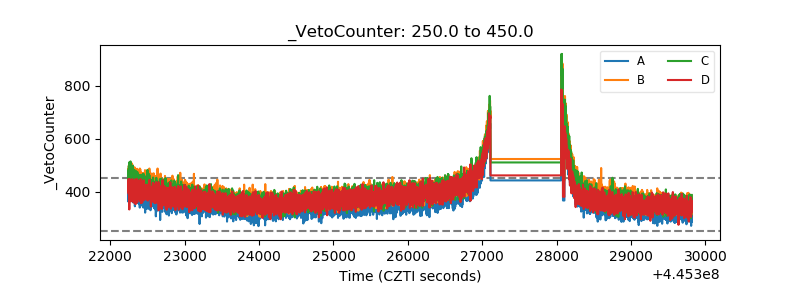 |