| Param | Original file | Final file |
|---|---|---|
| Filename | modeM0/AS1A13_024T03_9000006064_45274cztM0_level2.fits | modeM0/AS1A13_024T03_9000006064_45274cztM0_level2_quad_clean.evt |
| Size (bytes) | 526,933,440 | 113,120,640 |
| Size | 502.5 MB | 107.9 MB |
| Events in quadrant A | 5,767,617 | 747,945 |
| Events in quadrant B | 3,616,448 | 790,113 |
| Events in quadrant C | 4,081,300 | 747,835 |
| Events in quadrant D | 5,491,262 | 646,528 |
| Mode M0 | |||
|---|---|---|---|
| Quadrant | BADHDUFLAG | Total packets | Discarded packets |
| A | 0 | 22242 | 1 |
| B | 0 | 15680 | 1 |
| C | 0 | 17342 | 1 |
| D | 0 | 21377 | 1 |
| Mode SS | |||
|---|---|---|---|
| Quadrant | BADHDUFLAG | Total packets | Discarded packets |
| A | 0 | 144 | 0 |
| B | 0 | 144 | 0 |
| C | 0 | 144 | 0 |
| D | 0 | 144 | 0 |
| Mode M9 | |||
|---|---|---|---|
| Quadrant | BADHDUFLAG | Total packets | Discarded packets |
| A | 0 | 5 | 0 |
| B | 0 | 5 | 0 |
| C | 0 | 5 | 0 |
| D | 0 | 5 | 0 |
| Quadrant | Total seconds | Saturated seconds | Saturation percentage |
|---|---|---|---|
| A | 7071 | 272 | 3.846698% |
| B | 7071 | 184 | 2.602178% |
| C | 7072 | 212 | 2.997738% |
| D | 7072 | 608 | 8.597285% |
Noise dominated data is calculated using 1-second bins in cleaned event files. If a bin has >2000 counts, and if more than 50% of those come from <1% of pixels, then it is considered to be noise-dominated and hence unusable.
| Quadrant | # 1 sec bins | Bins with >0 counts | Bins with >2000 counts | High rate bins dominated by noise | Noise dominated (total time) | Noise dominated (detector-on time) | Marked lightcurve |
|---|---|---|---|---|---|---|---|
| A | 7621 | 7071 | 60 | 60 | 0.79% | 0.85% | 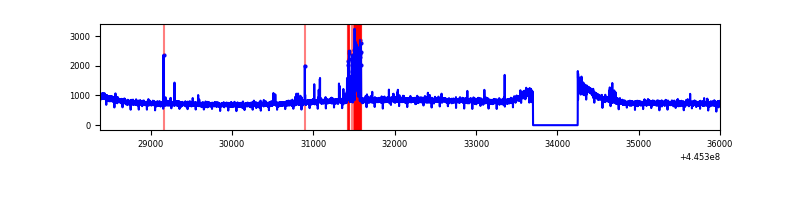 |
| B | 7621 | 7071 | 45 | 45 | 0.59% | 0.64% | 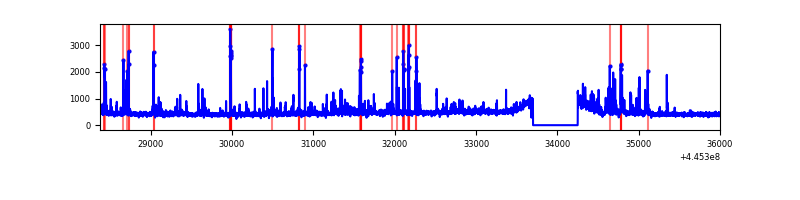 |
| C | 7622 | 7073 | 153 | 153 | 2.01% | 2.16% | 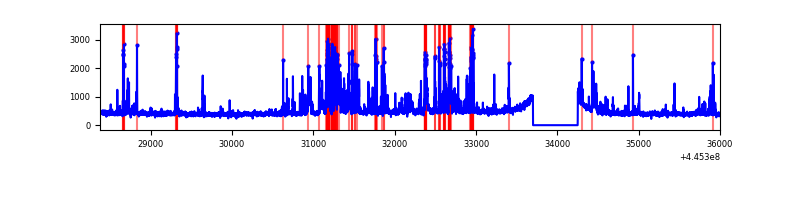 |
| D | 7622 | 7072 | 502 | 502 | 6.59% | 7.10% | 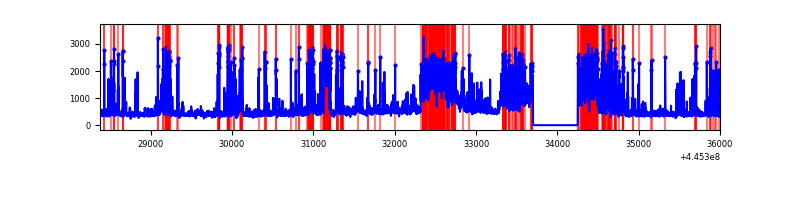 |
Top three noisy pixels from each quadrant. If the there are fewer than three noisy pixels in the level2.evt file, extra rows are filled as -1
| Pixel properties | Quadrant properties | ||||||
|---|---|---|---|---|---|---|---|
| Quadrant | DetID | PixID | Counts | Sigma | Mean | Median | Sigma |
| A | 10 | 83 | 2514871 | 15090.16 | 792 | 774 | 166.6 |
| A | 13 | 248 | 174859 | 1044.9 | 792 | 774 | 166.6 |
| A | 7 | 3 | 12672 | 71.41 | 792 | 774 | 166.6 |
| B | 4 | 171 | 283564 | 1783.47 | 793 | 770 | 158.6 |
| B | 5 | 172 | 49743 | 308.85 | 793 | 770 | 158.6 |
| B | 0 | 190 | 43077 | 266.81 | 793 | 770 | 158.6 |
| C | 14 | 254 | 446641 | 2439.37 | 774 | 777 | 182.8 |
| C | 12 | 2 | 316178 | 1725.6 | 774 | 777 | 182.8 |
| C | 12 | 16 | 287975 | 1571.29 | 774 | 777 | 182.8 |
| D | 13 | 249 | 929717 | 4859.3 | 753 | 731 | 191.2 |
| D | 12 | 33 | 679374 | 3549.81 | 753 | 731 | 191.2 |
| D | 9 | 49 | 482322 | 2519.08 | 753 | 731 | 191.2 |
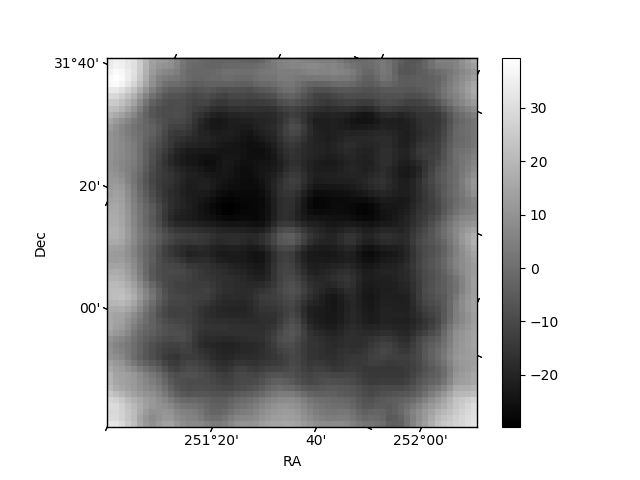
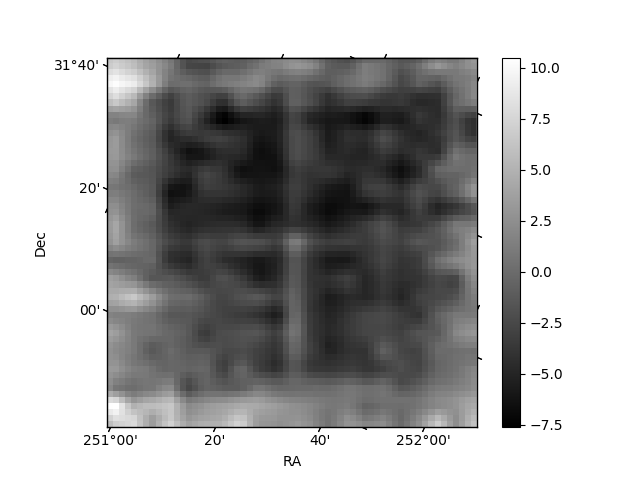
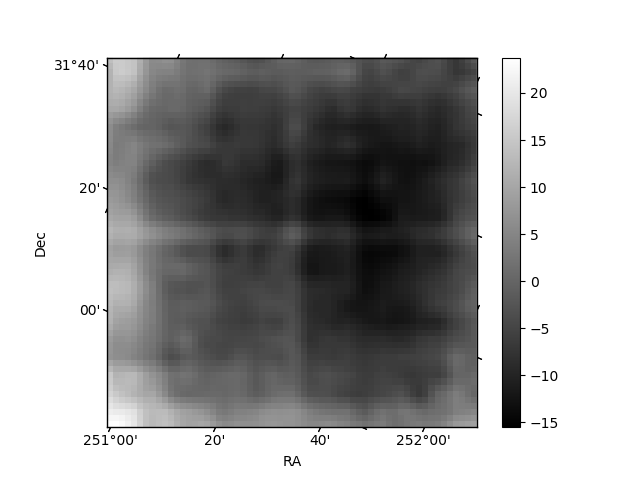
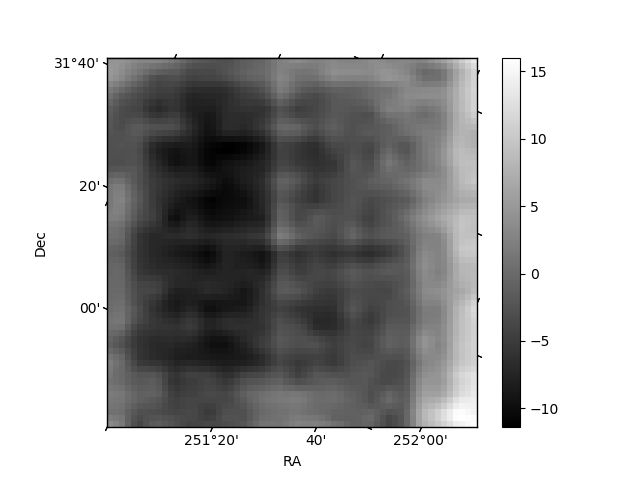
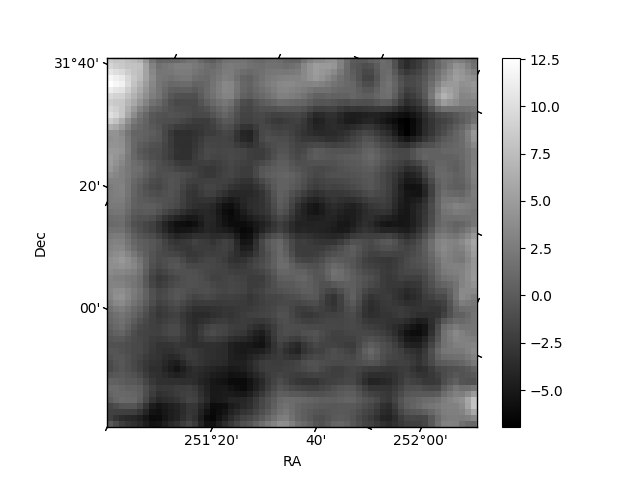
Histogram calculated using DETX and DETY for each event in the final _common_clean file
| Quadrant A | 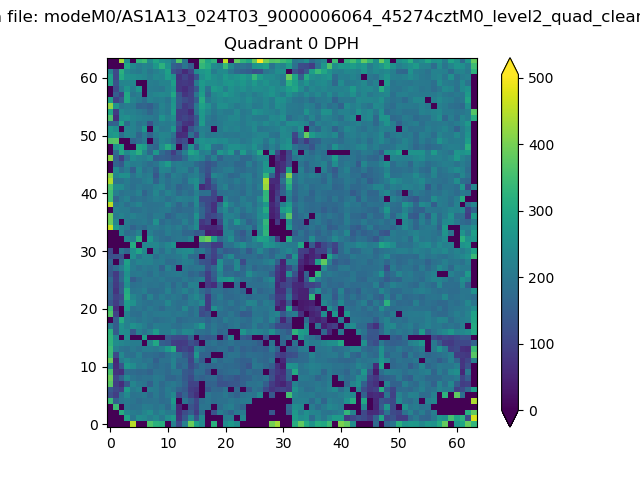 |
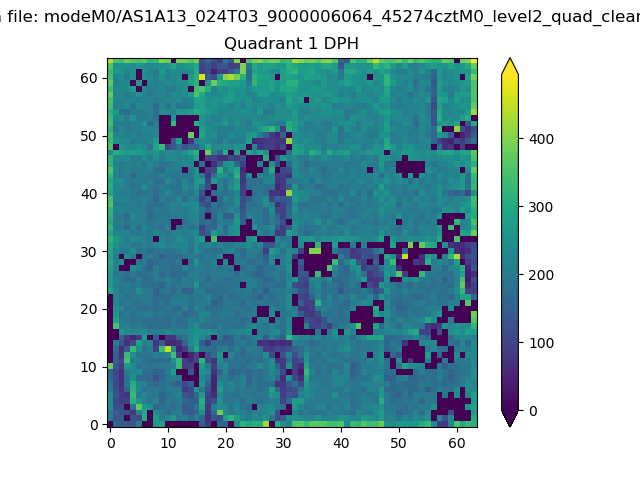 |
Quadrant B |
|---|---|---|---|
| Quadrant D | 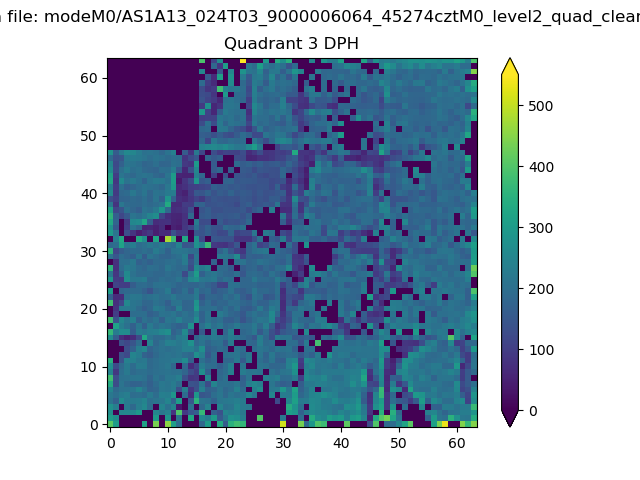 |
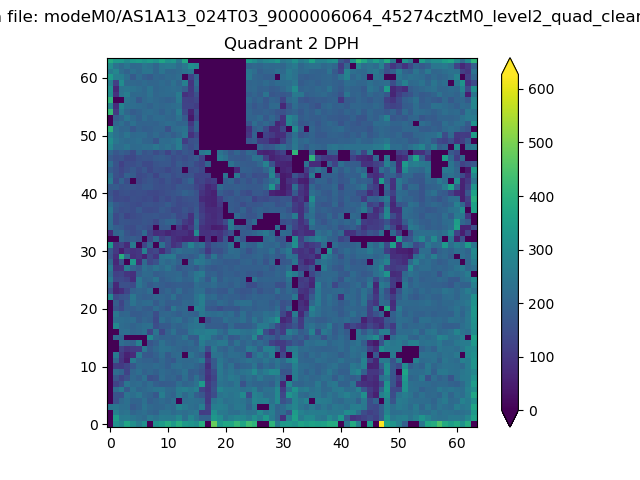 |
Quadrant C |
| Plot type | Count rate plots | Images |
|---|---|---|
| Comparison with Poisson distribution Blue bars denote a histogram of data divided into 1 sec bins. Red curve is a Poisson curve with rate = median count rate of data. |
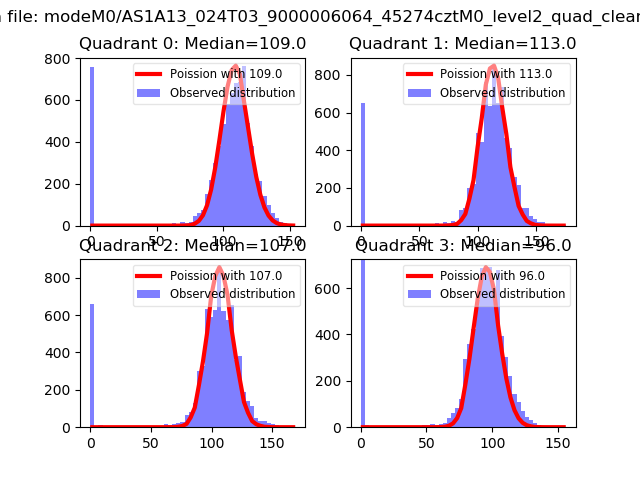 |
 |
| Quadrant-wise count rates Data is divided into 100 sec bins |
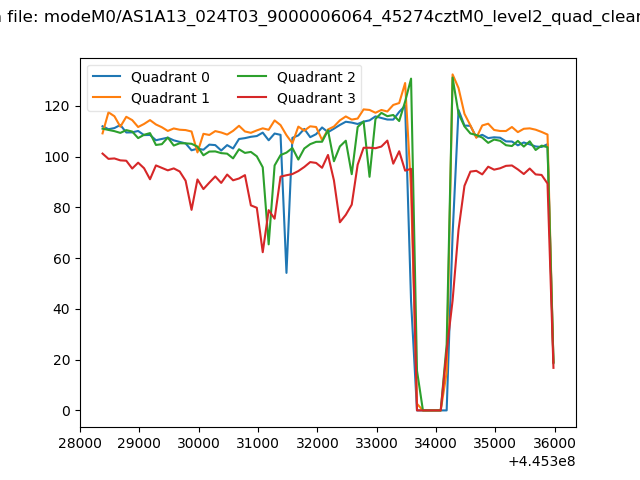 |
|
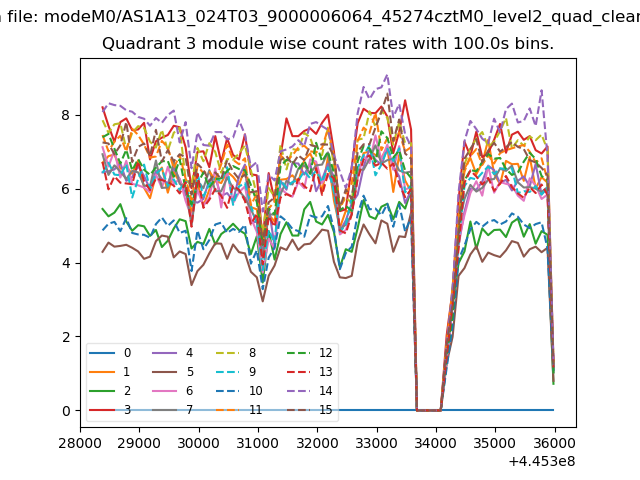
| Module-wise count rates for Quadrant A Data is divided into 100 sec bins |
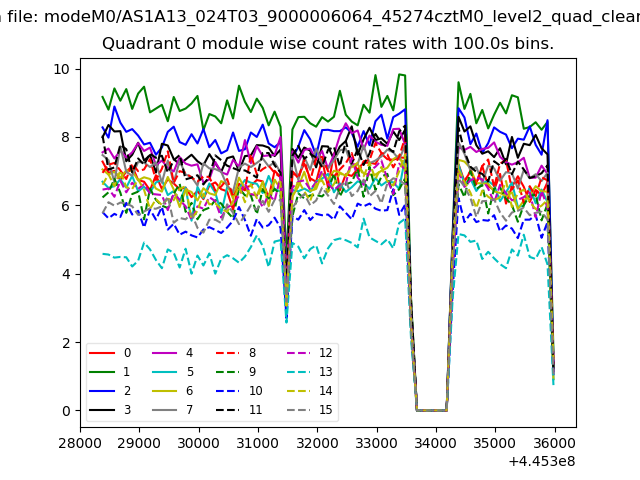 |
 |
| Module-wise count rates for Quadrant B Data is divided into 100 sec bins |
 |
 |
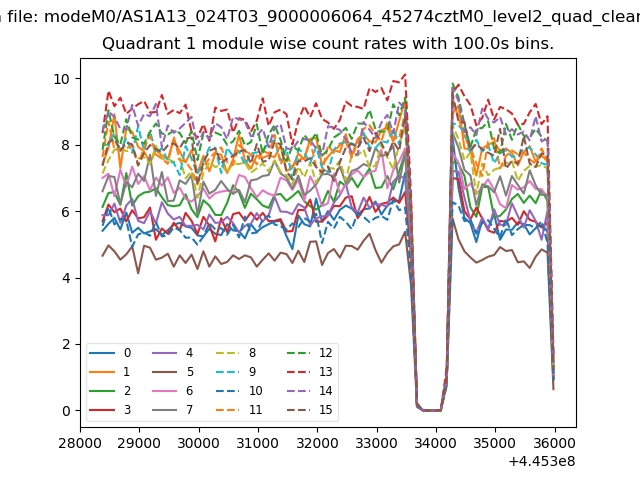
| Module-wise count rates for Quadrant C Data is divided into 100 sec bins |
 |
 |
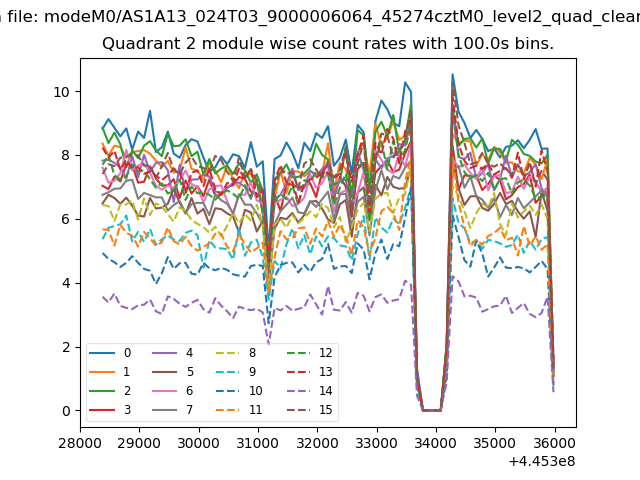
| Module-wise count rates for Quadrant D Data is divided into 100 sec bins |
 |
 |
| Parameter | Plot |
|---|---|
| CZT HV Monitor | 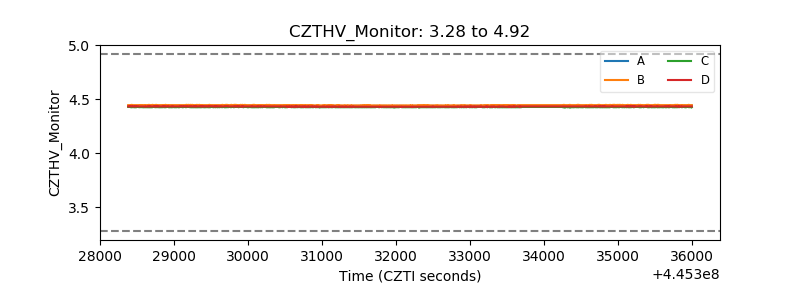 |
| D_VDD | 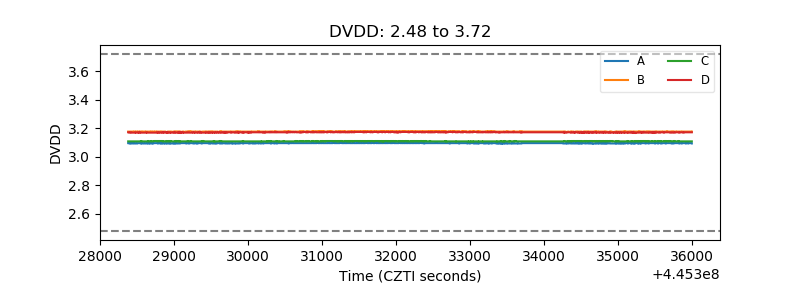 |
| Temperature 1 | 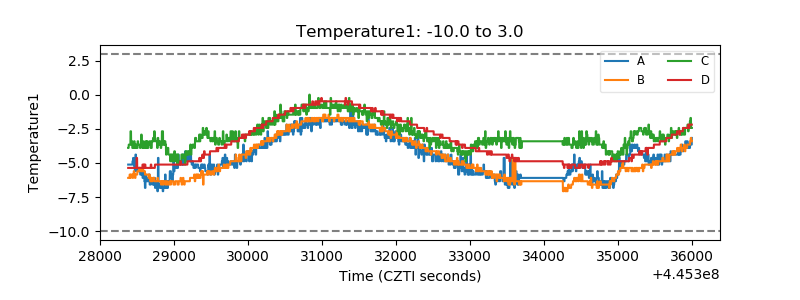 |
| Veto HV Monitor | 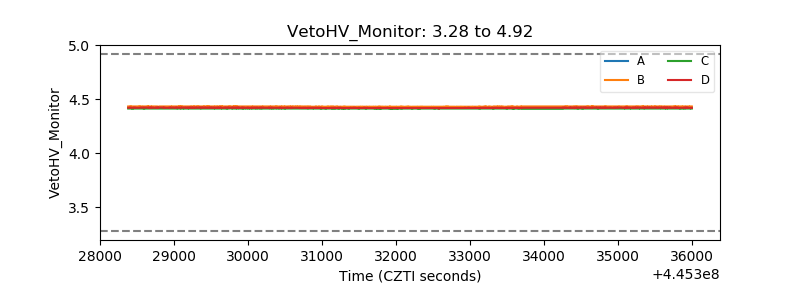 |
| Veto LLD | 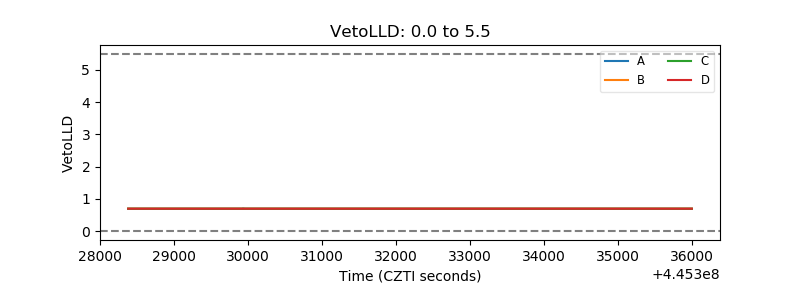 |
| Alpha Counter | 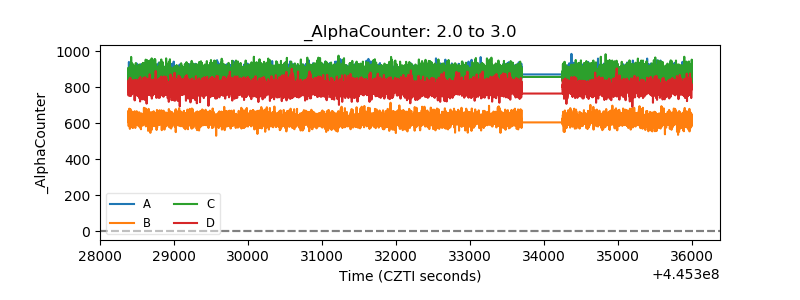 |
| _CPM_Rate | 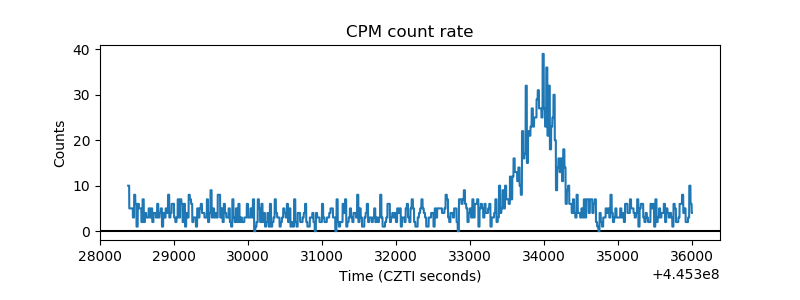 |
| CZT Counter | 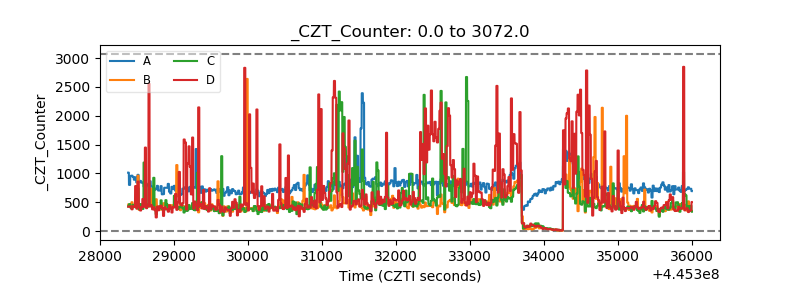 |
| +2.5 Volts monitor | 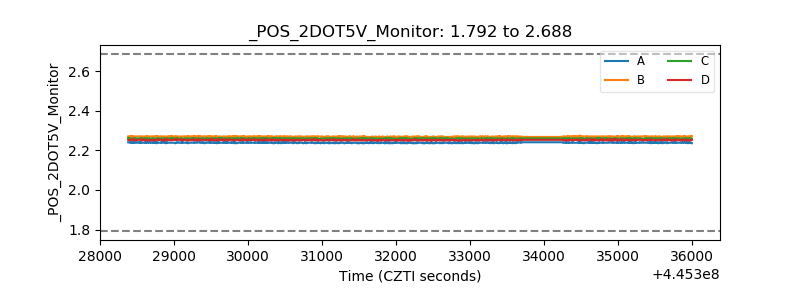 |
| +5 Volts monitor | 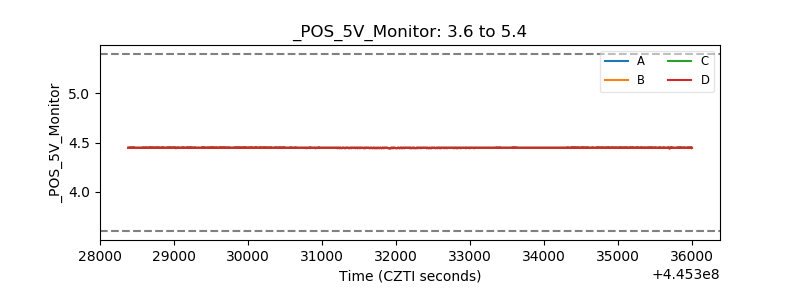 |
| _ROLL_ROT | 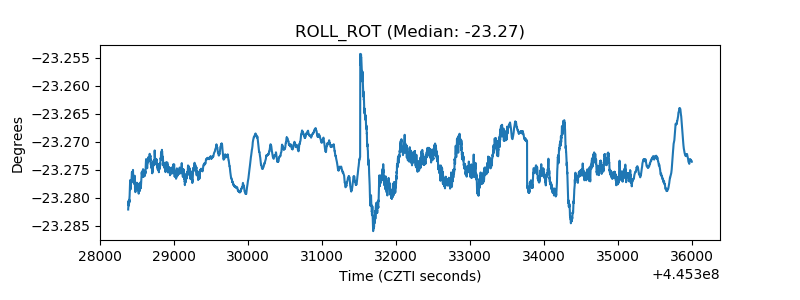 |
| _Roll_DEC | 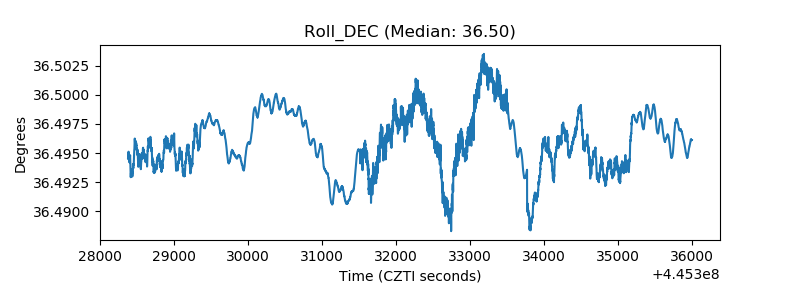 |
| _Roll_RA | 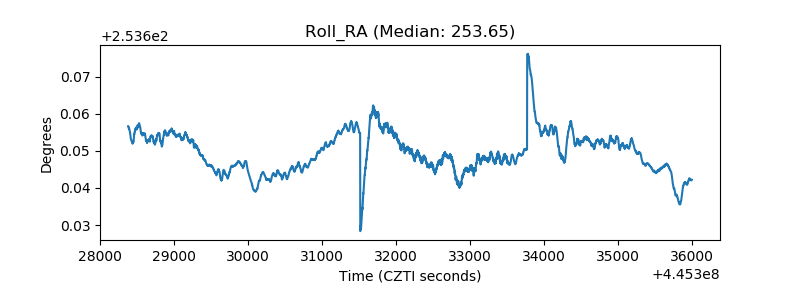 |
| Veto Counter | 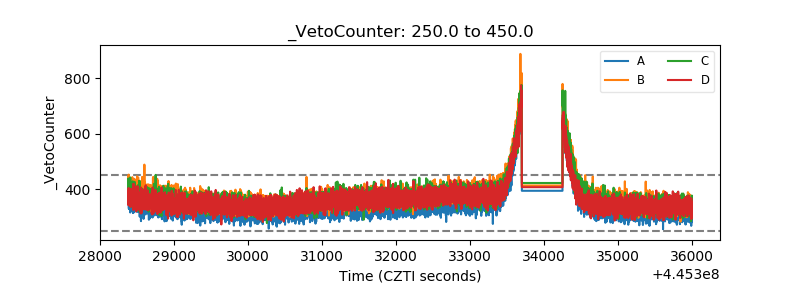 |