| Param | Original file | Final file |
|---|---|---|
| Filename | modeM0/AS1A13_024T03_9000006064_45275cztM0_level2.fits | modeM0/AS1A13_024T03_9000006064_45275cztM0_level2_quad_clean.evt |
| Size (bytes) | 510,822,720 | 112,112,640 |
| Size | 487.2 MB | 106.9 MB |
| Events in quadrant A | 5,579,626 | 756,199 |
| Events in quadrant B | 3,658,437 | 781,230 |
| Events in quadrant C | 3,345,283 | 741,158 |
| Events in quadrant D | 5,780,570 | 626,149 |
| Mode M0 | |||
|---|---|---|---|
| Quadrant | BADHDUFLAG | Total packets | Discarded packets |
| A | 0 | 21587 | 0 |
| B | 0 | 15784 | 0 |
| C | 0 | 15173 | 0 |
| D | 0 | 22069 | 6 |
| Mode SS | |||
|---|---|---|---|
| Quadrant | BADHDUFLAG | Total packets | Discarded packets |
| A | 0 | 142 | 0 |
| B | 0 | 142 | 0 |
| C | 0 | 142 | 0 |
| D | 0 | 142 | 0 |
| Quadrant | Total seconds | Saturated seconds | Saturation percentage |
|---|---|---|---|
| A | 7027 | 88 | 1.252313% |
| B | 7027 | 131 | 1.864238% |
| C | 7028 | 57 | 0.811042% |
| D | 7026 | 648 | 9.222886% |
Noise dominated data is calculated using 1-second bins in cleaned event files. If a bin has >2000 counts, and if more than 50% of those come from <1% of pixels, then it is considered to be noise-dominated and hence unusable.
| Quadrant | # 1 sec bins | Bins with >0 counts | Bins with >2000 counts | High rate bins dominated by noise | Noise dominated (total time) | Noise dominated (detector-on time) | Marked lightcurve |
|---|---|---|---|---|---|---|---|
| A | 7027 | 7027 | 15 | 15 | 0.21% | 0.21% | 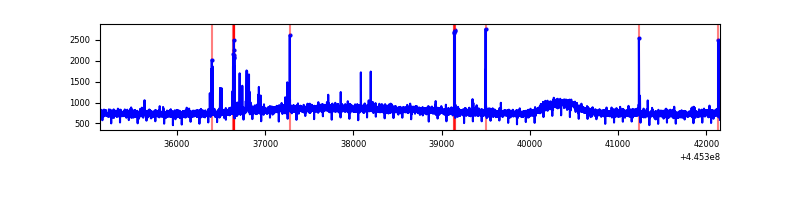 |
| B | 7027 | 7027 | 53 | 53 | 0.75% | 0.75% | 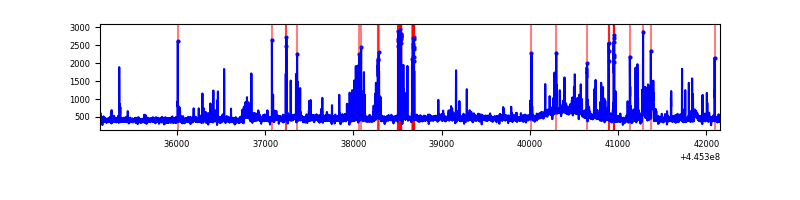 |
| C | 7028 | 7028 | 48 | 48 | 0.68% | 0.68% | 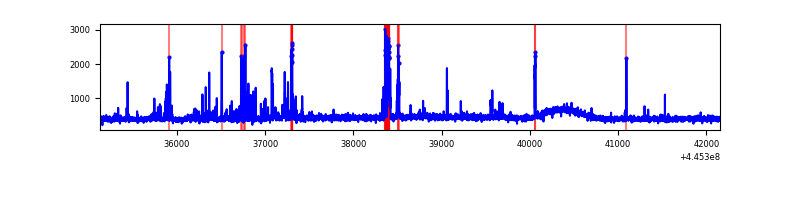 |
| D | 7028 | 7027 | 451 | 451 | 6.42% | 6.42% | 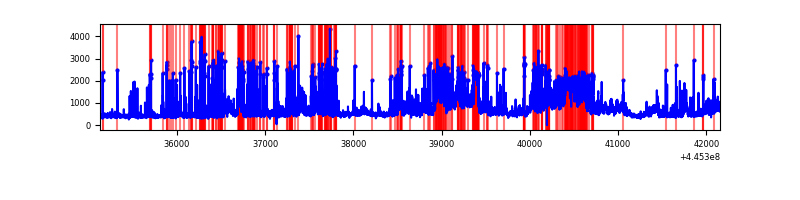 |
Top three noisy pixels from each quadrant. If the there are fewer than three noisy pixels in the level2.evt file, extra rows are filled as -1
| Pixel properties | Quadrant properties | ||||||
|---|---|---|---|---|---|---|---|
| Quadrant | DetID | PixID | Counts | Sigma | Mean | Median | Sigma |
| A | 10 | 83 | 2424707 | 14613.77 | 788 | 770 | 165.9 |
| A | 13 | 248 | 50845 | 301.9 | 788 | 770 | 165.9 |
| A | 7 | 3 | 29860 | 175.38 | 788 | 770 | 165.9 |
| B | 4 | 171 | 410261 | 2585.92 | 785 | 758 | 158.4 |
| B | 10 | 3 | 57377 | 357.54 | 785 | 758 | 158.4 |
| B | 12 | 111 | 19809 | 120.3 | 785 | 758 | 158.4 |
| C | 14 | 254 | 242693 | 1336.91 | 768 | 773 | 181.0 |
| C | 12 | 2 | 81058 | 443.67 | 768 | 773 | 181.0 |
| C | 3 | 233 | 16240 | 85.47 | 768 | 773 | 181.0 |
| D | 12 | 33 | 1037885 | 5465.33 | 744 | 720 | 189.8 |
| D | 9 | 49 | 560029 | 2947.28 | 744 | 720 | 189.8 |
| D | 11 | 241 | 366679 | 1928.42 | 744 | 720 | 189.8 |
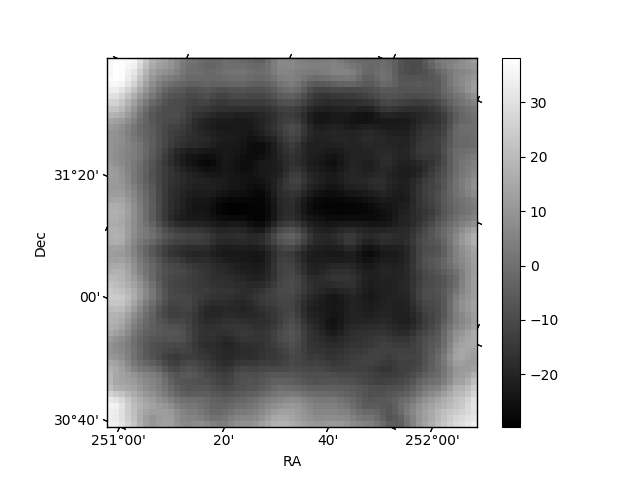
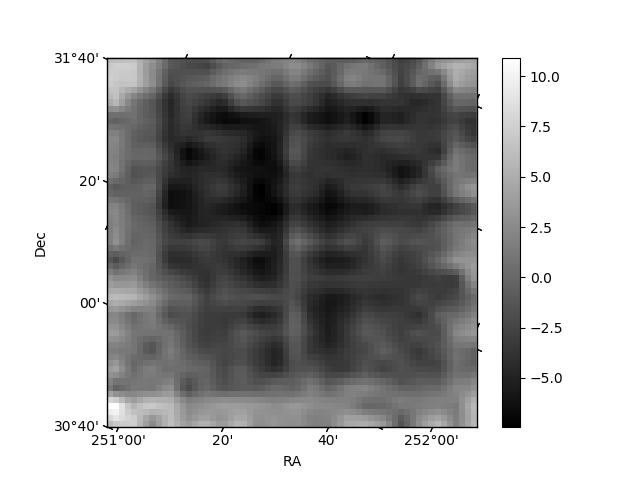
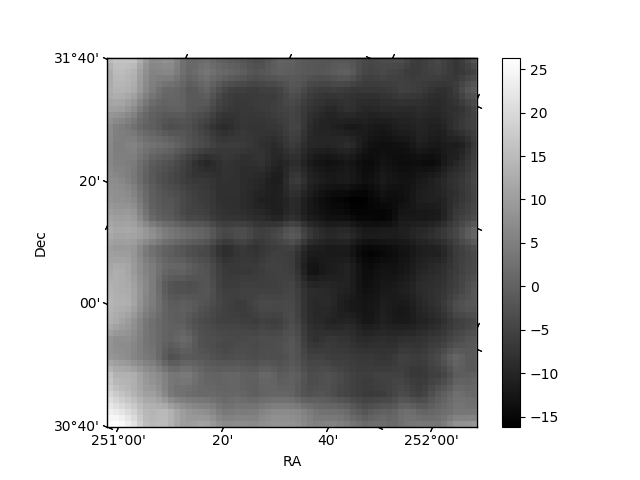
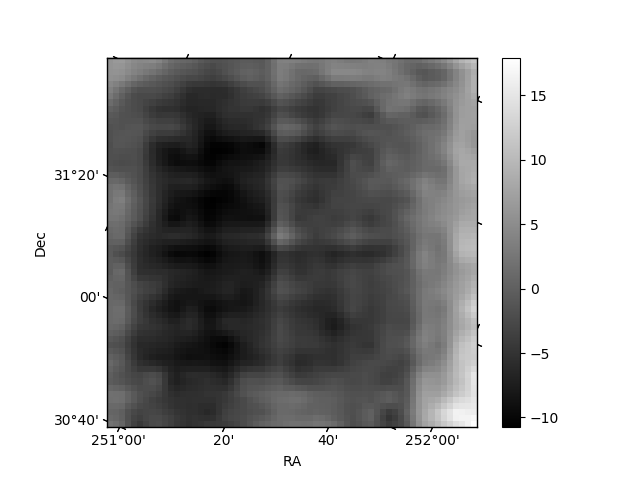
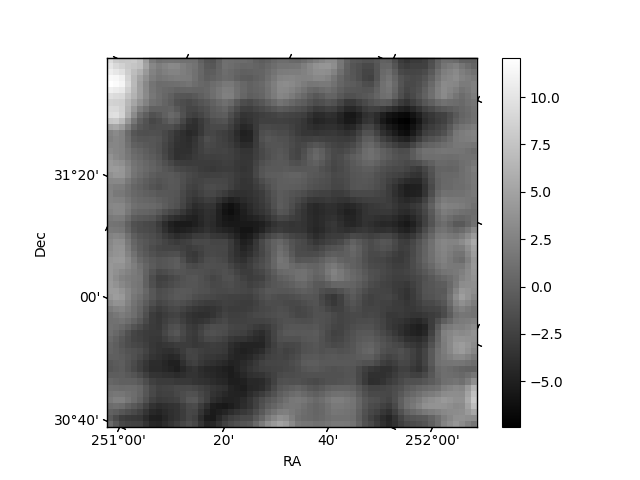
Histogram calculated using DETX and DETY for each event in the final _common_clean file
| Quadrant A | 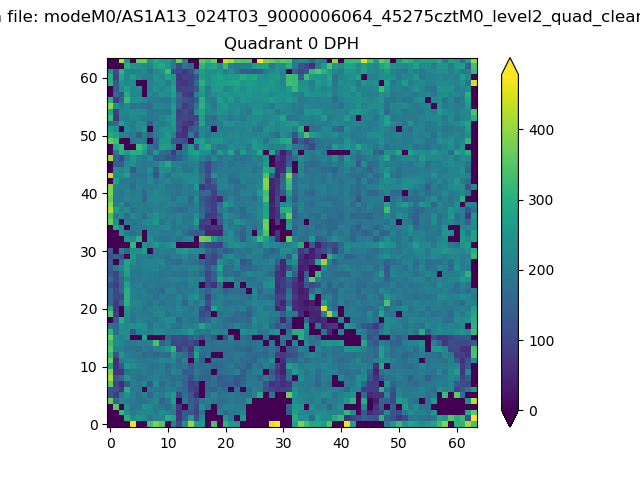 |
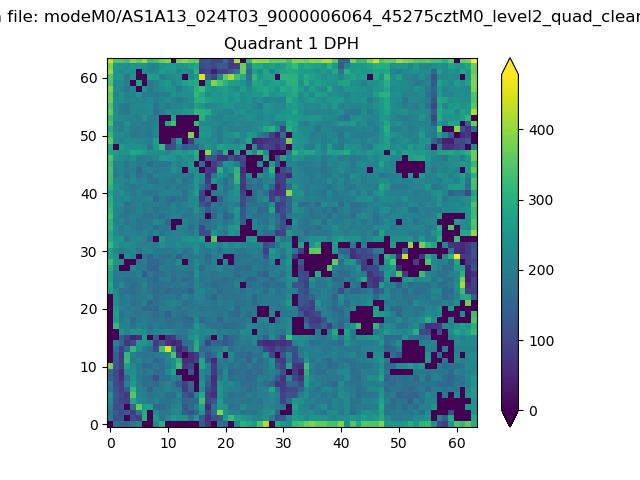 |
Quadrant B |
|---|---|---|---|
| Quadrant D | 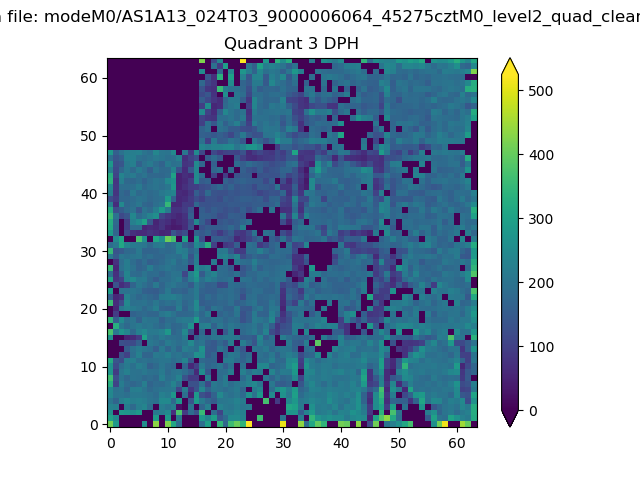 |
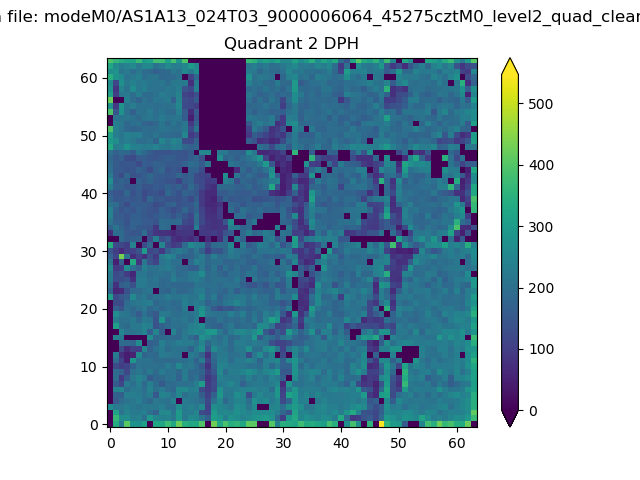 |
Quadrant C |
| Plot type | Count rate plots | Images |
|---|---|---|
| Comparison with Poisson distribution Blue bars denote a histogram of data divided into 1 sec bins. Red curve is a Poisson curve with rate = median count rate of data. |
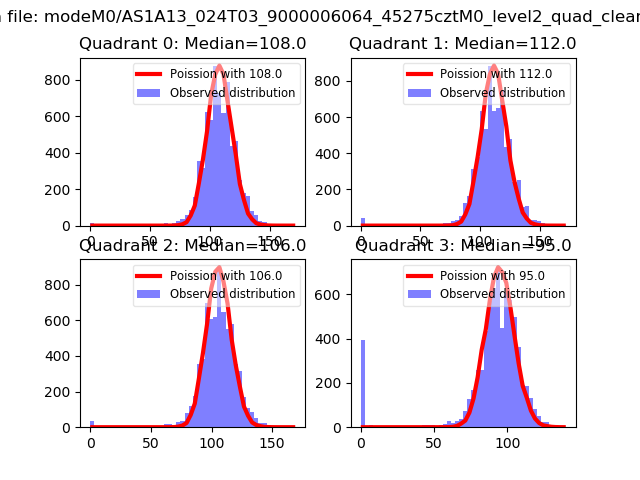 |
 |
| Quadrant-wise count rates Data is divided into 100 sec bins |
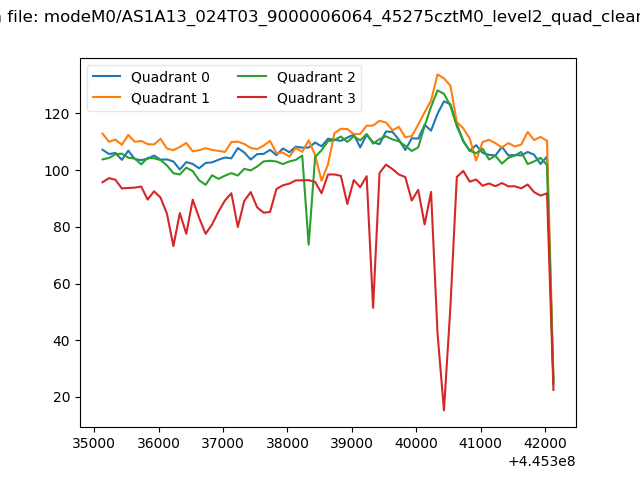 |
|
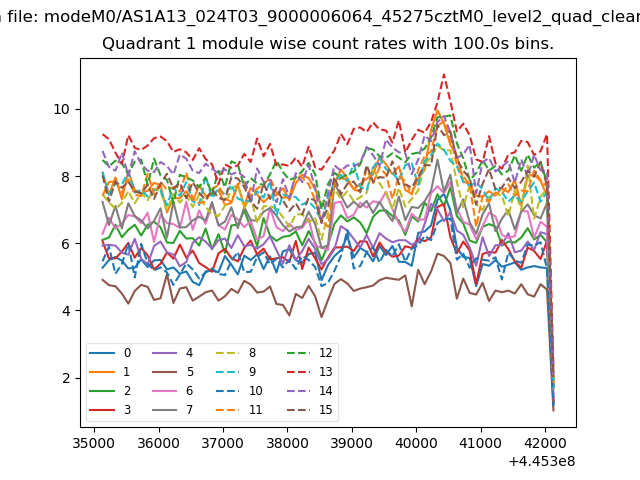
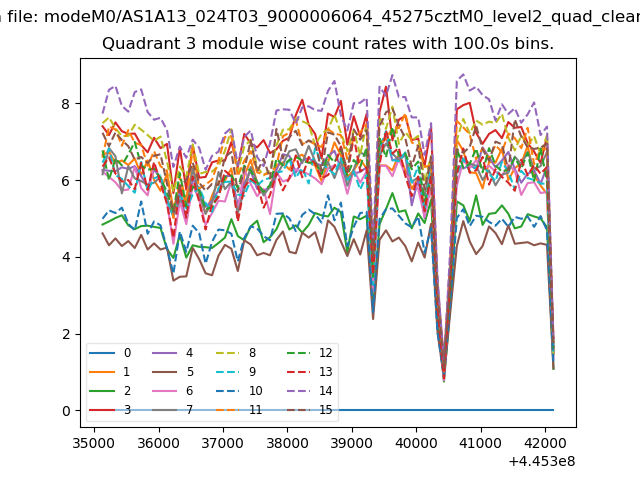
| Module-wise count rates for Quadrant A Data is divided into 100 sec bins |
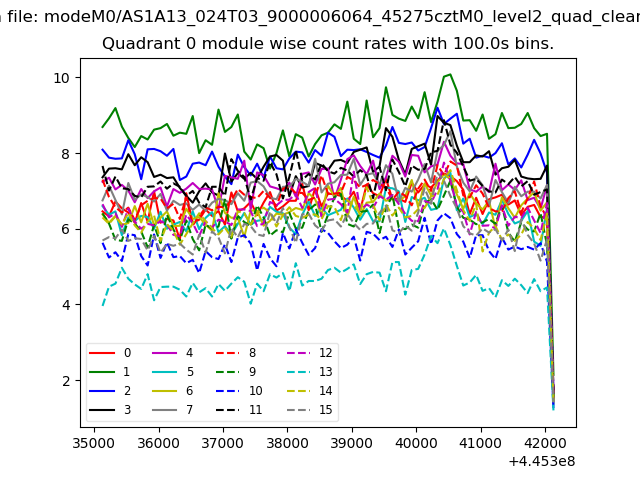 |
 |
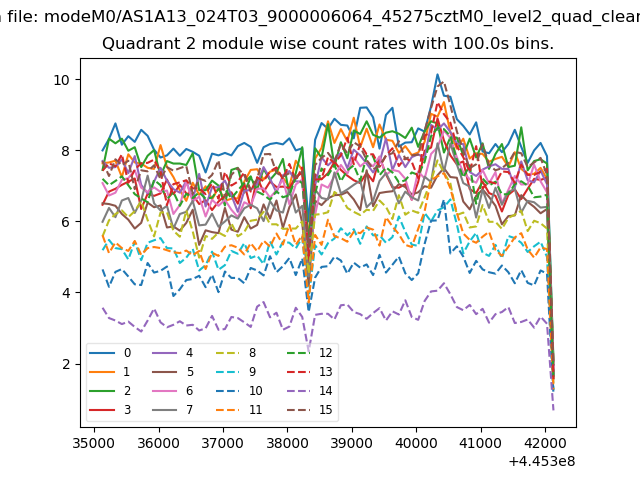
| Module-wise count rates for Quadrant B Data is divided into 100 sec bins |
 |
 |
| Module-wise count rates for Quadrant C Data is divided into 100 sec bins |
 |
 |
| Module-wise count rates for Quadrant D Data is divided into 100 sec bins |
 |
 |
| Parameter | Plot |
|---|---|
| CZT HV Monitor | 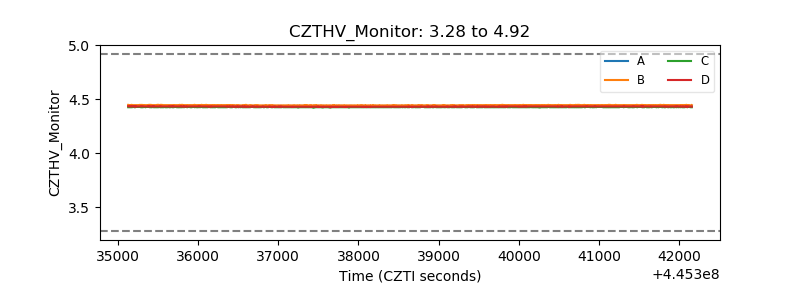 |
| D_VDD | 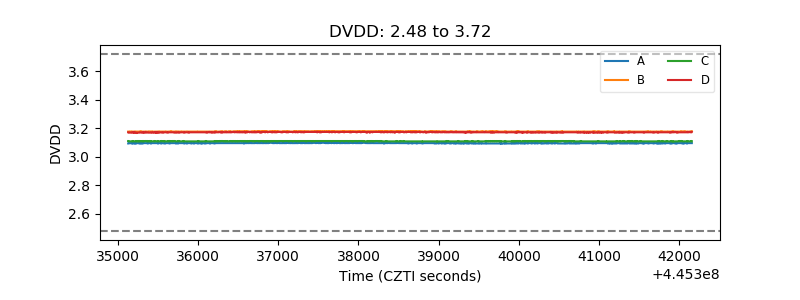 |
| Temperature 1 | 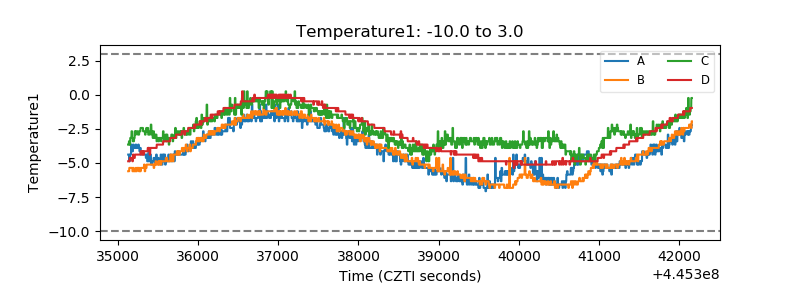 |
| Veto HV Monitor | 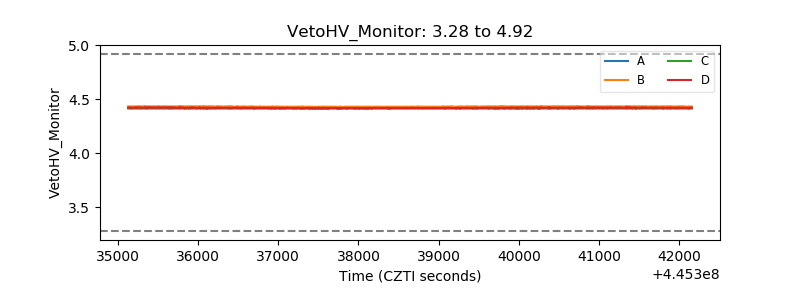 |
| Veto LLD | 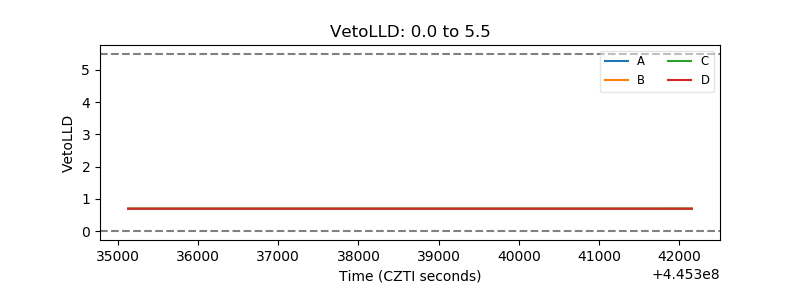 |
| Alpha Counter | 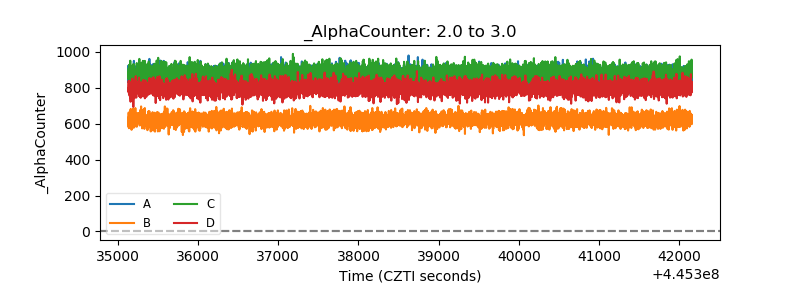 |
| _CPM_Rate | 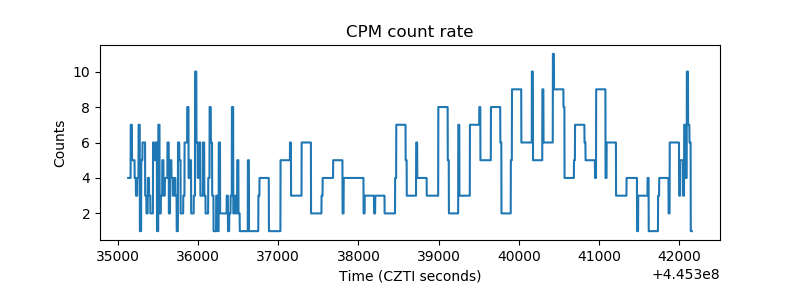 |
| CZT Counter | 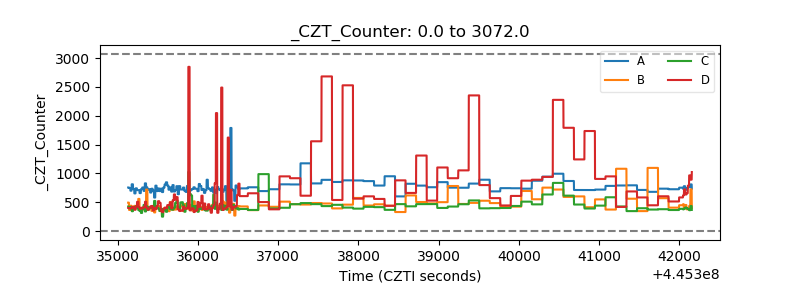 |
| +2.5 Volts monitor | 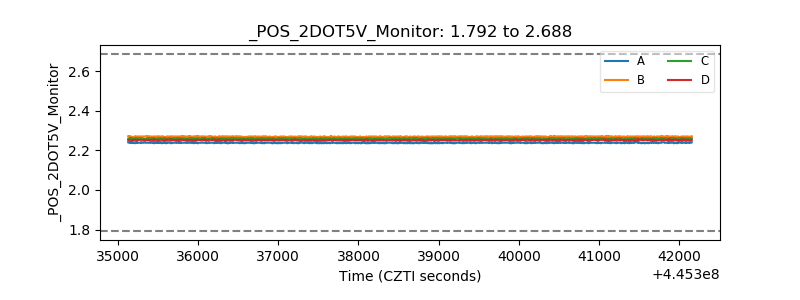 |
| +5 Volts monitor | 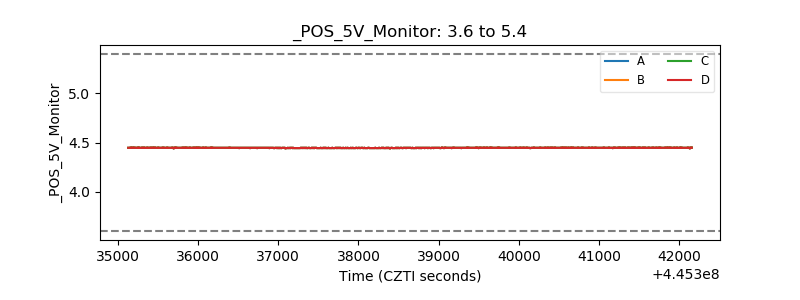 |
| _ROLL_ROT | 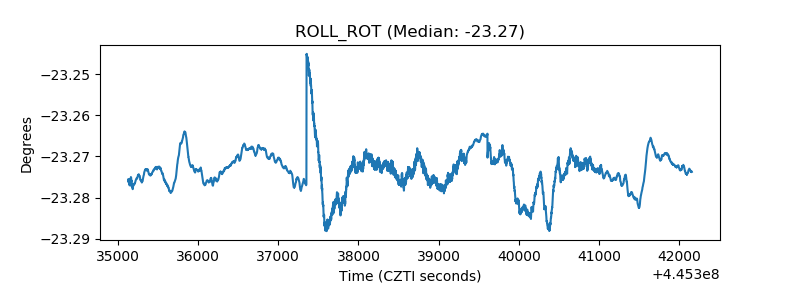 |
| _Roll_DEC | 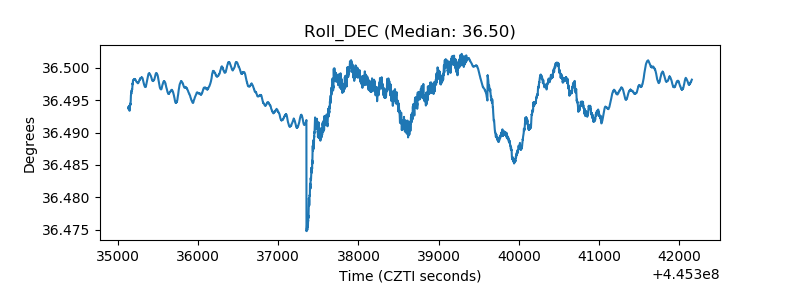 |
| _Roll_RA | 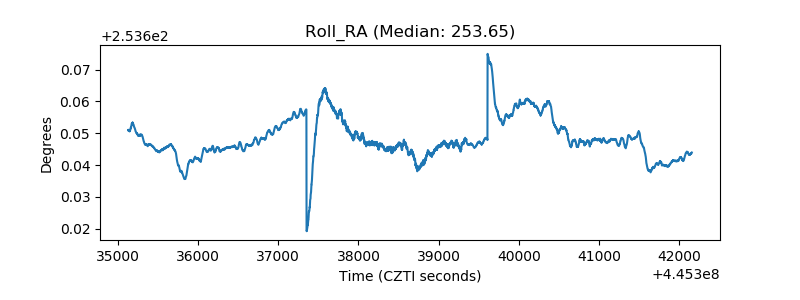 |
| Veto Counter | 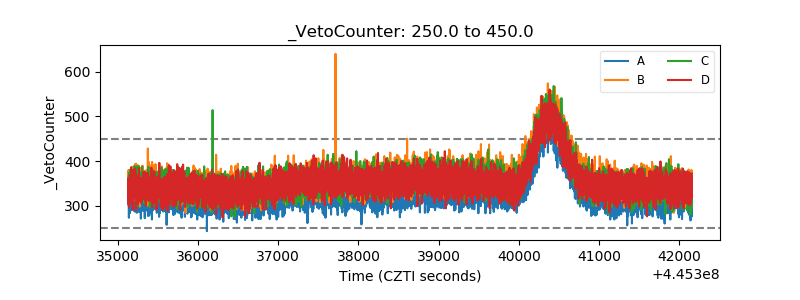 |