| Param | Original file | Final file |
|---|---|---|
| Filename | modeM0/AS1A13_024T03_9000006064_45276cztM0_level2.fits | modeM0/AS1A13_024T03_9000006064_45276cztM0_level2_quad_clean.evt |
| Size (bytes) | 529,686,720 | 118,926,720 |
| Size | 505.1 MB | 113.4 MB |
| Events in quadrant A | 6,000,632 | 791,489 |
| Events in quadrant B | 3,679,185 | 824,121 |
| Events in quadrant C | 3,541,111 | 778,433 |
| Events in quadrant D | 5,808,212 | 687,499 |
| Mode M0 | |||
|---|---|---|---|
| Quadrant | BADHDUFLAG | Total packets | Discarded packets |
| A | 0 | 23039 | 0 |
| B | 0 | 16042 | 0 |
| C | 0 | 16021 | 0 |
| D | 0 | 22382 | 3 |
| Mode SS | |||
|---|---|---|---|
| Quadrant | BADHDUFLAG | Total packets | Discarded packets |
| A | 0 | 150 | 0 |
| B | 0 | 150 | 0 |
| C | 0 | 150 | 0 |
| D | 0 | 150 | 0 |
| Quadrant | Total seconds | Saturated seconds | Saturation percentage |
|---|---|---|---|
| A | 7459 | 78 | 1.045717% |
| B | 7460 | 43 | 0.576408% |
| C | 7460 | 38 | 0.509383% |
| D | 7459 | 319 | 4.276713% |
Noise dominated data is calculated using 1-second bins in cleaned event files. If a bin has >2000 counts, and if more than 50% of those come from <1% of pixels, then it is considered to be noise-dominated and hence unusable.
| Quadrant | # 1 sec bins | Bins with >0 counts | Bins with >2000 counts | High rate bins dominated by noise | Noise dominated (total time) | Noise dominated (detector-on time) | Marked lightcurve |
|---|---|---|---|---|---|---|---|
| A | 7459 | 7459 | 48 | 48 | 0.64% | 0.64% | 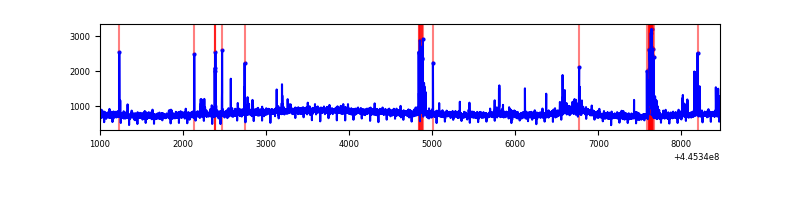 |
| B | 7460 | 7460 | 31 | 31 | 0.42% | 0.42% | 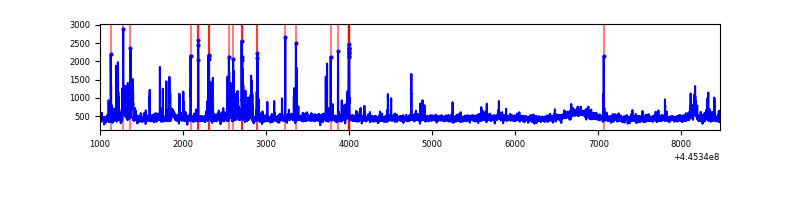 |
| C | 7460 | 7460 | 20 | 20 | 0.27% | 0.27% | 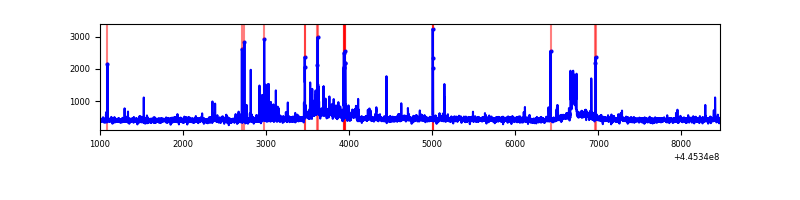 |
| D | 7459 | 7459 | 326 | 326 | 4.37% | 4.37% | 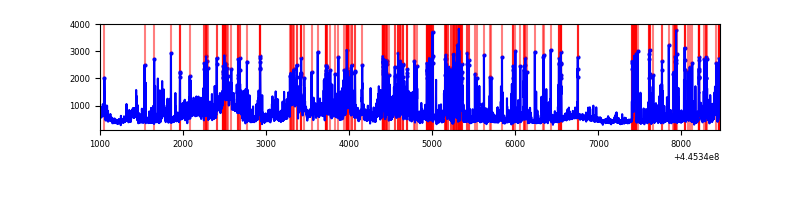 |
Top three noisy pixels from each quadrant. If the there are fewer than three noisy pixels in the level2.evt file, extra rows are filled as -1
| Pixel properties | Quadrant properties | ||||||
|---|---|---|---|---|---|---|---|
| Quadrant | DetID | PixID | Counts | Sigma | Mean | Median | Sigma |
| A | 10 | 83 | 2584510 | 15007.99 | 821 | 804 | 172.2 |
| A | 13 | 248 | 224627 | 1300.12 | 821 | 804 | 172.2 |
| A | 7 | 3 | 11199 | 60.38 | 821 | 804 | 172.2 |
| B | 4 | 171 | 268241 | 1620.61 | 823 | 797 | 165.0 |
| B | 0 | 186 | 27141 | 159.63 | 823 | 797 | 165.0 |
| B | 12 | 3 | 24935 | 146.26 | 823 | 797 | 165.0 |
| C | 12 | 2 | 229531 | 1207.95 | 801 | 806 | 189.3 |
| C | 14 | 254 | 140918 | 739.97 | 801 | 806 | 189.3 |
| C | 3 | 233 | 28012 | 143.68 | 801 | 806 | 189.3 |
| D | 13 | 249 | 690998 | 3462.39 | 788 | 765 | 199.4 |
| D | 12 | 33 | 499290 | 2500.73 | 788 | 765 | 199.4 |
| D | 11 | 241 | 317557 | 1589.11 | 788 | 765 | 199.4 |
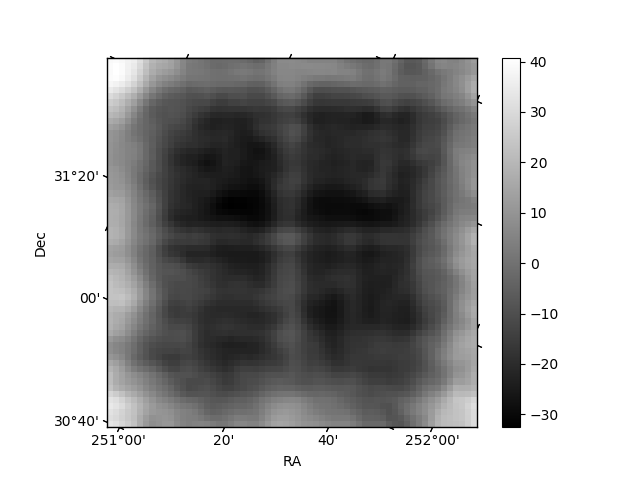
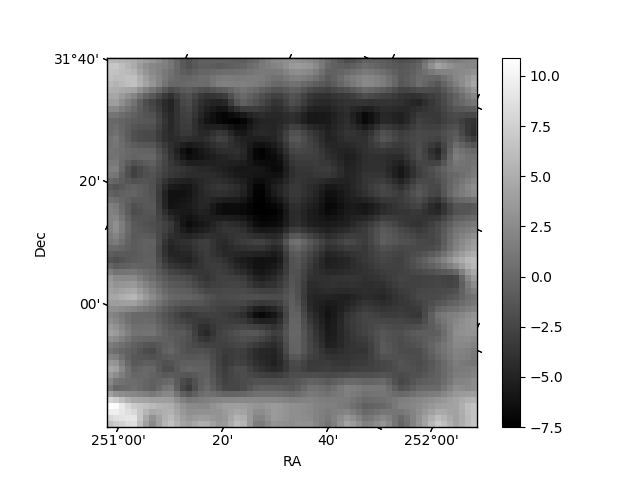
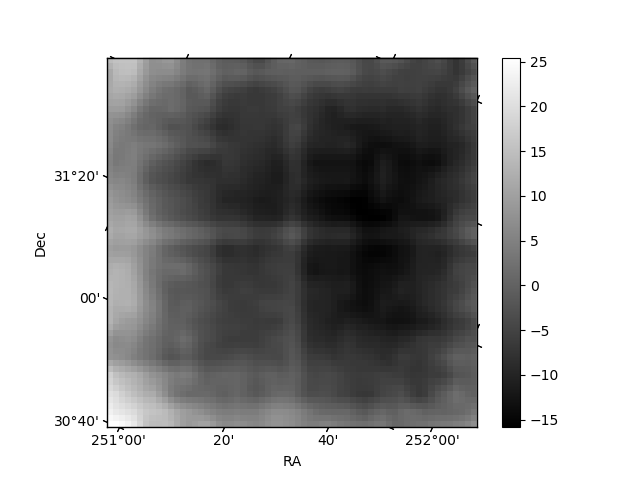
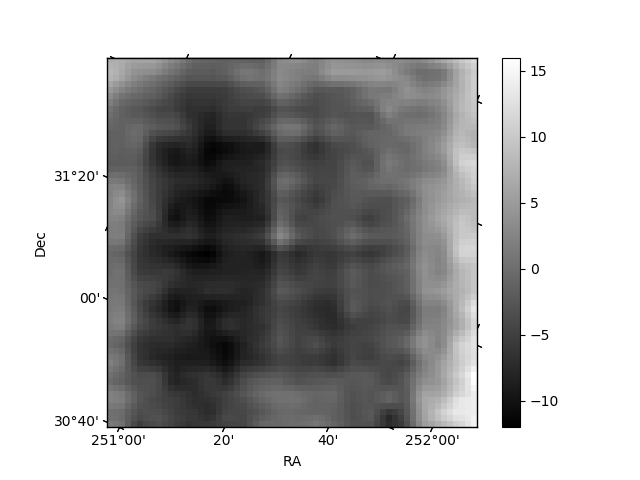
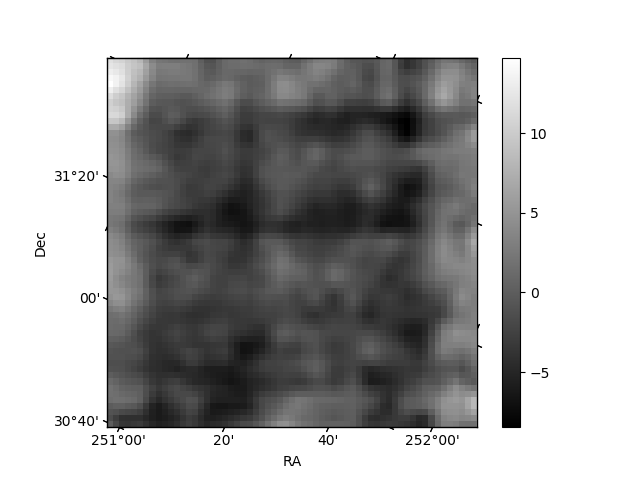
Histogram calculated using DETX and DETY for each event in the final _common_clean file
| Quadrant A | 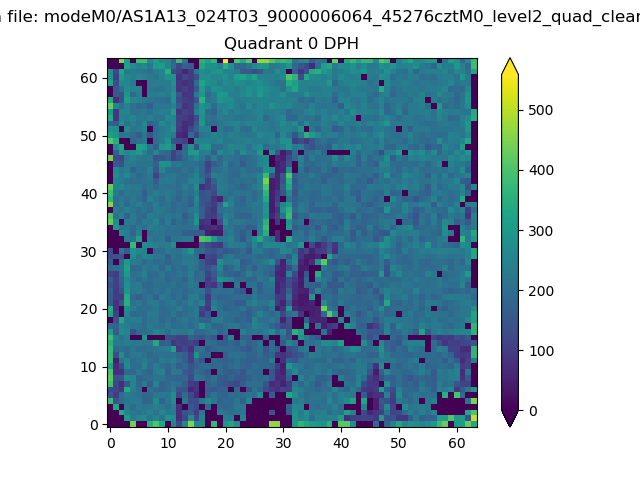 |
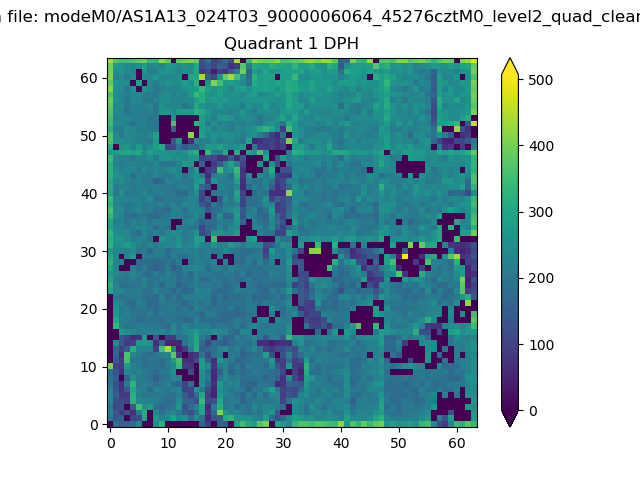 |
Quadrant B |
|---|---|---|---|
| Quadrant D | 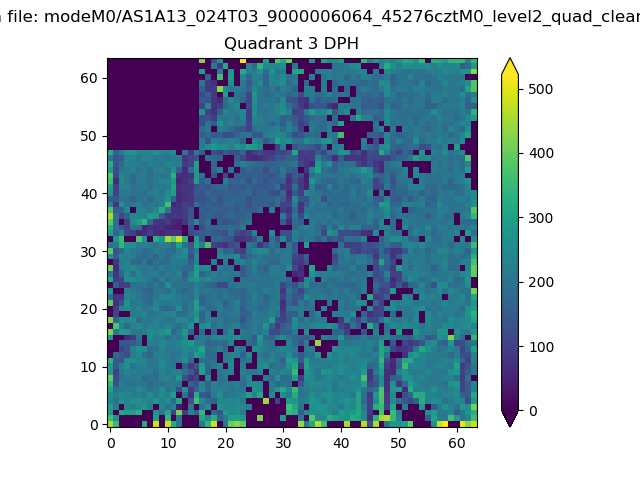 |
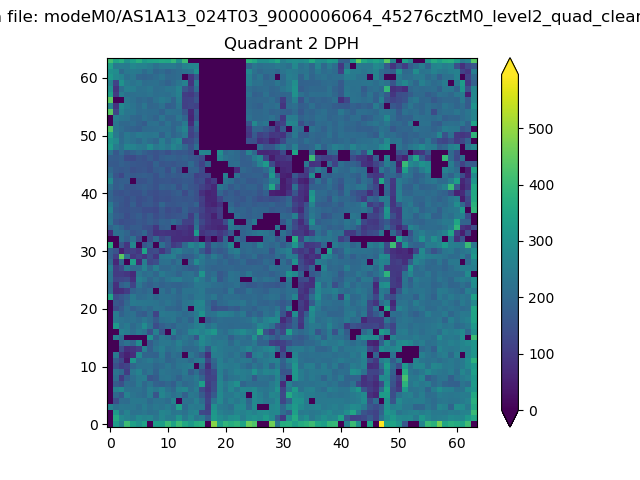 |
Quadrant C |
| Plot type | Count rate plots | Images |
|---|---|---|
| Comparison with Poisson distribution Blue bars denote a histogram of data divided into 1 sec bins. Red curve is a Poisson curve with rate = median count rate of data. |
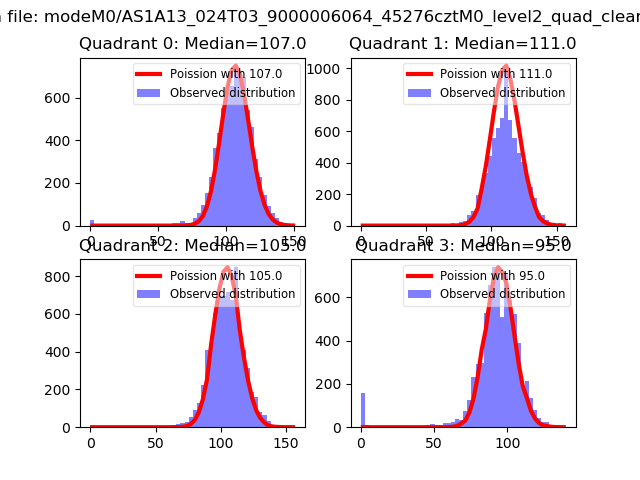 |
 |
| Quadrant-wise count rates Data is divided into 100 sec bins |
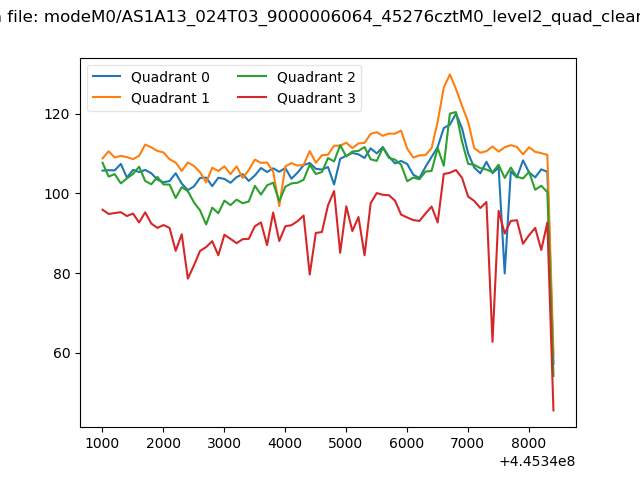 |
|
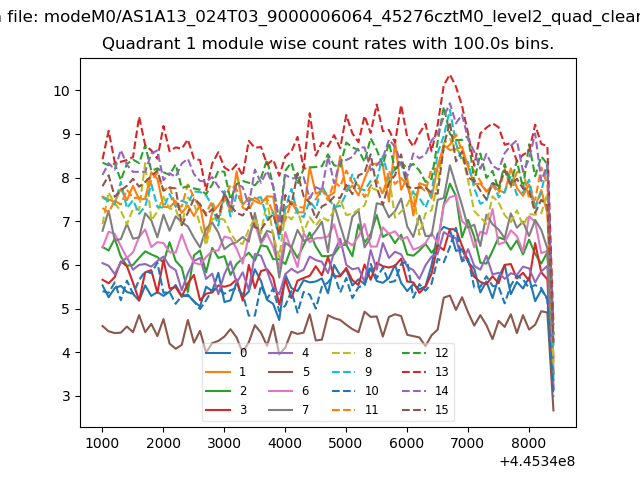
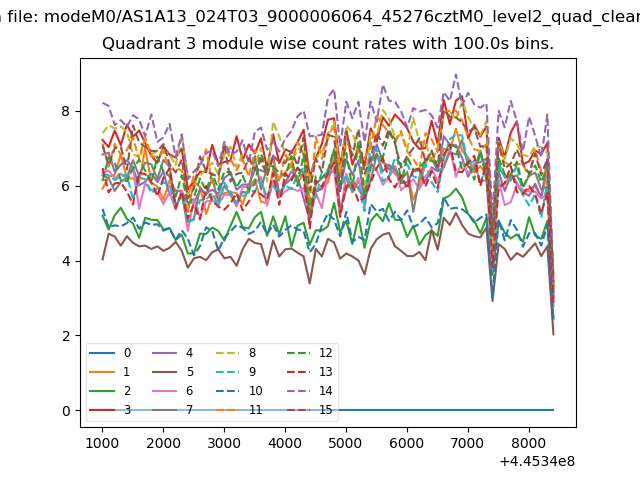
| Module-wise count rates for Quadrant A Data is divided into 100 sec bins |
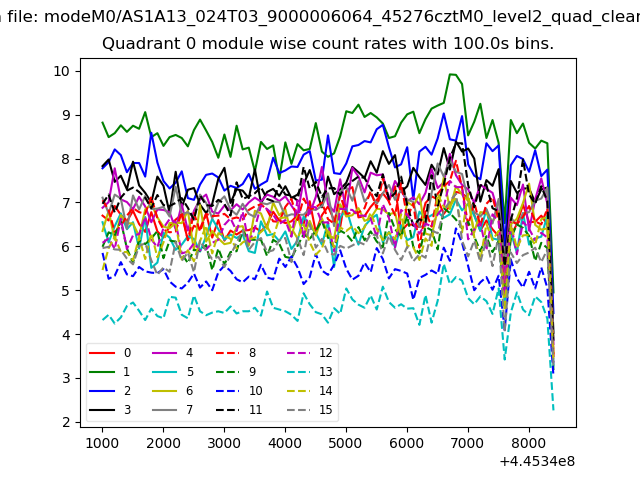 |
 |
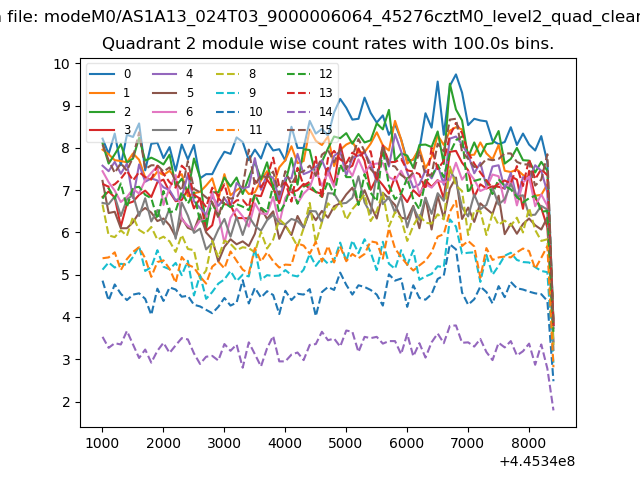
| Module-wise count rates for Quadrant B Data is divided into 100 sec bins |
 |
 |
| Module-wise count rates for Quadrant C Data is divided into 100 sec bins |
 |
 |
| Module-wise count rates for Quadrant D Data is divided into 100 sec bins |
 |
 |
| Parameter | Plot |
|---|---|
| CZT HV Monitor | 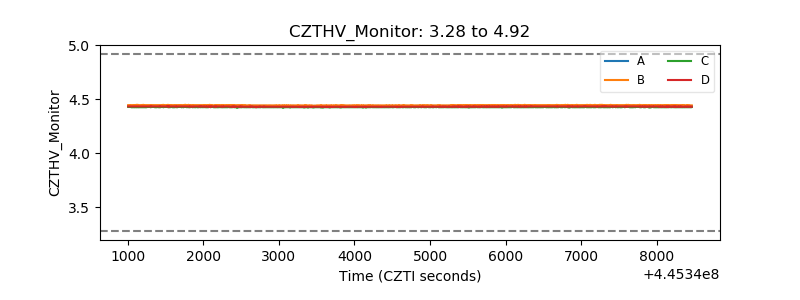 |
| D_VDD | 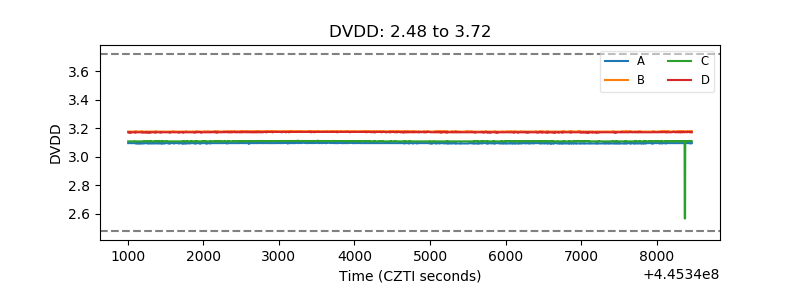 |
| Temperature 1 | 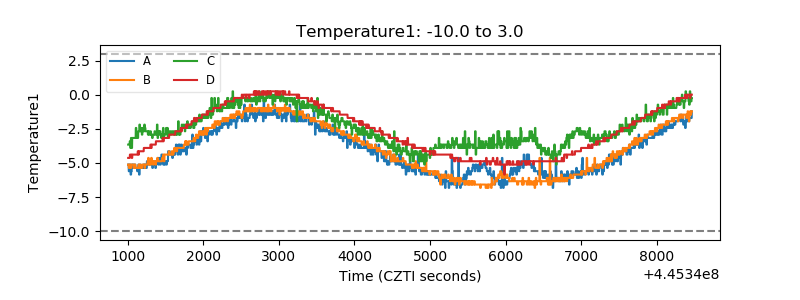 |
| Veto HV Monitor | 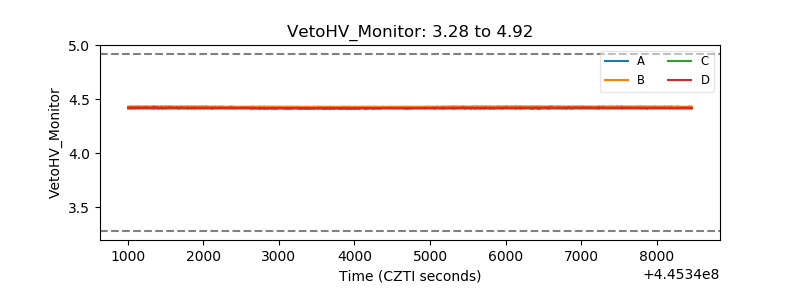 |
| Veto LLD | 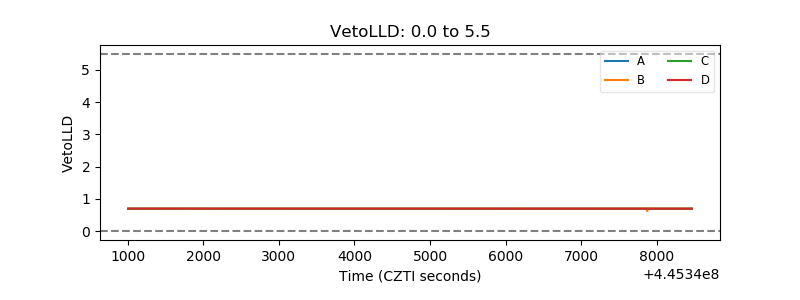 |
| Alpha Counter | 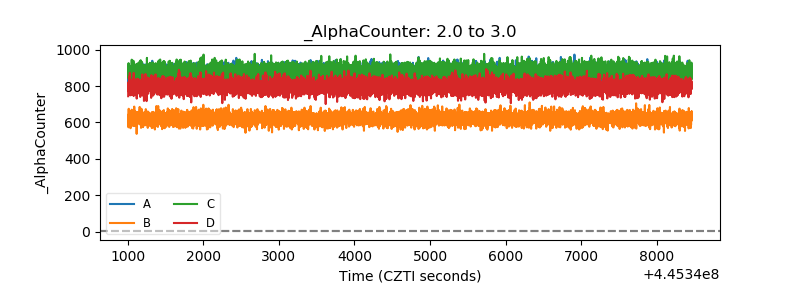 |
| _CPM_Rate | 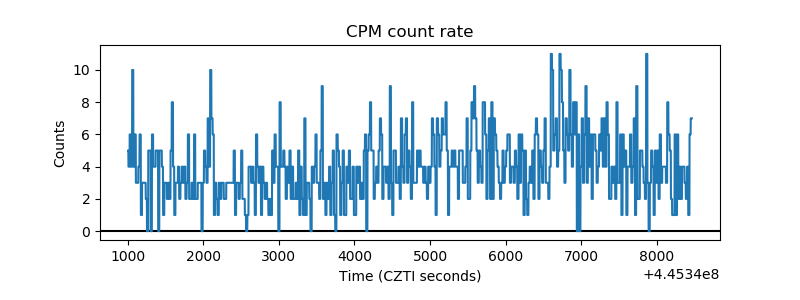 |
| CZT Counter | 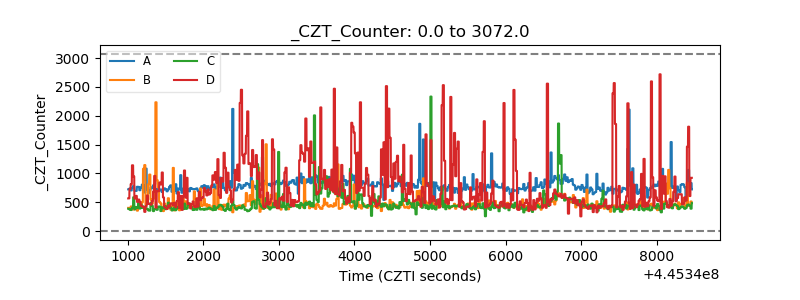 |
| +2.5 Volts monitor | 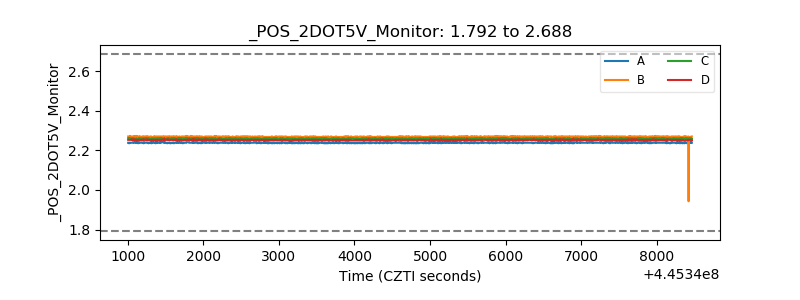 |
| +5 Volts monitor | 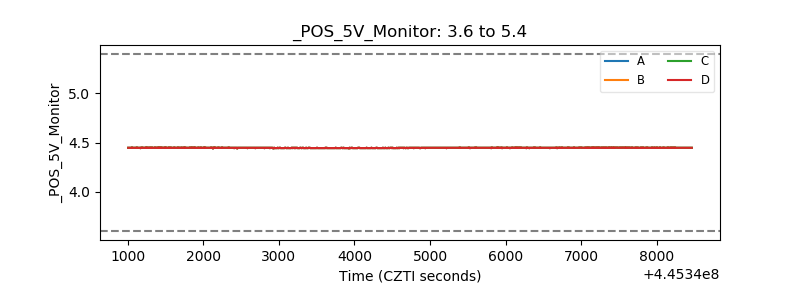 |
| _ROLL_ROT | 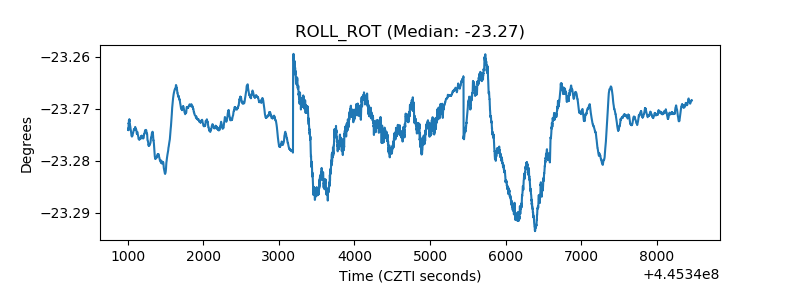 |
| _Roll_DEC | 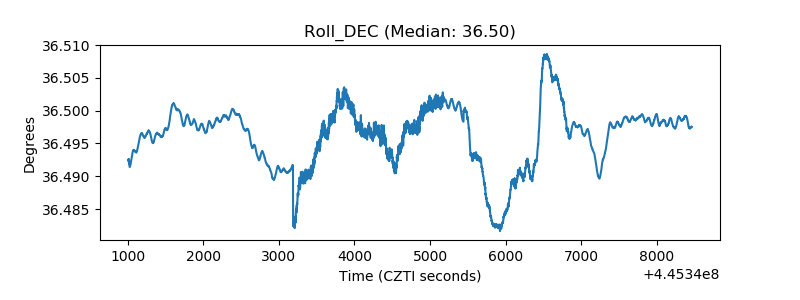 |
| _Roll_RA | 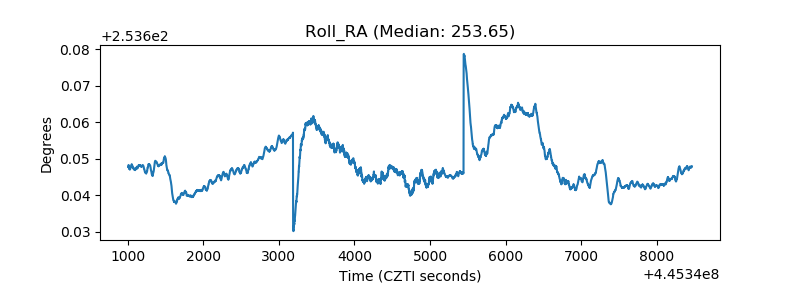 |
| Veto Counter | 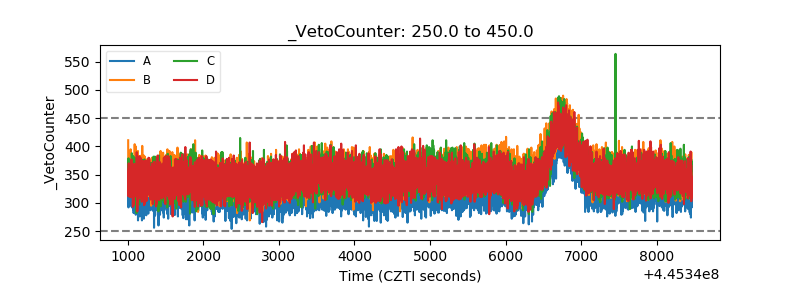 |