| Param | Original file | Final file |
|---|---|---|
| Filename | modeM0/AS1A13_024T03_9000006064_45277cztM0_level2.fits | modeM0/AS1A13_024T03_9000006064_45277cztM0_level2_quad_clean.evt |
| Size (bytes) | 578,275,200 | 125,625,600 |
| Size | 551.5 MB | 119.8 MB |
| Events in quadrant A | 6,367,032 | 845,087 |
| Events in quadrant B | 3,806,963 | 878,020 |
| Events in quadrant C | 4,380,685 | 812,466 |
| Events in quadrant D | 6,235,884 | 716,371 |
| Mode M0 | |||
|---|---|---|---|
| Quadrant | BADHDUFLAG | Total packets | Discarded packets |
| A | 0 | 24462 | 6 |
| B | 0 | 16759 | 0 |
| C | 0 | 18773 | 0 |
| D | 0 | 23974 | 8 |
| Mode SS | |||
|---|---|---|---|
| Quadrant | BADHDUFLAG | Total packets | Discarded packets |
| A | 0 | 158 | 0 |
| B | 0 | 158 | 0 |
| C | 0 | 158 | 0 |
| D | 0 | 158 | 0 |
| Quadrant | Total seconds | Saturated seconds | Saturation percentage |
|---|---|---|---|
| A | 7935 | 132 | 1.663516% |
| B | 7937 | 79 | 0.995338% |
| C | 7938 | 233 | 2.935248% |
| D | 7937 | 557 | 7.017765% |
Noise dominated data is calculated using 1-second bins in cleaned event files. If a bin has >2000 counts, and if more than 50% of those come from <1% of pixels, then it is considered to be noise-dominated and hence unusable.
| Quadrant | # 1 sec bins | Bins with >0 counts | Bins with >2000 counts | High rate bins dominated by noise | Noise dominated (total time) | Noise dominated (detector-on time) | Marked lightcurve |
|---|---|---|---|---|---|---|---|
| A | 7937 | 7936 | 37 | 37 | 0.47% | 0.47% |  |
| B | 7937 | 7937 | 14 | 14 | 0.18% | 0.18% |  |
| C | 7938 | 7938 | 216 | 216 | 2.72% | 2.72% |  |
| D | 7938 | 7937 | 487 | 487 | 6.14% | 6.14% |  |
Top three noisy pixels from each quadrant. If the there are fewer than three noisy pixels in the level2.evt file, extra rows are filled as -1
| Pixel properties | Quadrant properties | ||||||
|---|---|---|---|---|---|---|---|
| Quadrant | DetID | PixID | Counts | Sigma | Mean | Median | Sigma |
| A | 10 | 83 | 2731615 | 14697.97 | 896 | 877 | 185.8 |
| A | 13 | 248 | 163183 | 873.6 | 896 | 877 | 185.8 |
| A | 3 | 137 | 10583 | 52.24 | 896 | 877 | 185.8 |
| B | 5 | 32 | 37186 | 205.64 | 896 | 872 | 176.6 |
| B | 15 | 36 | 36453 | 201.49 | 896 | 872 | 176.6 |
| B | 0 | 183 | 29040 | 159.51 | 896 | 872 | 176.6 |
| C | 14 | 254 | 613269 | 3019.69 | 865 | 867 | 202.8 |
| C | 12 | 2 | 341346 | 1678.86 | 865 | 867 | 202.8 |
| C | 3 | 233 | 22772 | 108.01 | 865 | 867 | 202.8 |
| D | 13 | 249 | 1377150 | 6405.85 | 849 | 822 | 214.9 |
| D | 5 | 222 | 433956 | 2015.94 | 849 | 822 | 214.9 |
| D | 2 | 249 | 300646 | 1395.47 | 849 | 822 | 214.9 |
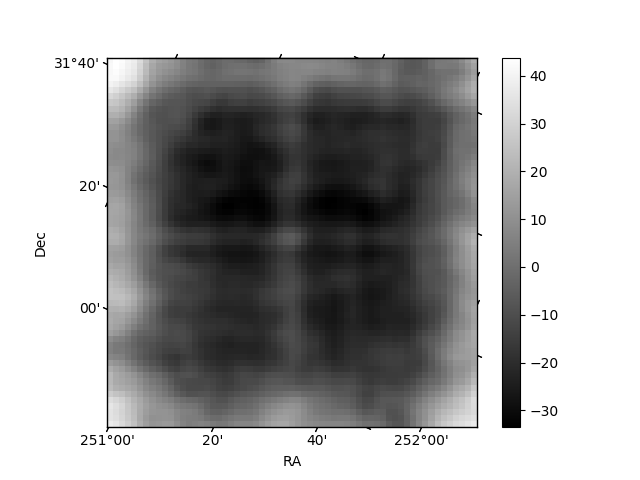
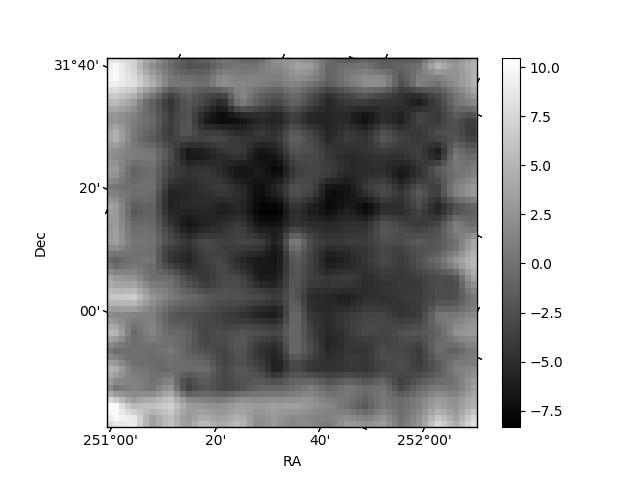
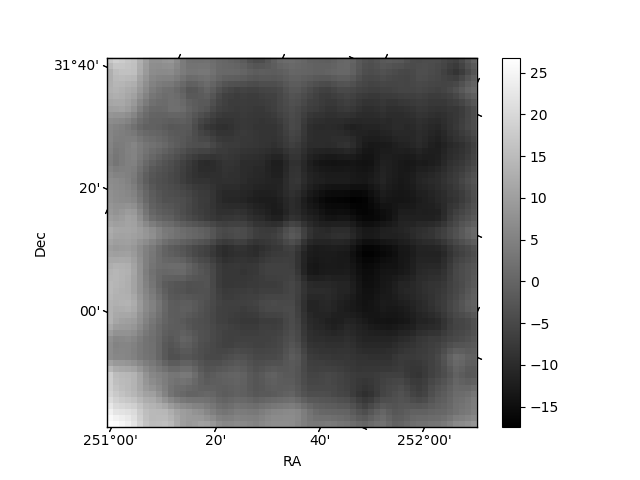
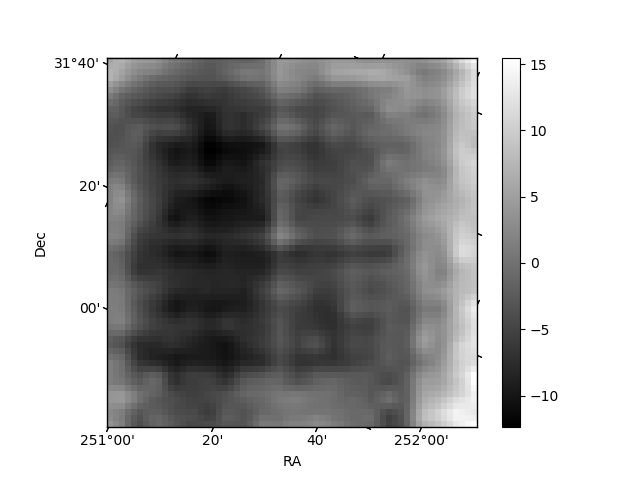
Histogram calculated using DETX and DETY for each event in the final _common_clean file
| Quadrant A | 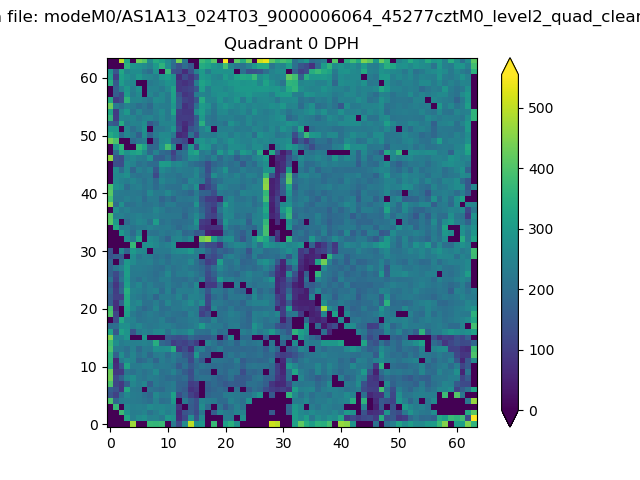 |
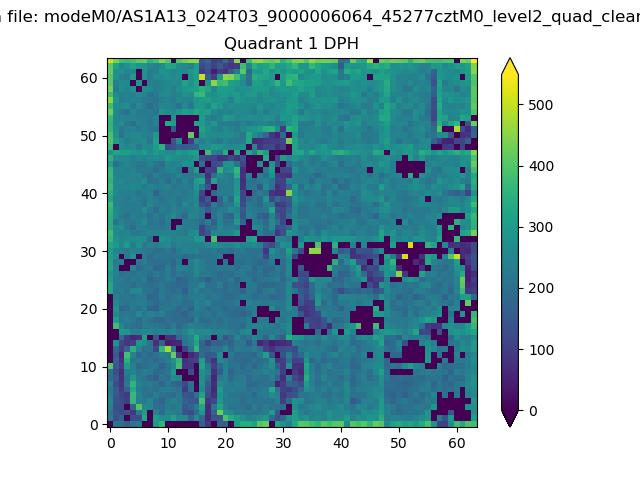 |
Quadrant B |
|---|---|---|---|
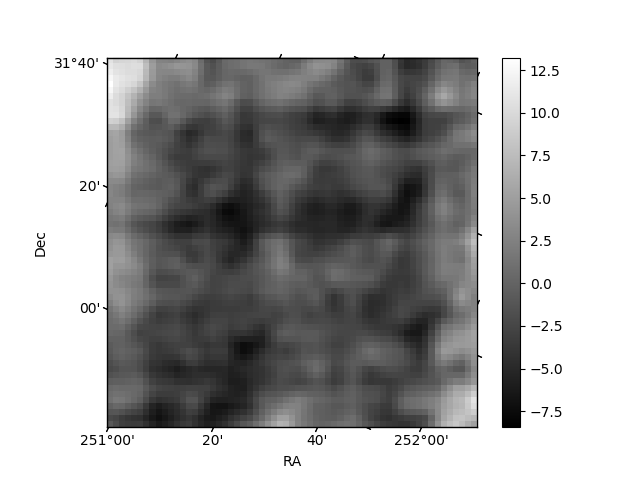
| Quadrant D | 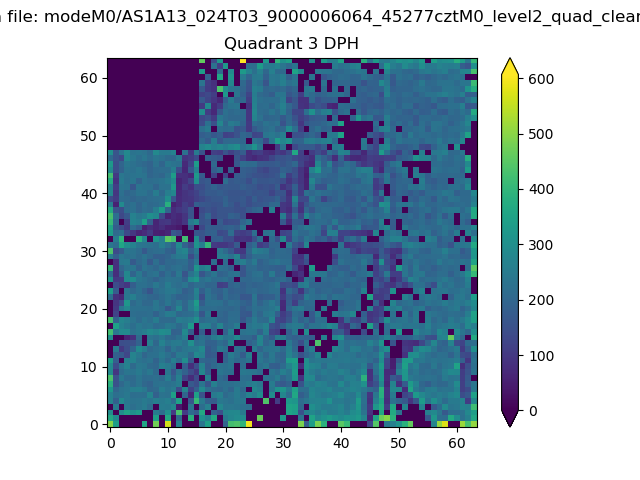 |
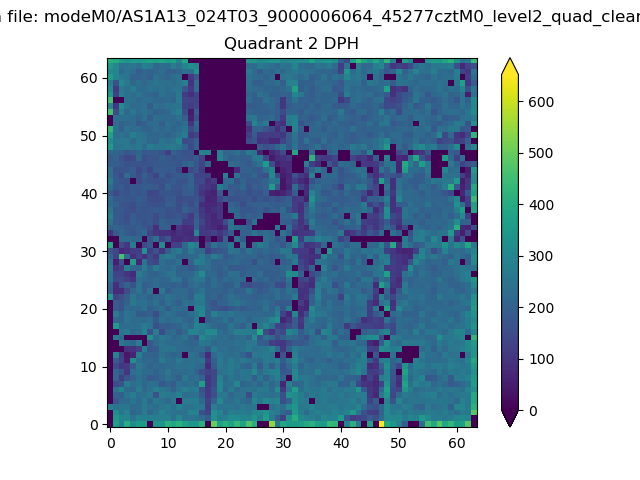 |
Quadrant C |
| Plot type | Count rate plots | Images |
|---|---|---|
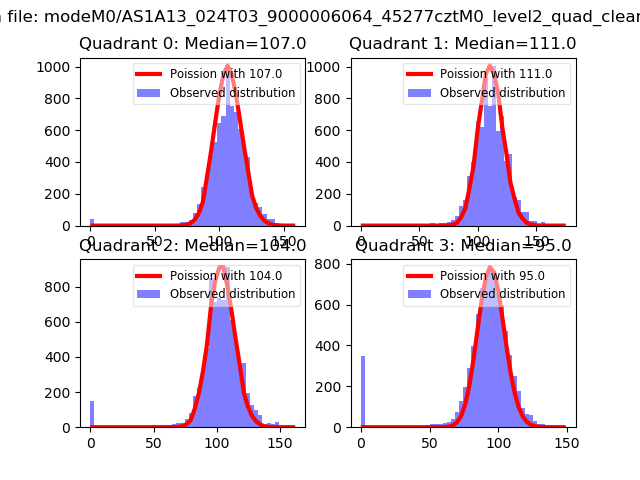
| Comparison with Poisson distribution Blue bars denote a histogram of data divided into 1 sec bins. Red curve is a Poisson curve with rate = median count rate of data. |
 |
 |
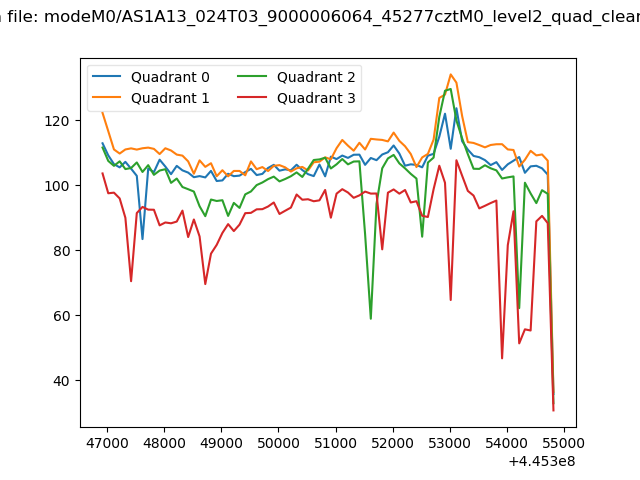
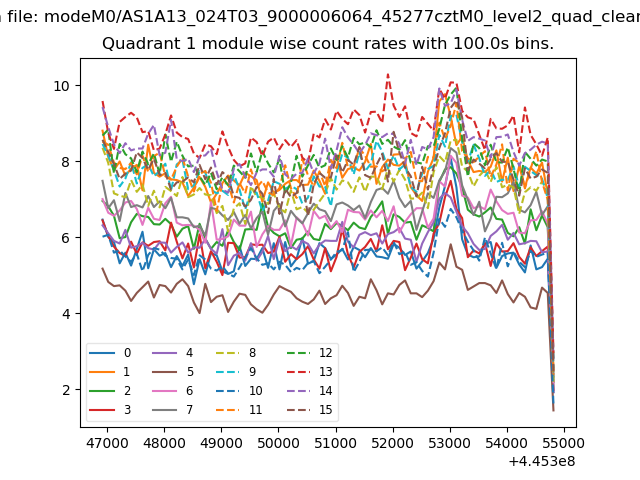
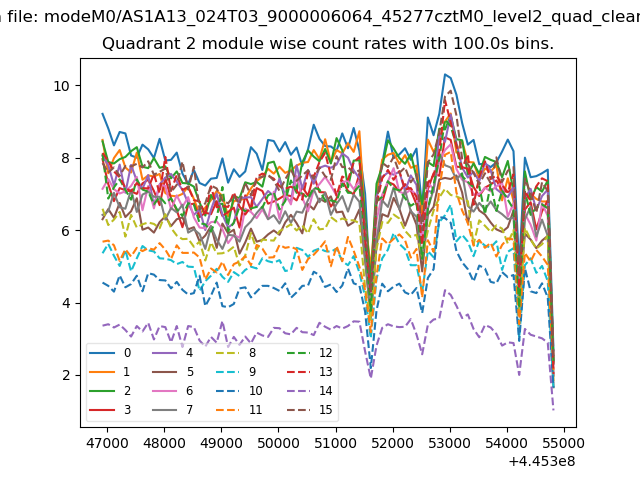
| Quadrant-wise count rates Data is divided into 100 sec bins |
 |
|
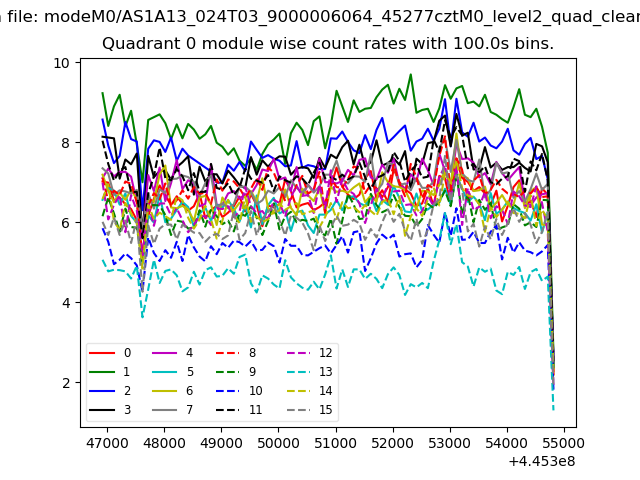
| Module-wise count rates for Quadrant A Data is divided into 100 sec bins |
 |
 |
| Module-wise count rates for Quadrant B Data is divided into 100 sec bins |
 |
 |
| Module-wise count rates for Quadrant C Data is divided into 100 sec bins |
 |
 |
| Module-wise count rates for Quadrant D Data is divided into 100 sec bins |
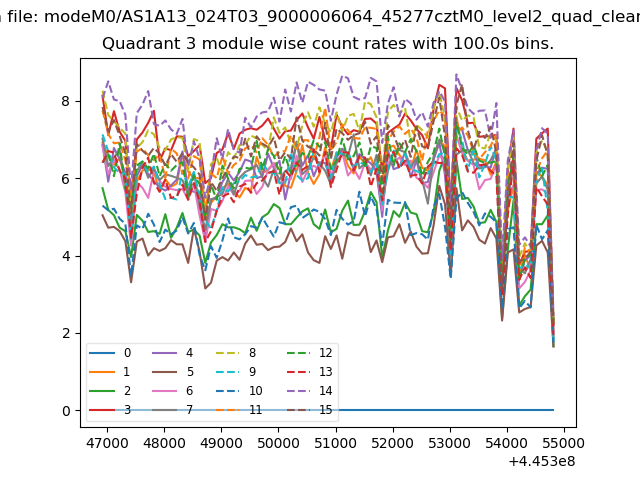 |
 |
| Parameter | Plot |
|---|---|
| CZT HV Monitor | 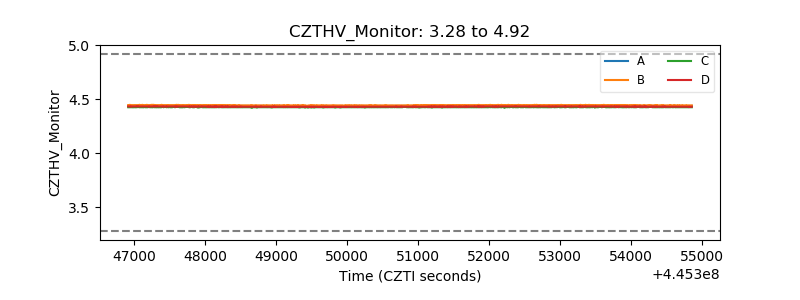 |
| D_VDD | 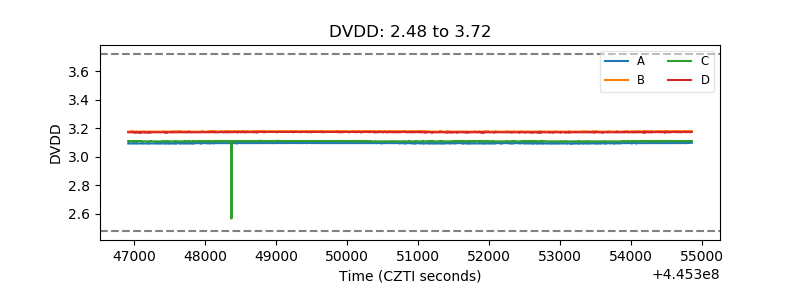 |
| Temperature 1 | 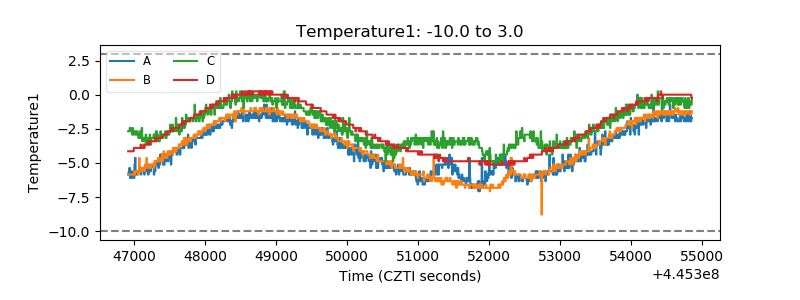 |
| Veto HV Monitor | 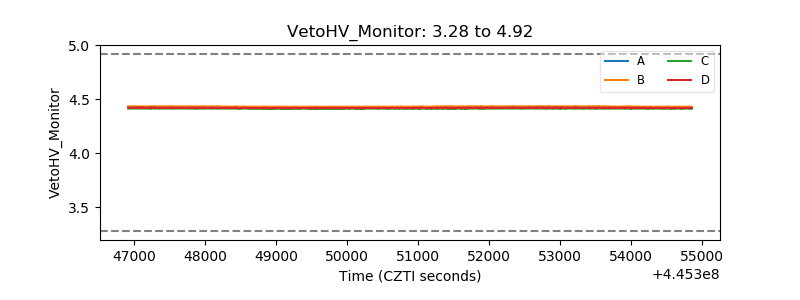 |
| Veto LLD | 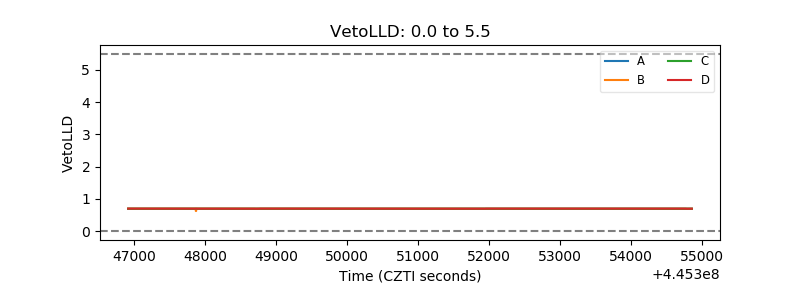 |
| Alpha Counter | 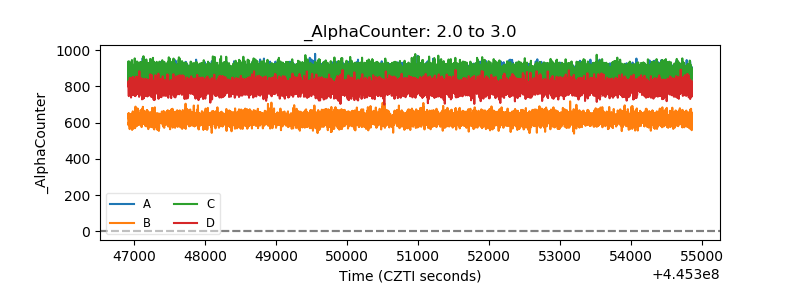 |
| _CPM_Rate | 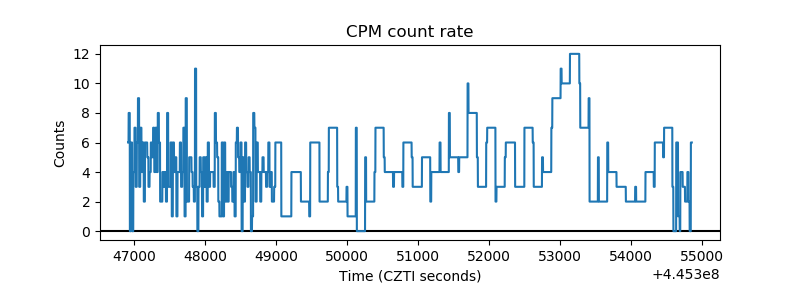 |
| CZT Counter | 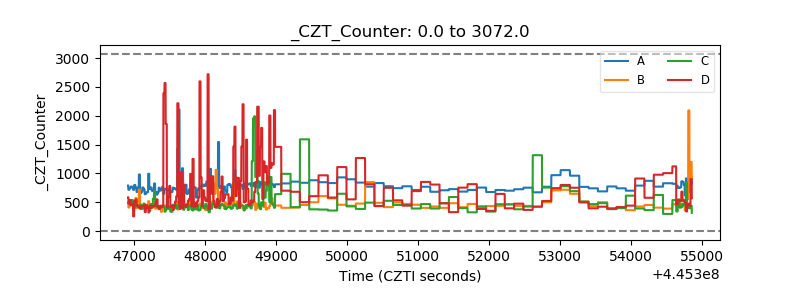 |
| +2.5 Volts monitor | 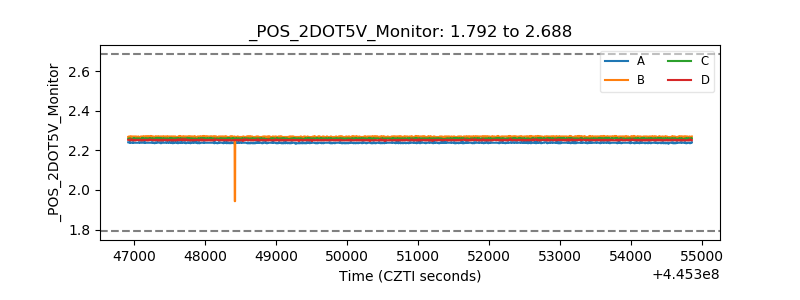 |
| +5 Volts monitor | 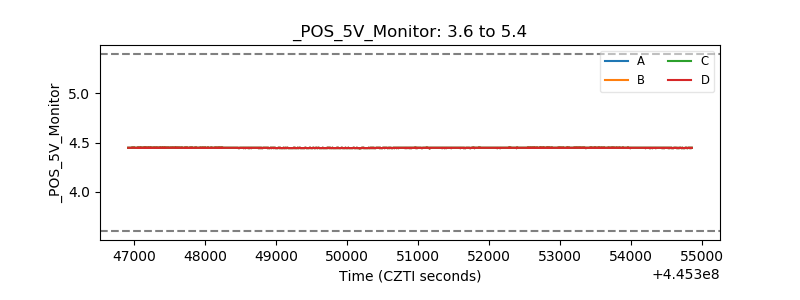 |
| _ROLL_ROT | 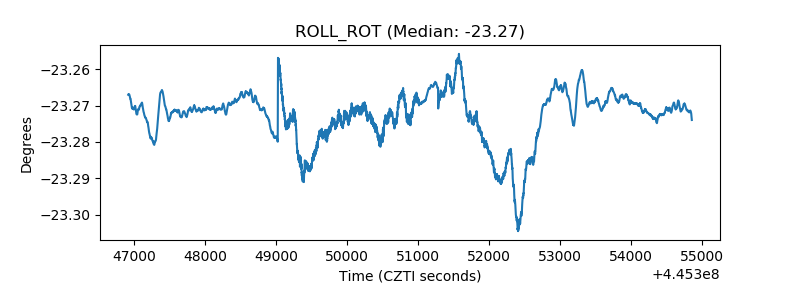 |
| _Roll_DEC | 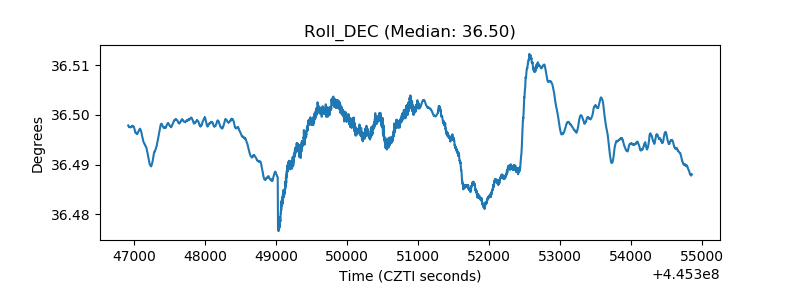 |
| _Roll_RA | 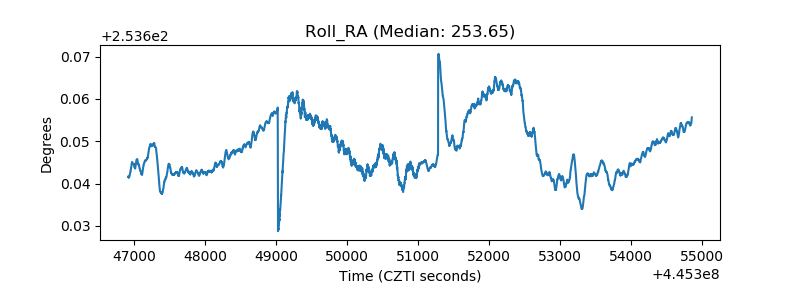 |
| Veto Counter | 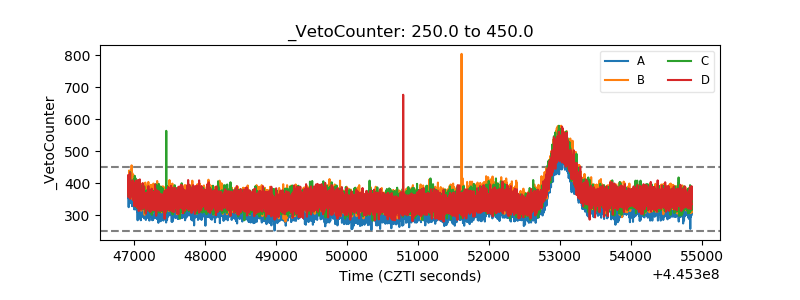 |