| Param | Original file | Final file |
|---|---|---|
| Filename | modeM0/AS1A13_024T03_9000006064_45280cztM0_level2.fits | modeM0/AS1A13_024T03_9000006064_45280cztM0_level2_quad_clean.evt |
| Size (bytes) | 1,406,450,880 | 280,293,120 |
| Size | 1.3 GB | 267.3 MB |
| Events in quadrant A | 15,483,206 | 1,864,171 |
| Events in quadrant B | 10,453,691 | 1,885,774 |
| Events in quadrant C | 10,544,728 | 1,836,106 |
| Events in quadrant D | 14,163,179 | 1,635,993 |
| Mode M0 | |||
|---|---|---|---|
| Quadrant | BADHDUFLAG | Total packets | Discarded packets |
| A | 0 | 59039 | 3 |
| B | 0 | 43654 | 3 |
| C | 0 | 44300 | 3 |
| D | 0 | 54911 | 3 |
| Mode SS | |||
|---|---|---|---|
| Quadrant | BADHDUFLAG | Total packets | Discarded packets |
| A | 0 | 370 | 0 |
| B | 0 | 370 | 0 |
| C | 0 | 370 | 0 |
| D | 0 | 370 | 0 |
| Mode M9 | |||
|---|---|---|---|
| Quadrant | BADHDUFLAG | Total packets | Discarded packets |
| A | 0 | 18 | 0 |
| B | 0 | 18 | 0 |
| C | 0 | 18 | 0 |
| D | 0 | 18 | 0 |
| Quadrant | Total seconds | Saturated seconds | Saturation percentage |
|---|---|---|---|
| A | 18345 | 629 | 3.428727% |
| B | 18345 | 964 | 5.254838% |
| C | 18345 | 760 | 4.142818% |
| D | 18345 | 1296 | 7.064595% |
Noise dominated data is calculated using 1-second bins in cleaned event files. If a bin has >2000 counts, and if more than 50% of those come from <1% of pixels, then it is considered to be noise-dominated and hence unusable.
| Quadrant | # 1 sec bins | Bins with >0 counts | Bins with >2000 counts | High rate bins dominated by noise | Noise dominated (total time) | Noise dominated (detector-on time) | Marked lightcurve |
|---|---|---|---|---|---|---|---|
| A | 20040 | 18345 | 199 | 199 | 0.99% | 1.08% | 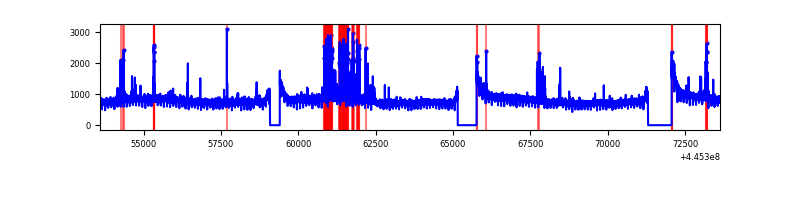 |
| B | 20040 | 18345 | 624 | 624 | 3.11% | 3.40% | 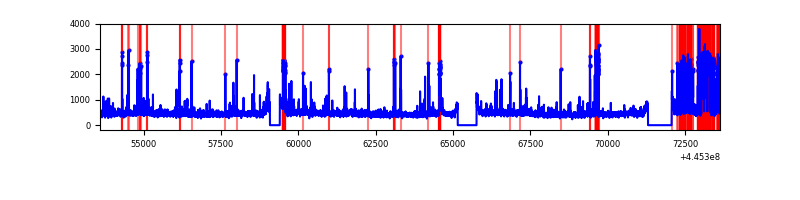 |
| C | 20040 | 18345 | 546 | 546 | 2.72% | 2.98% | 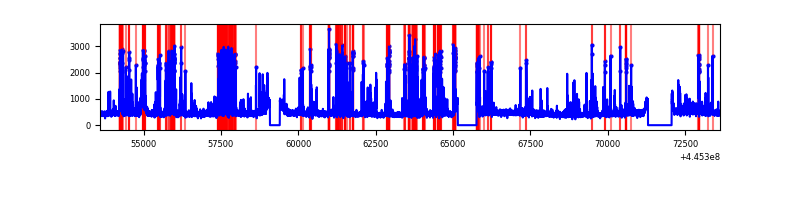 |
| D | 20040 | 18345 | 1069 | 1069 | 5.33% | 5.83% | 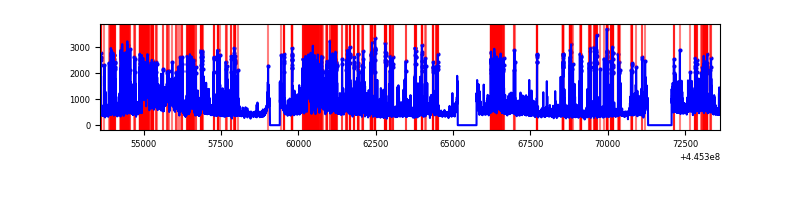 |
Top three noisy pixels from each quadrant. If the there are fewer than three noisy pixels in the level2.evt file, extra rows are filled as -1
| Pixel properties | Quadrant properties | ||||||
|---|---|---|---|---|---|---|---|
| Quadrant | DetID | PixID | Counts | Sigma | Mean | Median | Sigma |
| A | 10 | 83 | 6817897 | 16030.94 | 2046 | 2003 | 425.2 |
| A | 13 | 248 | 716848 | 1681.31 | 2046 | 2003 | 425.2 |
| A | 0 | 243 | 27337 | 59.58 | 2046 | 2003 | 425.2 |
| B | 4 | 171 | 1442114 | 3631.67 | 2009 | 1948 | 396.6 |
| B | 5 | 32 | 561455 | 1410.91 | 2009 | 1948 | 396.6 |
| B | 0 | 183 | 104288 | 258.07 | 2009 | 1948 | 396.6 |
| C | 14 | 254 | 2195598 | 4686.01 | 1996 | 2010 | 468.1 |
| C | 12 | 16 | 237181 | 502.38 | 1996 | 2010 | 468.1 |
| C | 3 | 233 | 178339 | 376.68 | 1996 | 2010 | 468.1 |
| D | 13 | 249 | 2039692 | 4118.58 | 1977 | 1922 | 494.8 |
| D | 2 | 249 | 1536165 | 3100.89 | 1977 | 1922 | 494.8 |
| D | 12 | 33 | 1087131 | 2193.34 | 1977 | 1922 | 494.8 |
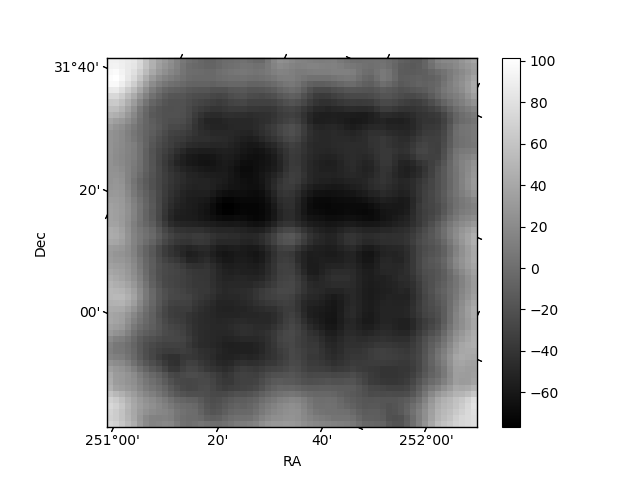
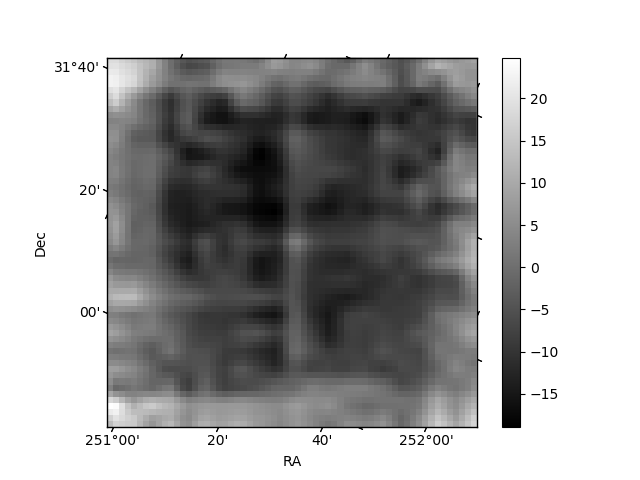
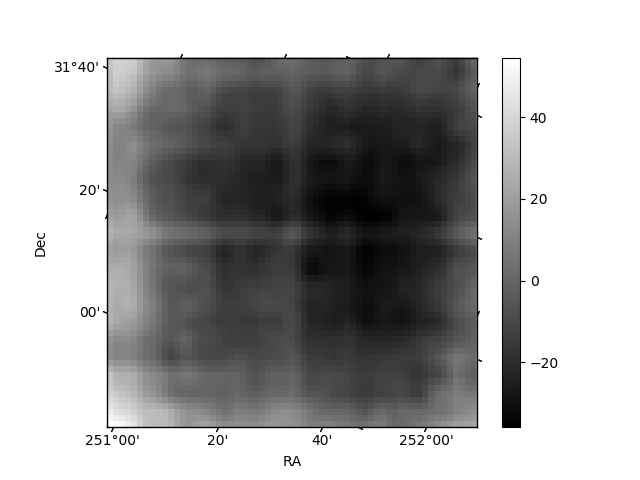
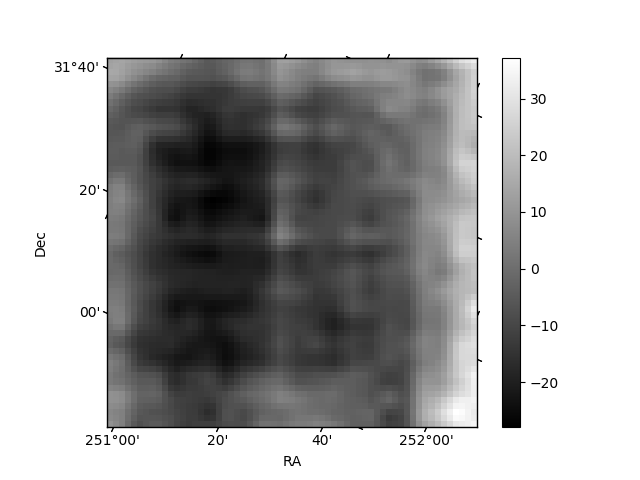
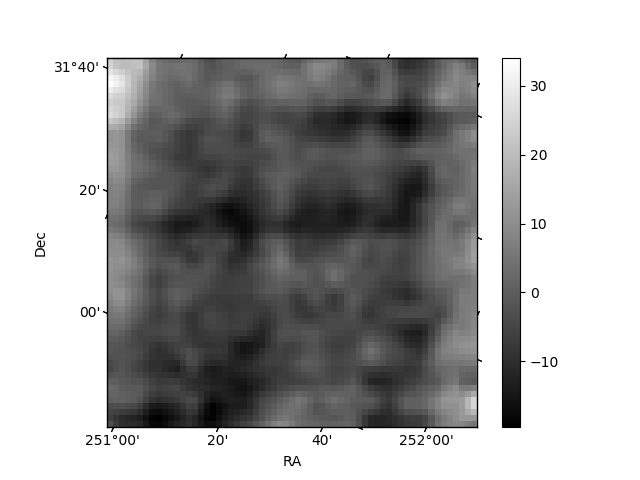
Histogram calculated using DETX and DETY for each event in the final _common_clean file
| Quadrant A | 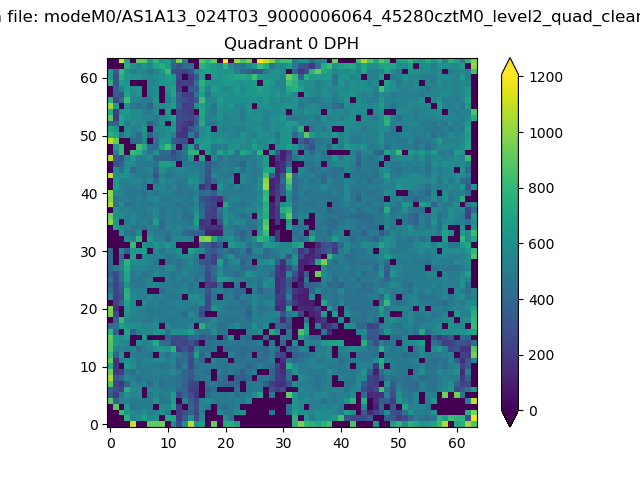 |
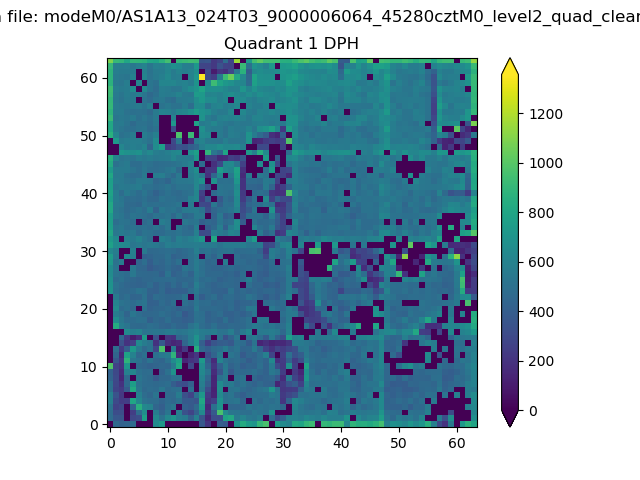 |
Quadrant B |
|---|---|---|---|
| Quadrant D | 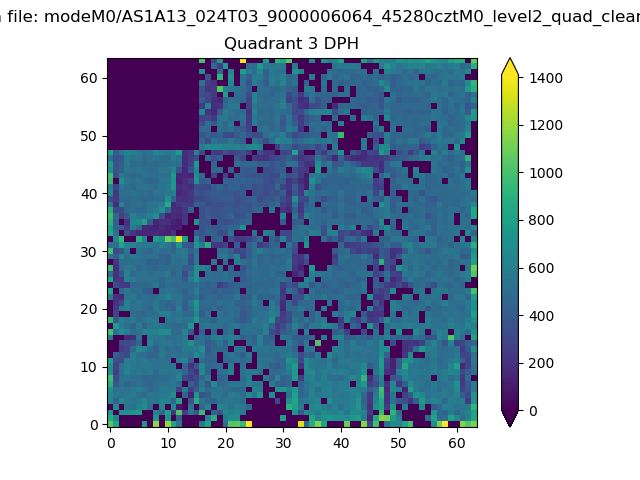 |
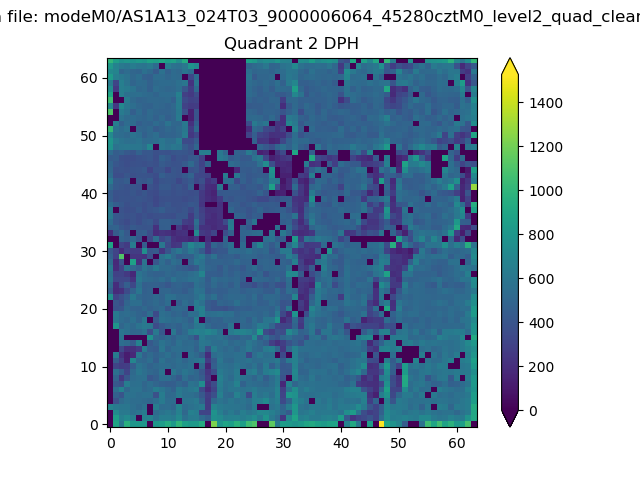 |
Quadrant C |
| Plot type | Count rate plots | Images |
|---|---|---|
| Comparison with Poisson distribution Blue bars denote a histogram of data divided into 1 sec bins. Red curve is a Poisson curve with rate = median count rate of data. |
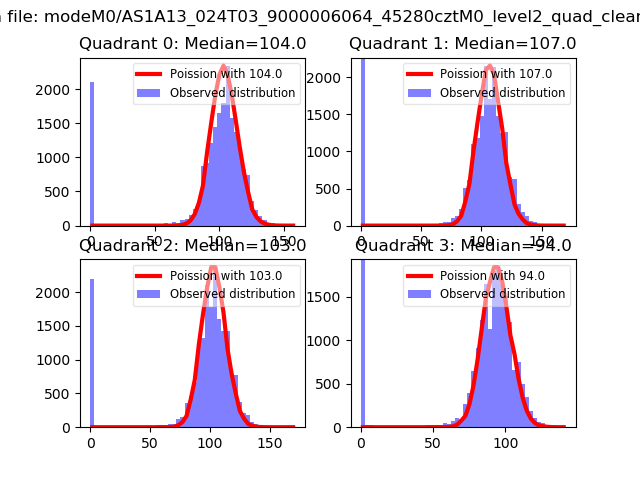 |
 |
| Quadrant-wise count rates Data is divided into 100 sec bins |
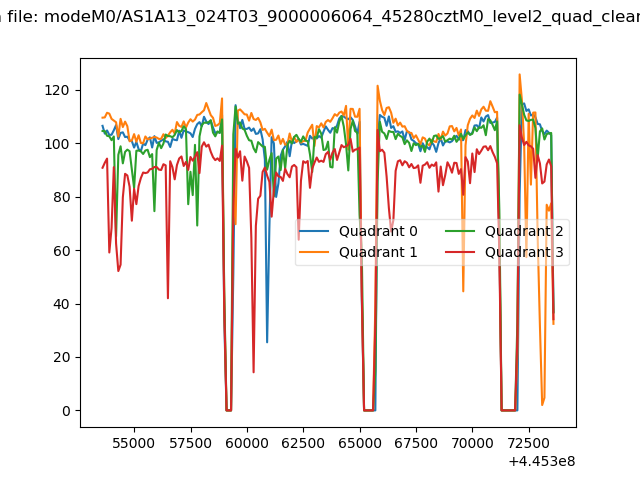 |
|
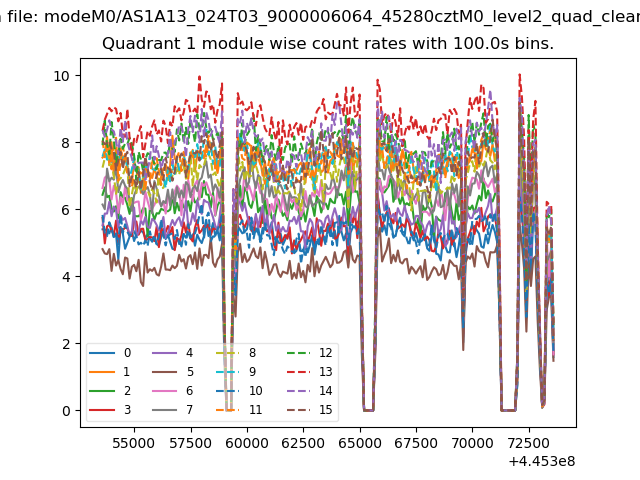
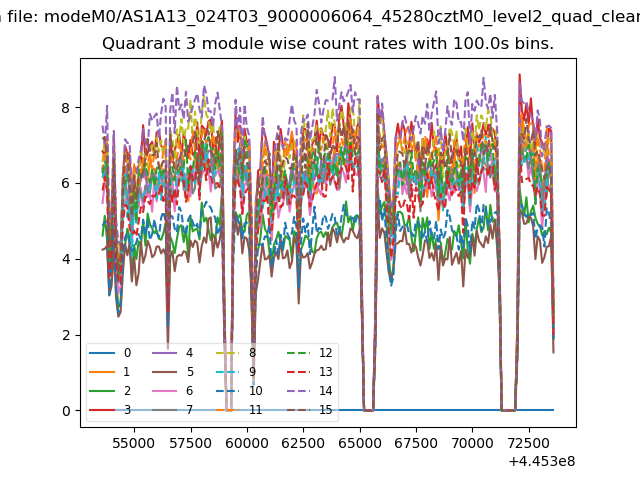
| Module-wise count rates for Quadrant A Data is divided into 100 sec bins |
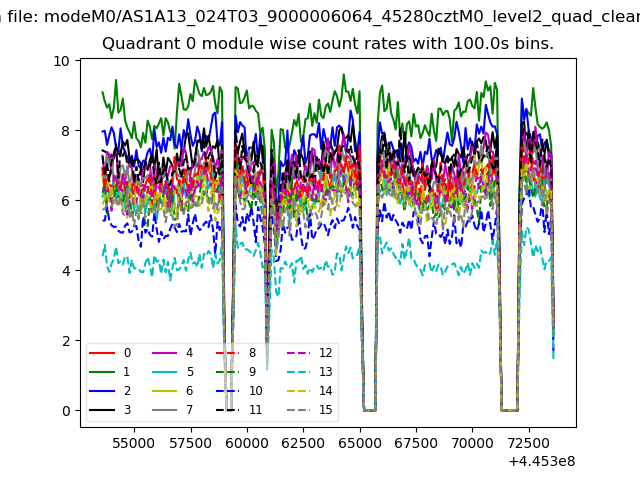 |
 |
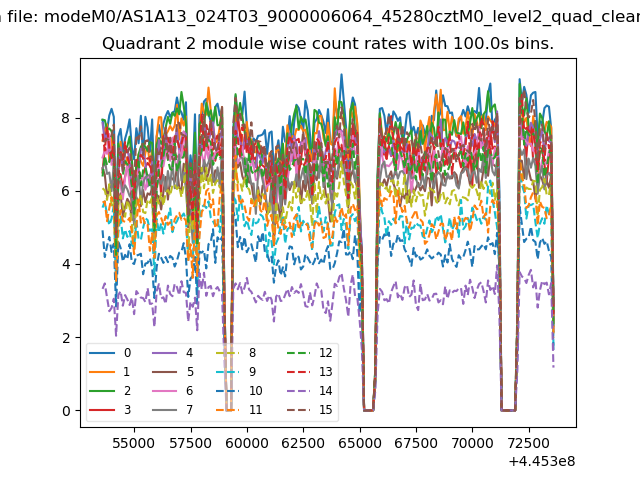
| Module-wise count rates for Quadrant B Data is divided into 100 sec bins |
 |
 |
| Module-wise count rates for Quadrant C Data is divided into 100 sec bins |
 |
 |
| Module-wise count rates for Quadrant D Data is divided into 100 sec bins |
 |
 |
| Parameter | Plot |
|---|---|
| CZT HV Monitor | 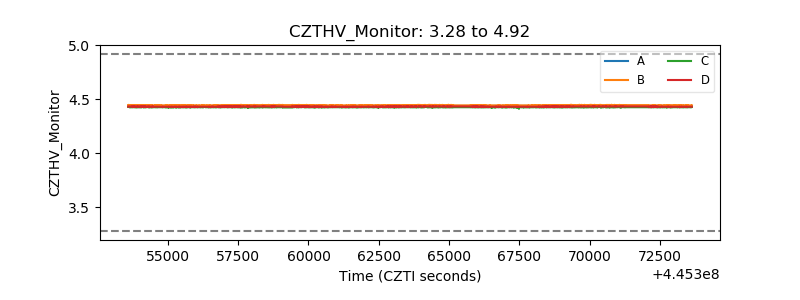 |
| D_VDD | 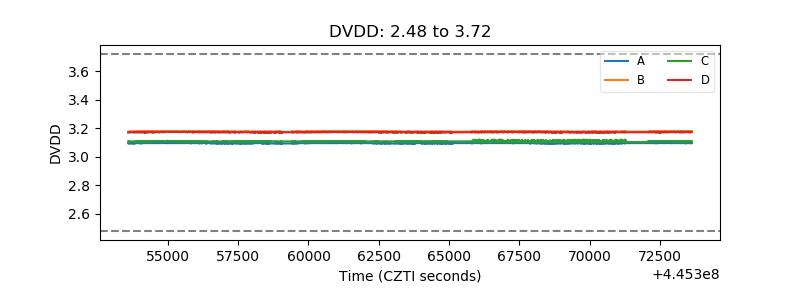 |
| Temperature 1 | 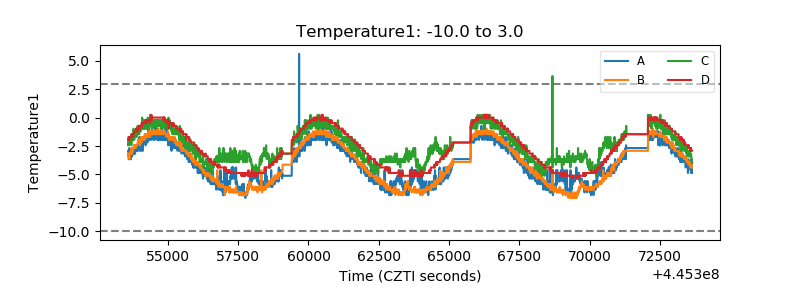 |
| Veto HV Monitor | 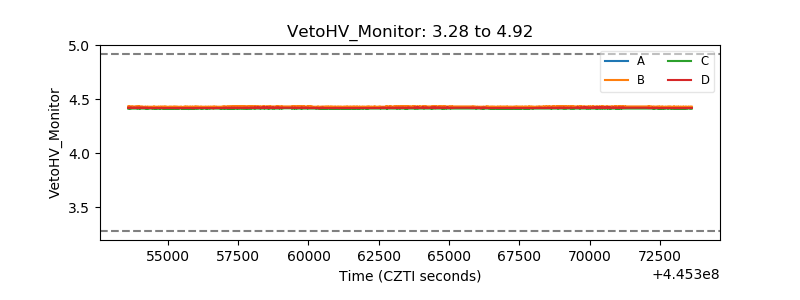 |
| Veto LLD | 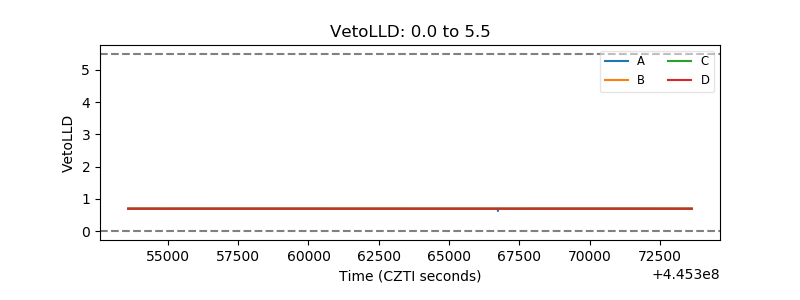 |
| Alpha Counter | 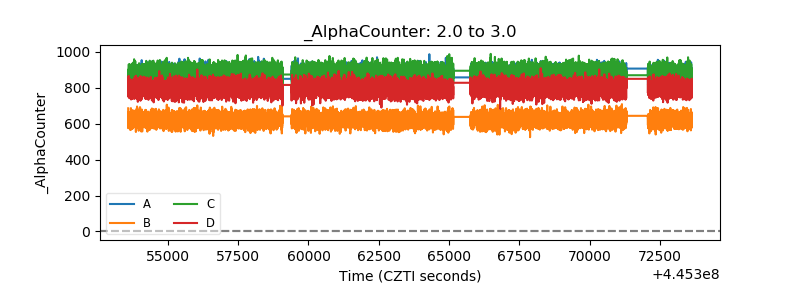 |
| _CPM_Rate | 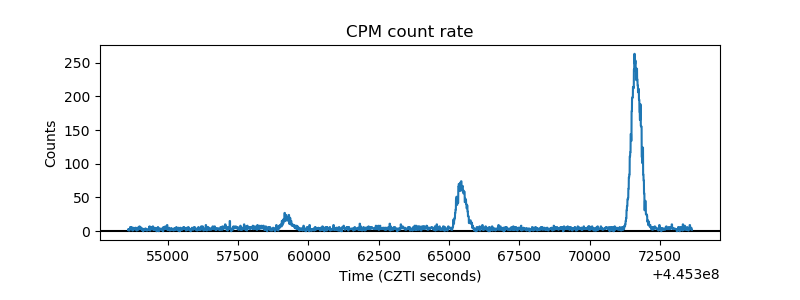 |
| CZT Counter |  |
| +2.5 Volts monitor | 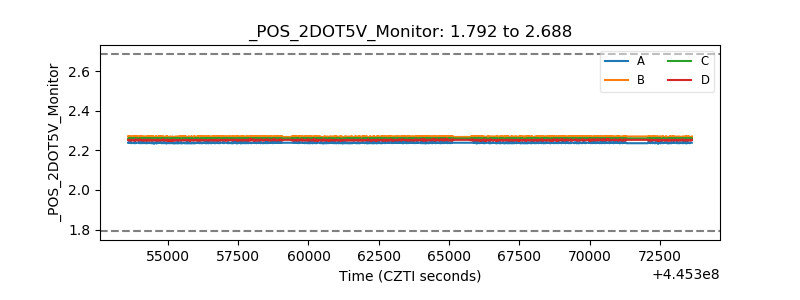 |
| +5 Volts monitor | 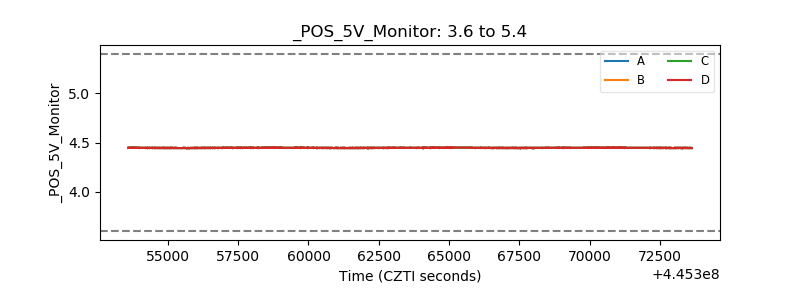 |
| _ROLL_ROT | 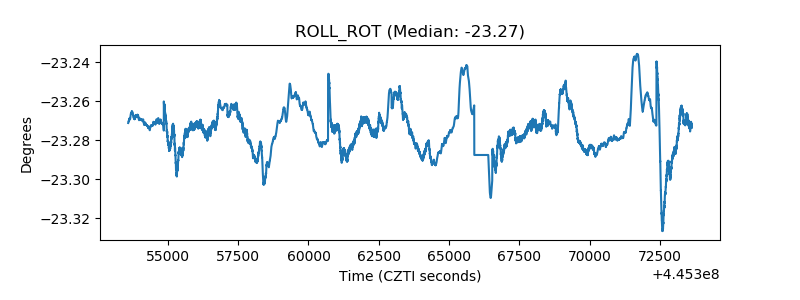 |
| _Roll_DEC | 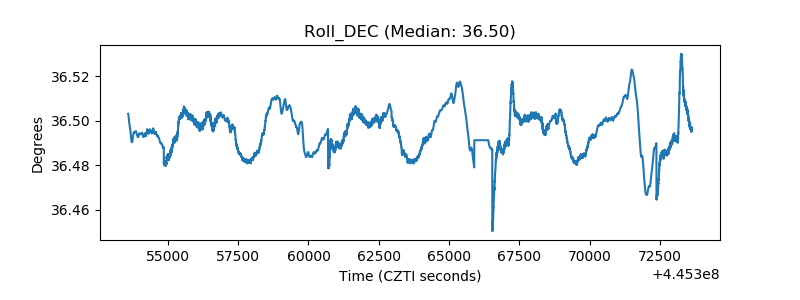 |
| _Roll_RA | 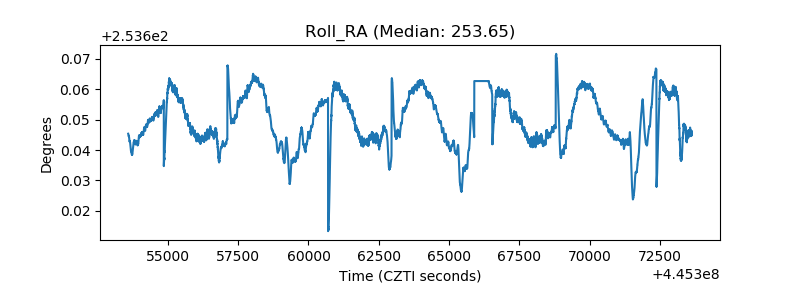 |
| Veto Counter | 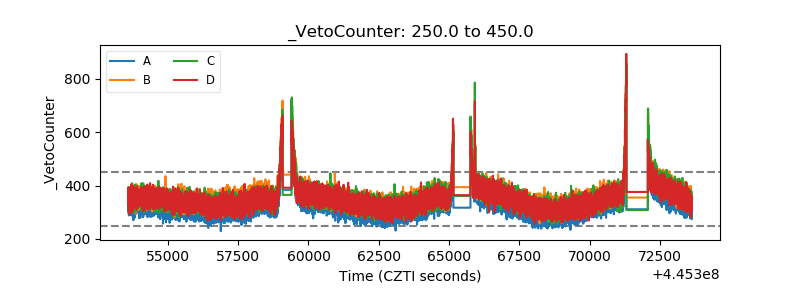 |