| Param | Original file | Final file |
|---|---|---|
| Filename | modeM0/AS1A13_024T03_9000006064_45281cztM0_level2.fits | modeM0/AS1A13_024T03_9000006064_45281cztM0_level2_quad_clean.evt |
| Size (bytes) | 563,336,640 | 106,030,080 |
| Size | 537.2 MB | 101.1 MB |
| Events in quadrant A | 6,089,346 | 714,179 |
| Events in quadrant B | 4,740,653 | 695,362 |
| Events in quadrant C | 3,385,687 | 717,322 |
| Events in quadrant D | 6,113,405 | 612,858 |
| Mode M0 | |||
|---|---|---|---|
| Quadrant | BADHDUFLAG | Total packets | Discarded packets |
| A | 0 | 23162 | 2 |
| B | 0 | 18696 | 2 |
| C | 0 | 14878 | 2 |
| D | 0 | 22982 | 2 |
| Mode SS | |||
|---|---|---|---|
| Quadrant | BADHDUFLAG | Total packets | Discarded packets |
| A | 0 | 136 | 0 |
| B | 0 | 136 | 0 |
| C | 0 | 136 | 0 |
| D | 0 | 136 | 0 |
| Mode M9 | |||
|---|---|---|---|
| Quadrant | BADHDUFLAG | Total packets | Discarded packets |
| A | 0 | 16 | 0 |
| B | 0 | 16 | 0 |
| C | 0 | 17 | 0 |
| D | 0 | 17 | 0 |
| Quadrant | Total seconds | Saturated seconds | Saturation percentage |
|---|---|---|---|
| A | 6753 | 332 | 4.916333% |
| B | 6753 | 679 | 10.054790% |
| C | 6753 | 138 | 2.043536% |
| D | 6753 | 674 | 9.980749% |
Noise dominated data is calculated using 1-second bins in cleaned event files. If a bin has >2000 counts, and if more than 50% of those come from <1% of pixels, then it is considered to be noise-dominated and hence unusable.
| Quadrant | # 1 sec bins | Bins with >0 counts | Bins with >2000 counts | High rate bins dominated by noise | Noise dominated (total time) | Noise dominated (detector-on time) | Marked lightcurve |
|---|---|---|---|---|---|---|---|
| A | 7708 | 6753 | 118 | 118 | 1.53% | 1.75% | 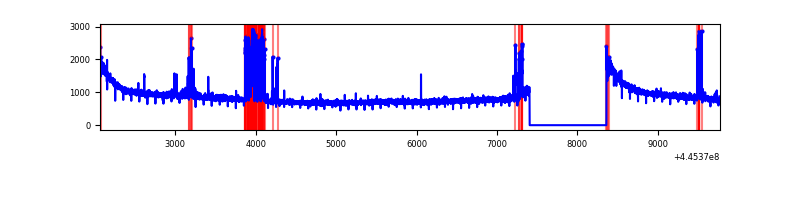 |
| B | 7708 | 6753 | 514 | 514 | 6.67% | 7.61% | 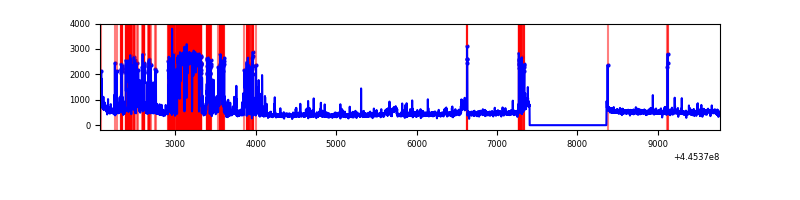 |
| C | 7708 | 6753 | 82 | 82 | 1.06% | 1.21% | 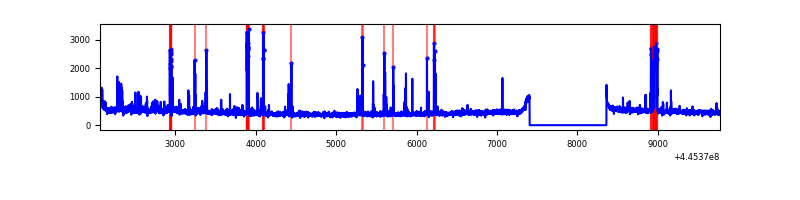 |
| D | 7708 | 6753 | 513 | 513 | 6.66% | 7.60% | 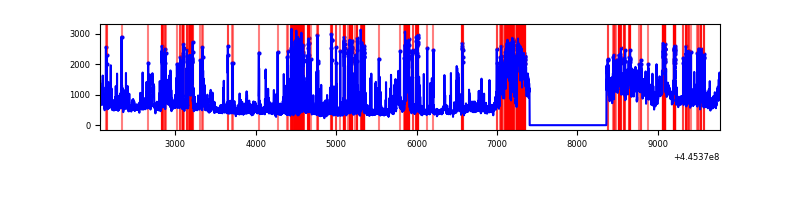 |
Top three noisy pixels from each quadrant. If the there are fewer than three noisy pixels in the level2.evt file, extra rows are filled as -1
| Pixel properties | Quadrant properties | ||||||
|---|---|---|---|---|---|---|---|
| Quadrant | DetID | PixID | Counts | Sigma | Mean | Median | Sigma |
| A | 10 | 83 | 2763100 | 17250.3 | 762 | 745 | 160.1 |
| A | 13 | 248 | 364681 | 2272.7 | 762 | 745 | 160.1 |
| A | 0 | 243 | 11568 | 67.59 | 762 | 745 | 160.1 |
| B | 4 | 171 | 1590912 | 10977.58 | 728 | 707 | 144.9 |
| B | 5 | 32 | 153981 | 1058.09 | 728 | 707 | 144.9 |
| B | 0 | 183 | 39990 | 271.18 | 728 | 707 | 144.9 |
| C | 14 | 254 | 255775 | 1424.0 | 757 | 762 | 179.1 |
| C | 3 | 233 | 72871 | 402.66 | 757 | 762 | 179.1 |
| C | 12 | 2 | 70200 | 387.74 | 757 | 762 | 179.1 |
| D | 12 | 33 | 974392 | 5264.74 | 736 | 715 | 184.9 |
| D | 5 | 222 | 812432 | 4389.01 | 736 | 715 | 184.9 |
| D | 2 | 249 | 675244 | 3647.23 | 736 | 715 | 184.9 |
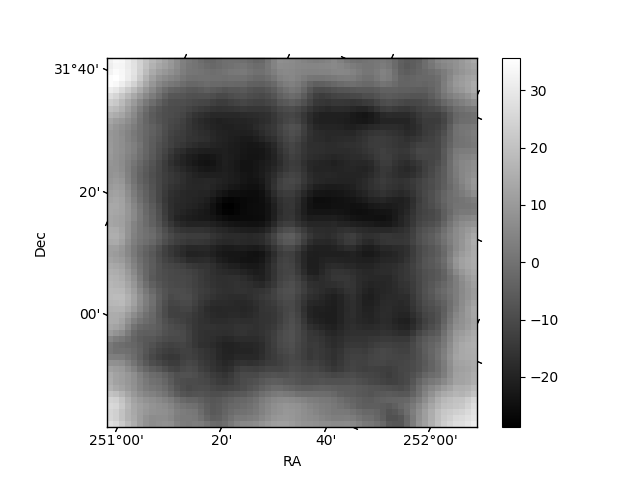
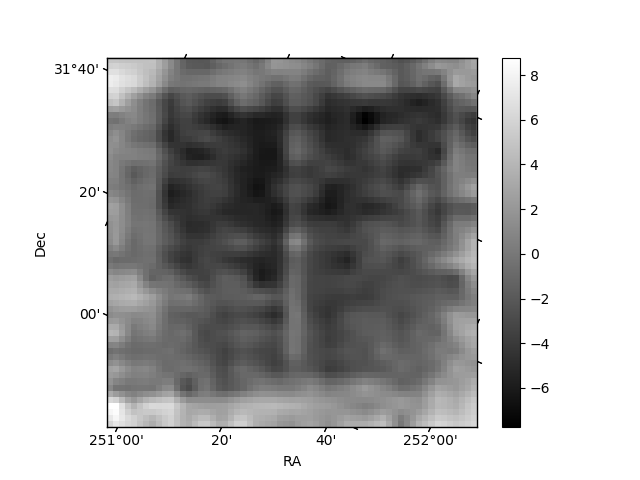
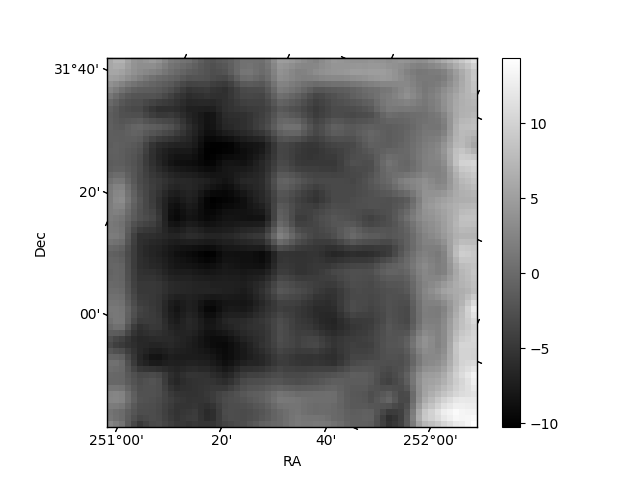
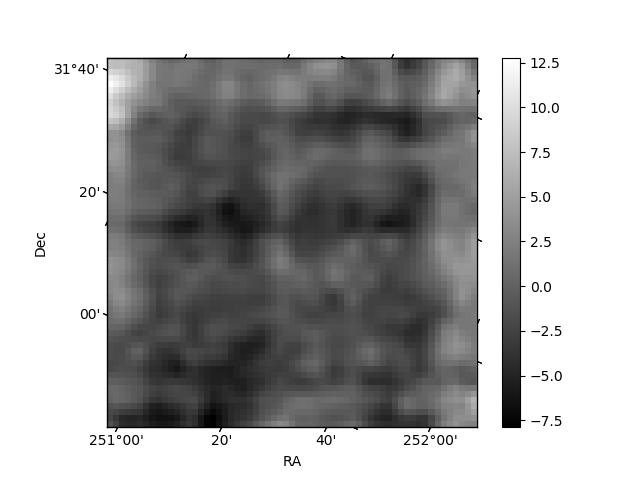
Histogram calculated using DETX and DETY for each event in the final _common_clean file
| Quadrant A | 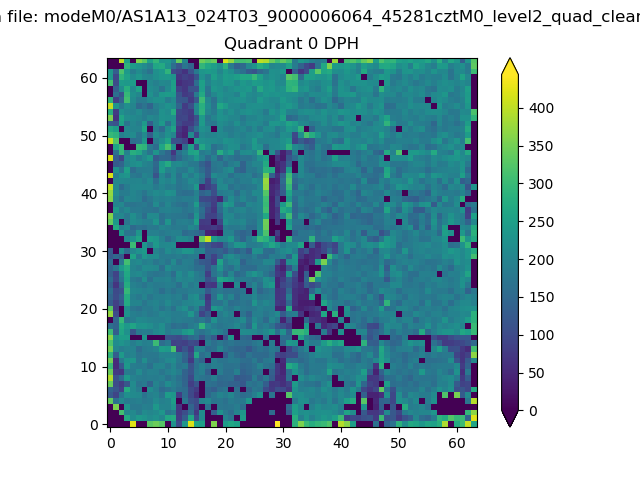 |
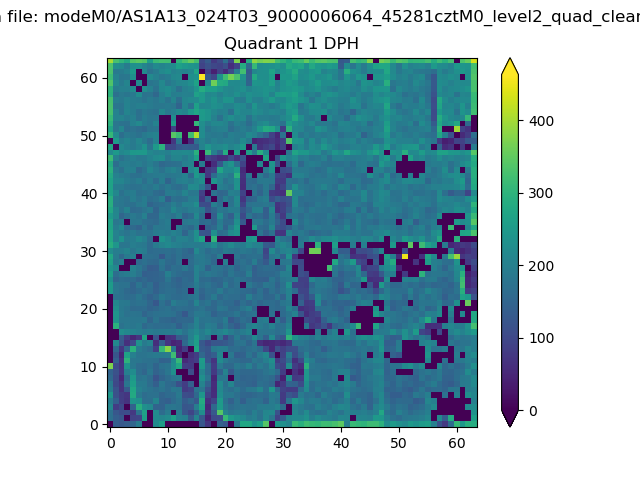 |
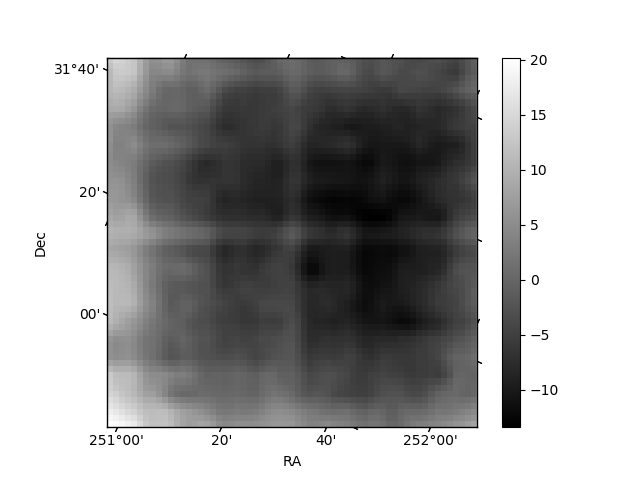
Quadrant B |
|---|---|---|---|
| Quadrant D | 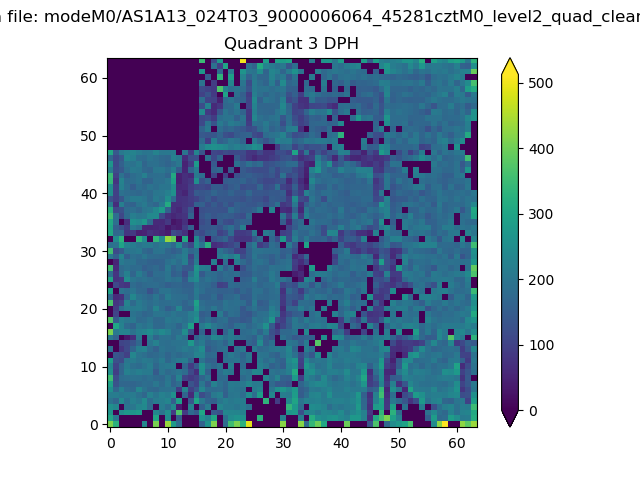 |
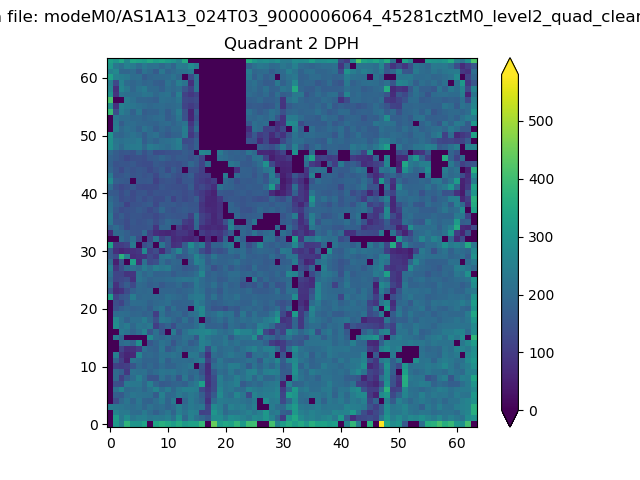 |
Quadrant C |
| Plot type | Count rate plots | Images |
|---|---|---|
| Comparison with Poisson distribution Blue bars denote a histogram of data divided into 1 sec bins. Red curve is a Poisson curve with rate = median count rate of data. |
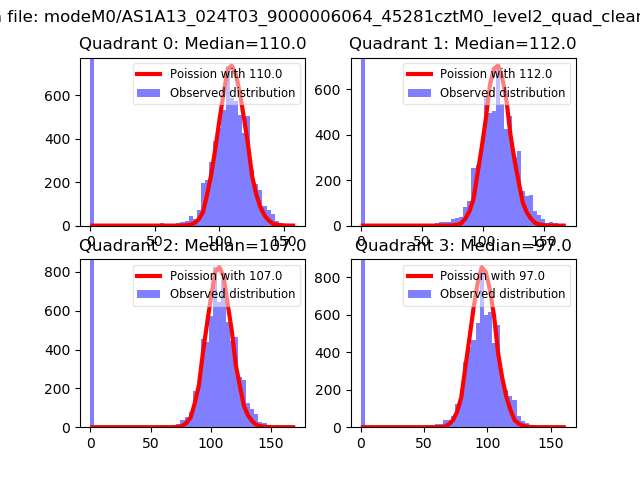 |
 |
| Quadrant-wise count rates Data is divided into 100 sec bins |
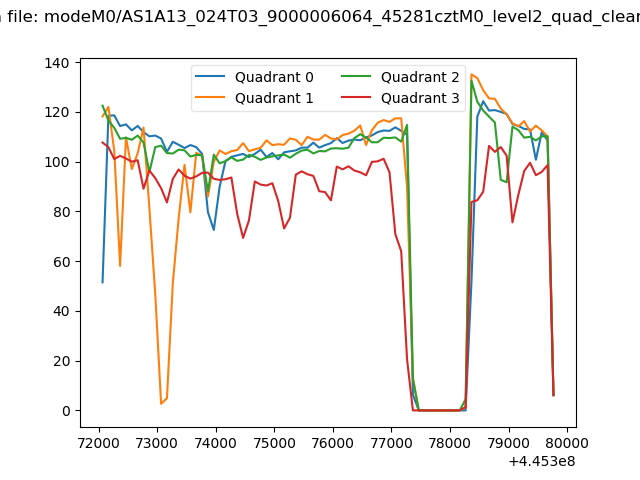 |
|
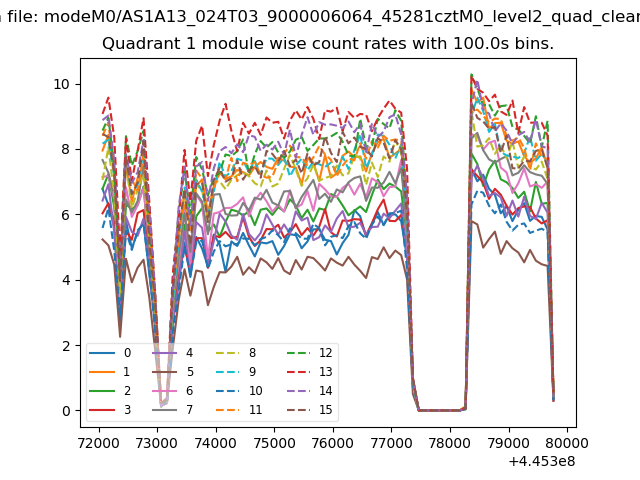
| Module-wise count rates for Quadrant A Data is divided into 100 sec bins |
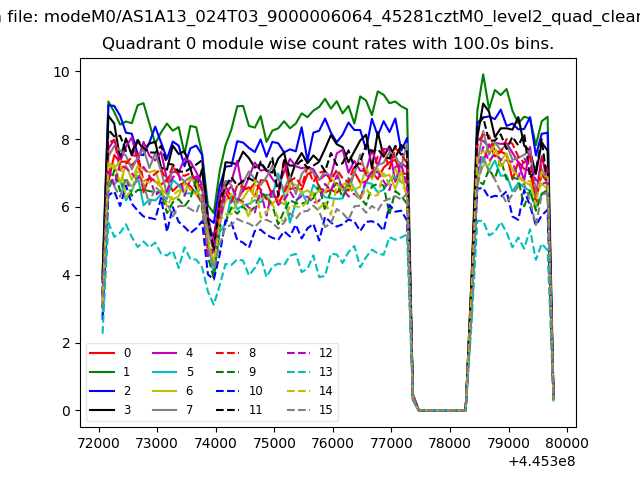 |
 |
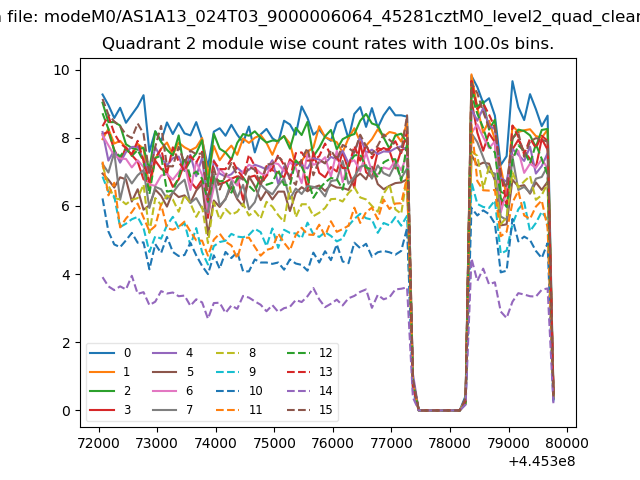
| Module-wise count rates for Quadrant B Data is divided into 100 sec bins |
 |
 |
| Module-wise count rates for Quadrant C Data is divided into 100 sec bins |
 |
 |
| Module-wise count rates for Quadrant D Data is divided into 100 sec bins |
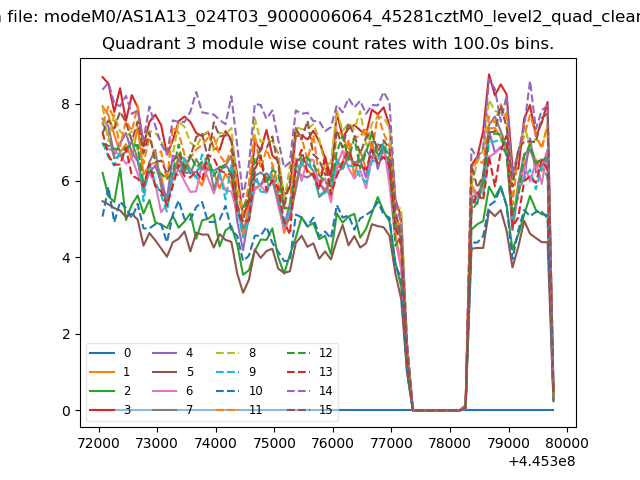 |
 |
| Parameter | Plot |
|---|---|
| CZT HV Monitor | 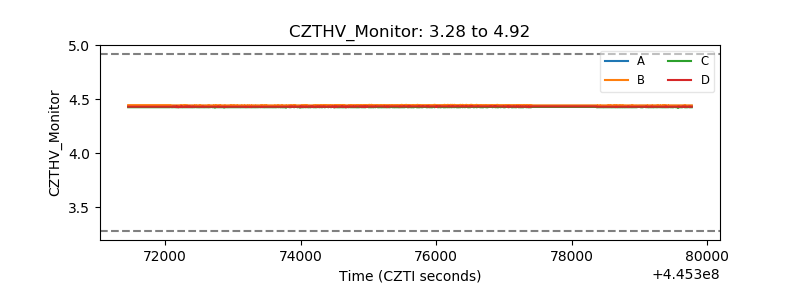 |
| D_VDD | 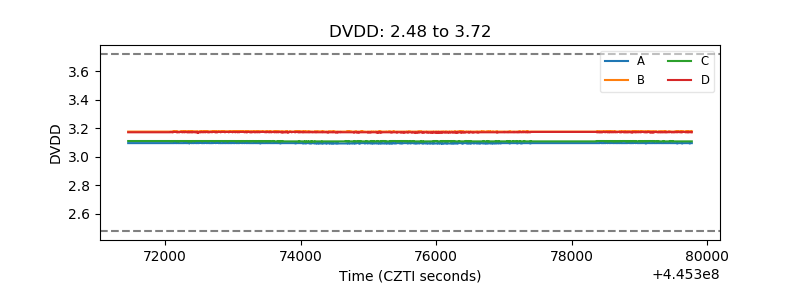 |
| Temperature 1 | 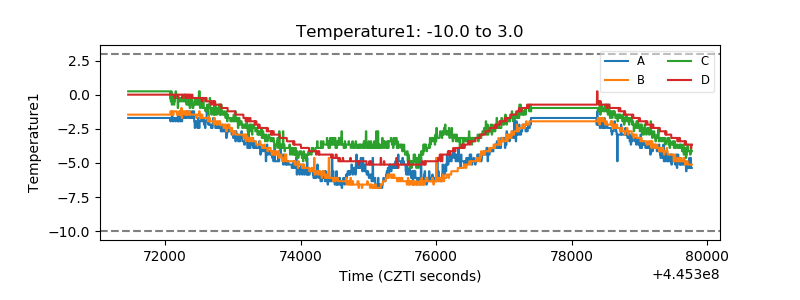 |
| Veto HV Monitor | 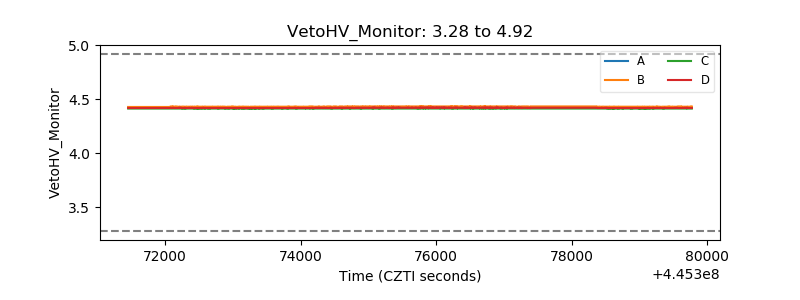 |
| Veto LLD | 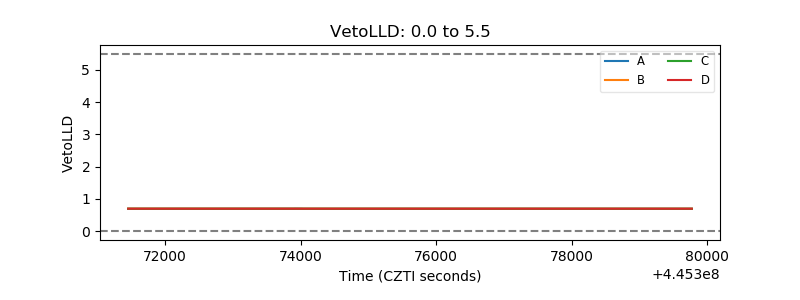 |
| Alpha Counter | 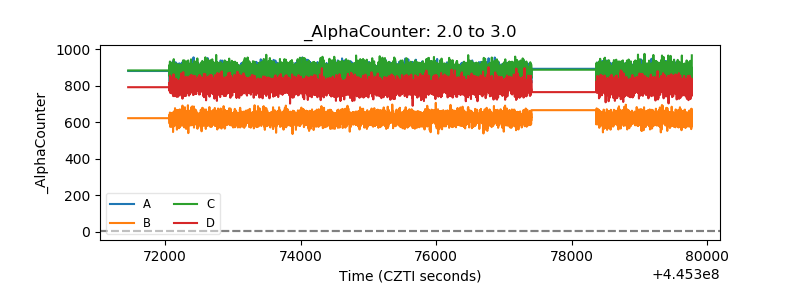 |
| _CPM_Rate | 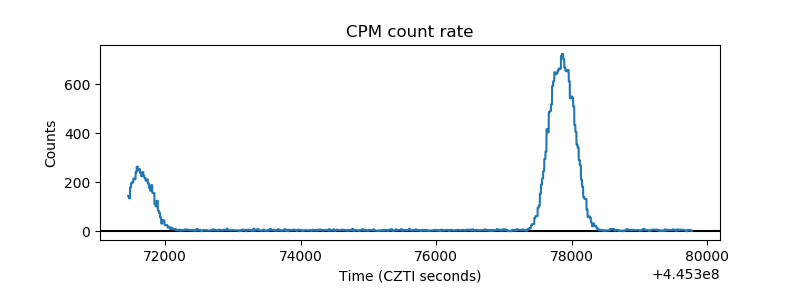 |
| CZT Counter | 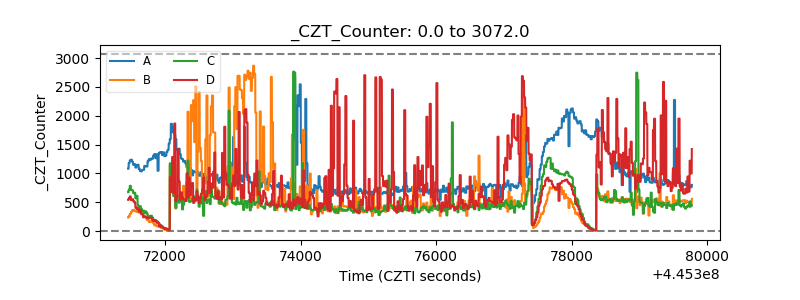 |
| +2.5 Volts monitor | 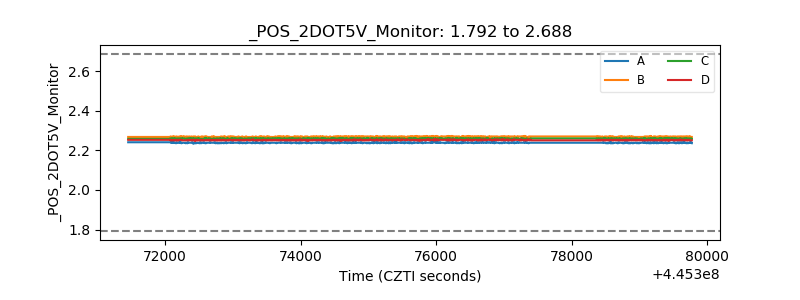 |
| +5 Volts monitor | 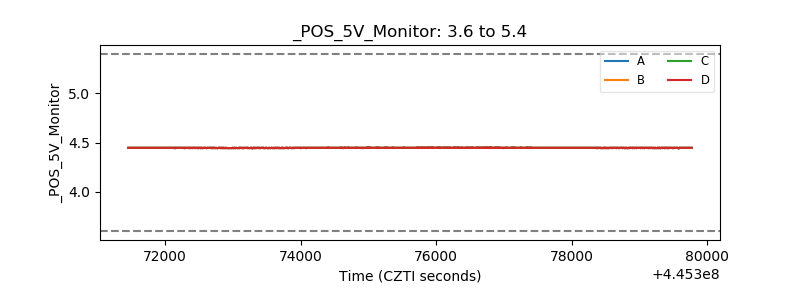 |
| _ROLL_ROT | 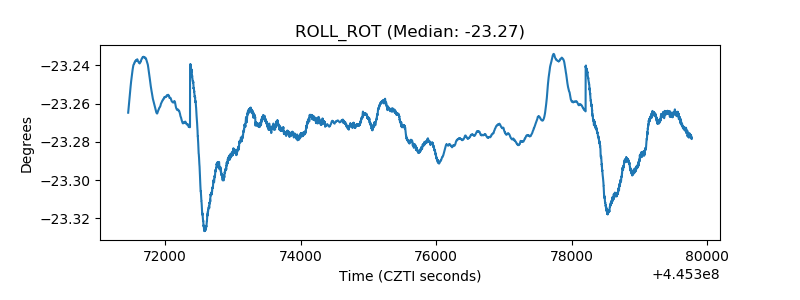 |
| _Roll_DEC | 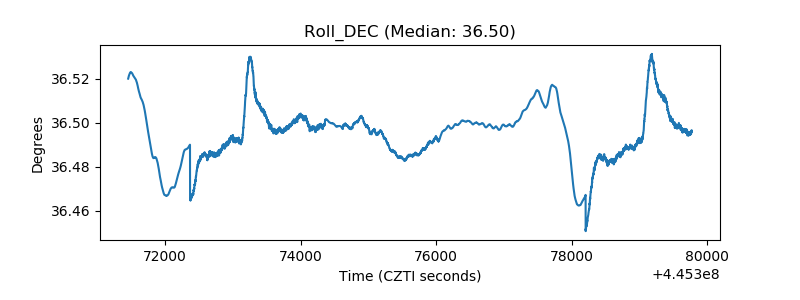 |
| _Roll_RA | 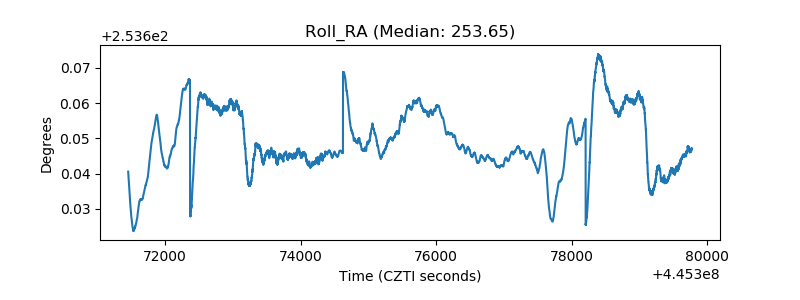 |
| Veto Counter | 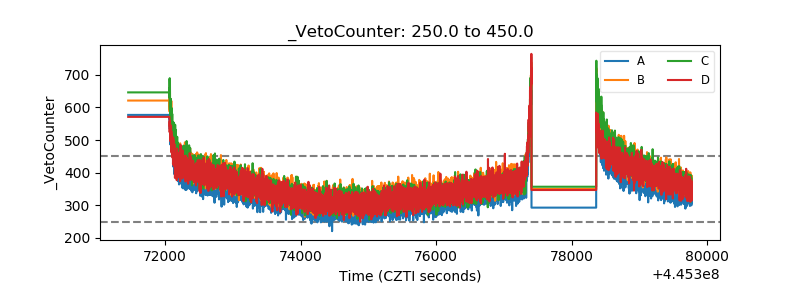 |