| Param | Original file | Final file |
|---|---|---|
| Filename | modeM0/AS1A13_024T03_9000006064_45283cztM0_level2.fits | modeM0/AS1A13_024T03_9000006064_45283cztM0_level2_quad_clean.evt |
| Size (bytes) | 485,357,760 | 107,553,600 |
| Size | 462.9 MB | 102.6 MB |
| Events in quadrant A | 5,652,769 | 712,828 |
| Events in quadrant B | 3,333,495 | 752,170 |
| Events in quadrant C | 3,194,236 | 718,205 |
| Events in quadrant D | 5,280,786 | 619,520 |
| Mode M0 | |||
|---|---|---|---|
| Quadrant | BADHDUFLAG | Total packets | Discarded packets |
| A | 0 | 21723 | 2 |
| B | 0 | 14245 | 2 |
| C | 0 | 14105 | 2 |
| D | 0 | 20391 | 2 |
| Mode SS | |||
|---|---|---|---|
| Quadrant | BADHDUFLAG | Total packets | Discarded packets |
| A | 0 | 134 | 0 |
| B | 0 | 134 | 0 |
| C | 0 | 134 | 0 |
| D | 0 | 134 | 0 |
| Mode M9 | |||
|---|---|---|---|
| Quadrant | BADHDUFLAG | Total packets | Discarded packets |
| A | 0 | 21 | 0 |
| B | 0 | 21 | 0 |
| C | 0 | 21 | 0 |
| D | 0 | 21 | 0 |
| Quadrant | Total seconds | Saturated seconds | Saturation percentage |
|---|---|---|---|
| A | 6508 | 284 | 4.363860% |
| B | 6508 | 129 | 1.982176% |
| C | 6508 | 111 | 1.705593% |
| D | 6508 | 499 | 7.667486% |
Noise dominated data is calculated using 1-second bins in cleaned event files. If a bin has >2000 counts, and if more than 50% of those come from <1% of pixels, then it is considered to be noise-dominated and hence unusable.
| Quadrant | # 1 sec bins | Bins with >0 counts | Bins with >2000 counts | High rate bins dominated by noise | Noise dominated (total time) | Noise dominated (detector-on time) | Marked lightcurve |
|---|---|---|---|---|---|---|---|
| A | 8578 | 6508 | 39 | 39 | 0.45% | 0.60% | 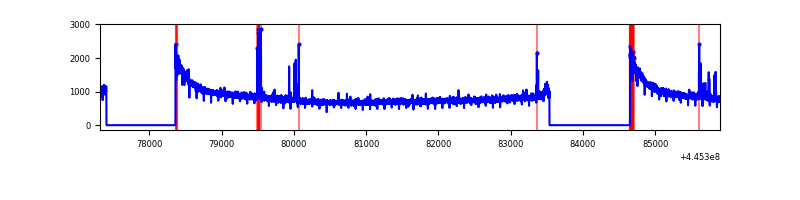 |
| B | 8578 | 6508 | 36 | 36 | 0.42% | 0.55% | 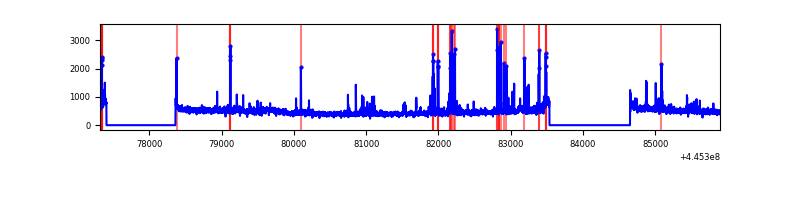 |
| C | 8578 | 6508 | 45 | 45 | 0.52% | 0.69% | 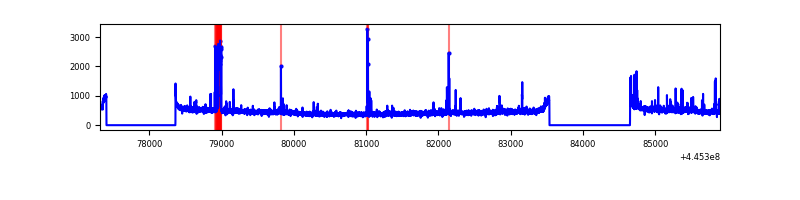 |
| D | 8578 | 6508 | 290 | 290 | 3.38% | 4.46% | 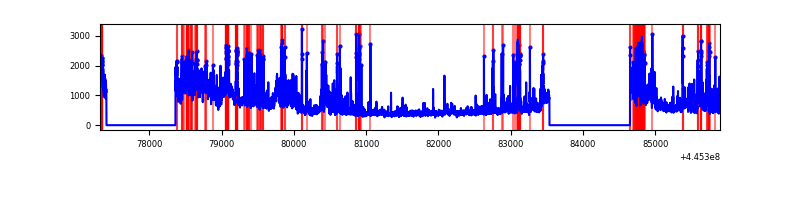 |
Top three noisy pixels from each quadrant. If the there are fewer than three noisy pixels in the level2.evt file, extra rows are filled as -1
| Pixel properties | Quadrant properties | ||||||
|---|---|---|---|---|---|---|---|
| Quadrant | DetID | PixID | Counts | Sigma | Mean | Median | Sigma |
| A | 10 | 83 | 2666546 | 17020.36 | 746 | 729 | 156.6 |
| A | 13 | 248 | 66212 | 418.09 | 746 | 729 | 156.6 |
| A | 15 | 174 | 24745 | 153.33 | 746 | 729 | 156.6 |
| B | 5 | 32 | 177829 | 1183.6 | 755 | 731 | 149.6 |
| B | 0 | 189 | 51987 | 342.56 | 755 | 731 | 149.6 |
| B | 0 | 183 | 48019 | 316.04 | 755 | 731 | 149.6 |
| C | 14 | 254 | 219067 | 1255.57 | 742 | 745 | 173.9 |
| C | 3 | 233 | 40647 | 229.48 | 742 | 745 | 173.9 |
| C | 12 | 2 | 28332 | 158.65 | 742 | 745 | 173.9 |
| D | 12 | 33 | 1106655 | 6136.82 | 722 | 702 | 180.2 |
| D | 2 | 249 | 366277 | 2028.54 | 722 | 702 | 180.2 |
| D | 5 | 222 | 299219 | 1656.44 | 722 | 702 | 180.2 |
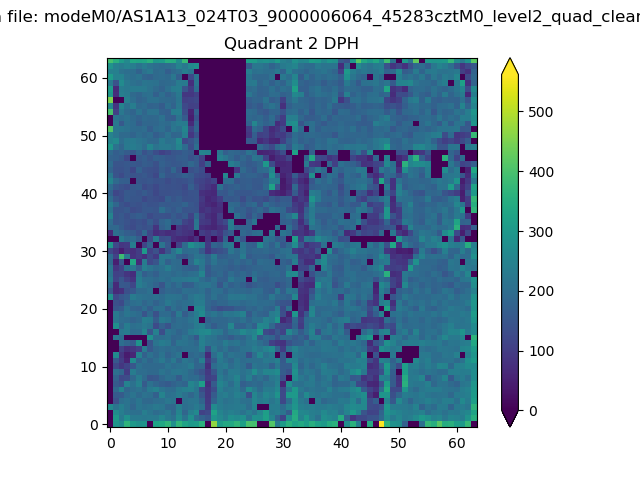
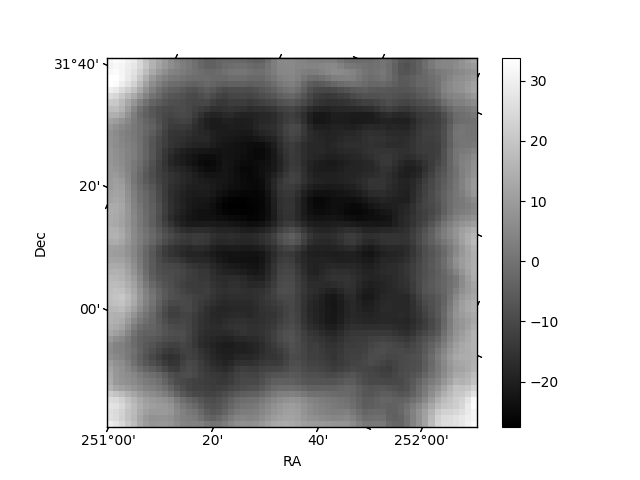
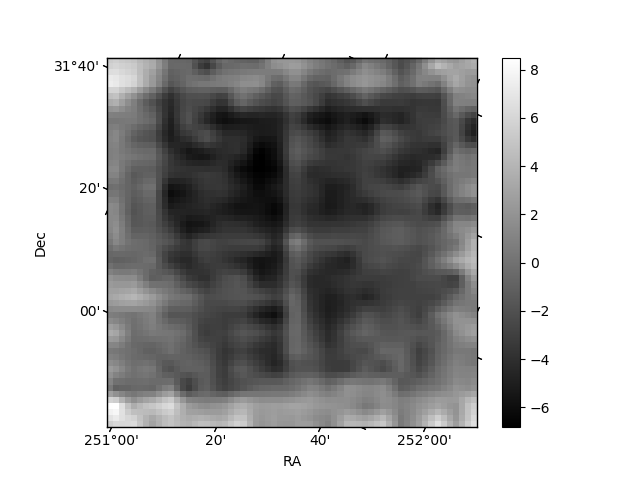
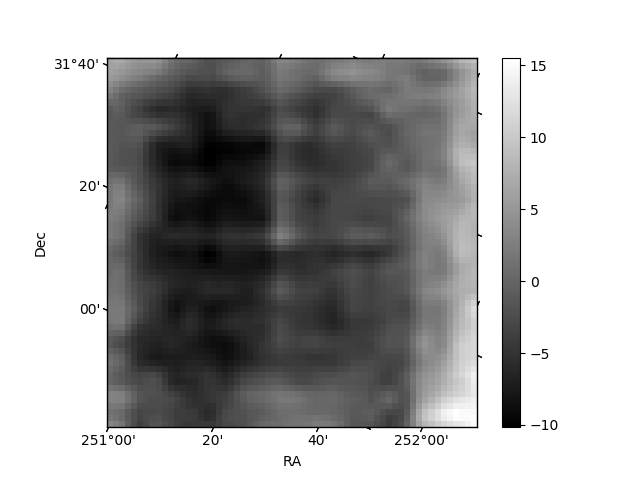
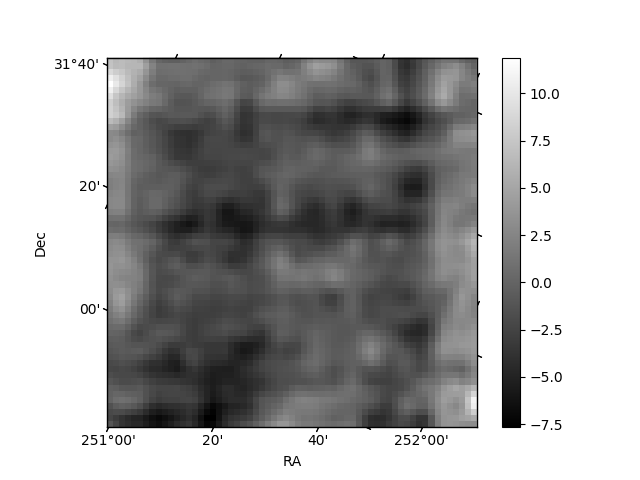
Histogram calculated using DETX and DETY for each event in the final _common_clean file
| Quadrant A | 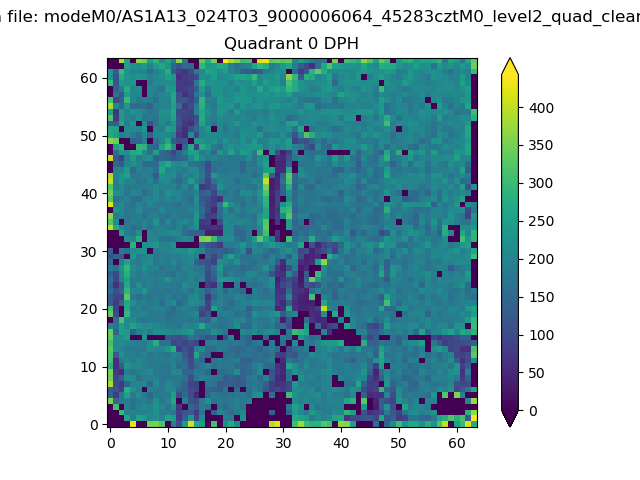 |
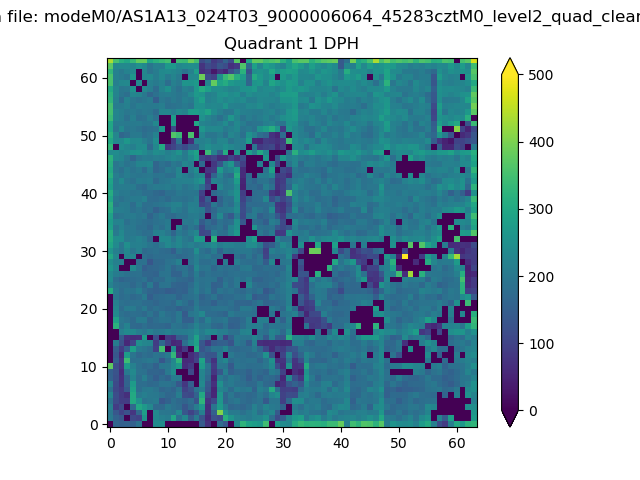 |
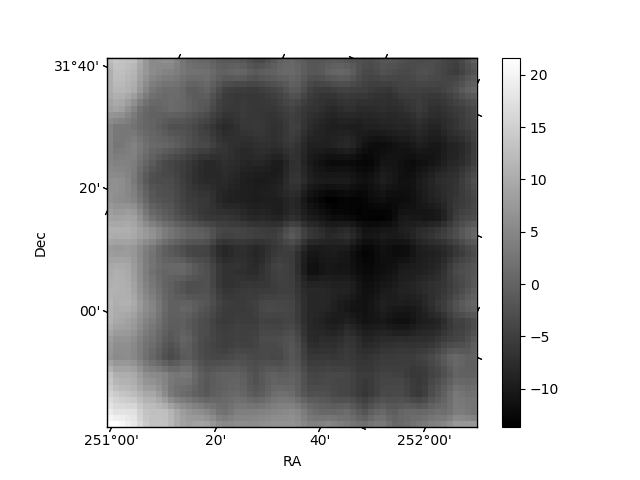
Quadrant B |
|---|---|---|---|
| Quadrant D | 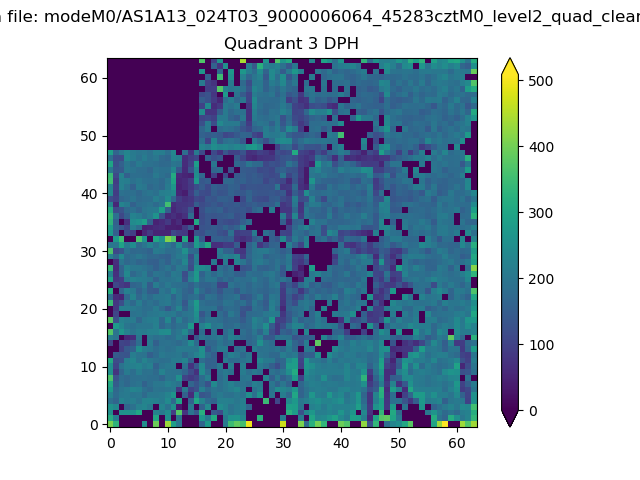 |
 |
Quadrant C |
| Plot type | Count rate plots | Images |
|---|---|---|
| Comparison with Poisson distribution Blue bars denote a histogram of data divided into 1 sec bins. Red curve is a Poisson curve with rate = median count rate of data. |
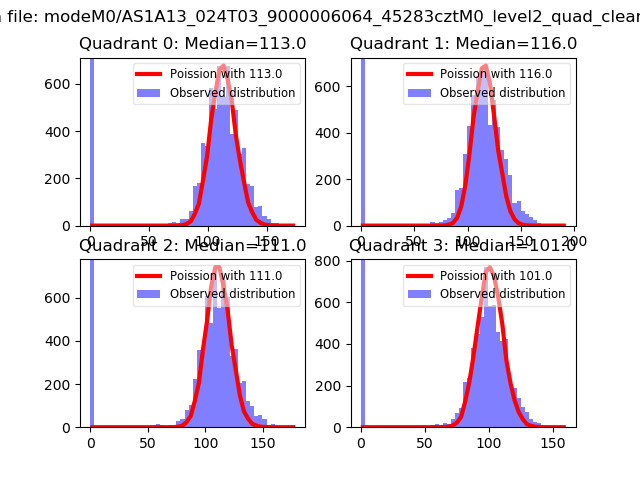 |
 |
| Quadrant-wise count rates Data is divided into 100 sec bins |
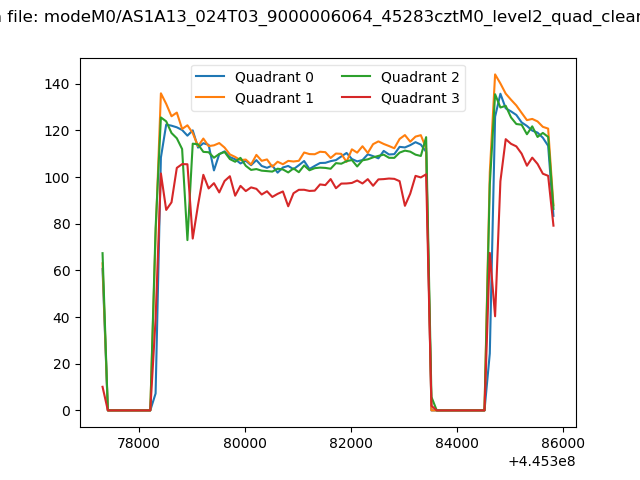 |
|
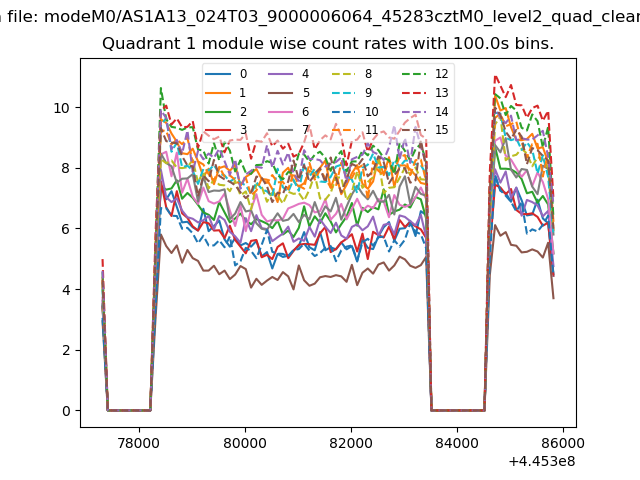
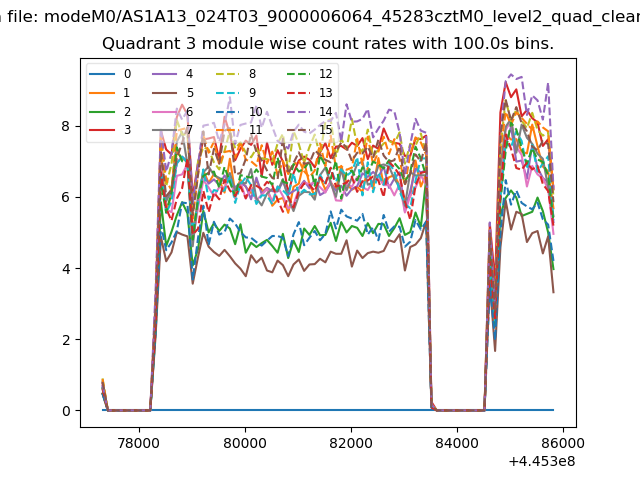
| Module-wise count rates for Quadrant A Data is divided into 100 sec bins |
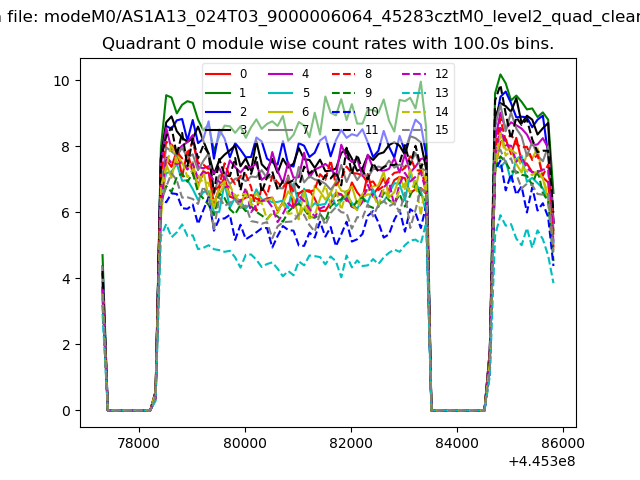 |
 |
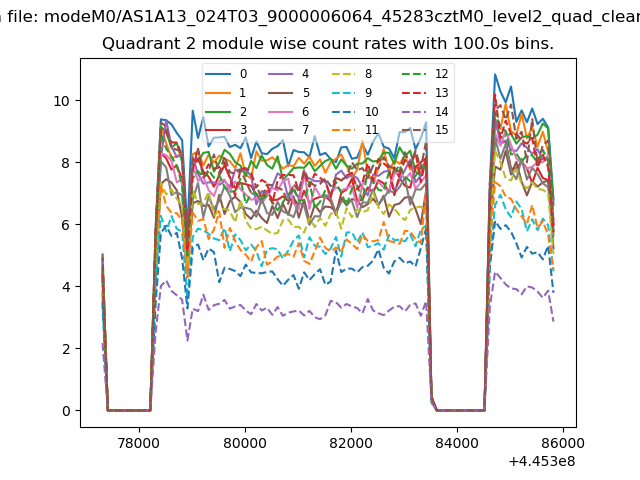
| Module-wise count rates for Quadrant B Data is divided into 100 sec bins |
 |
 |
| Module-wise count rates for Quadrant C Data is divided into 100 sec bins |
 |
 |
| Module-wise count rates for Quadrant D Data is divided into 100 sec bins |
 |
 |
| Parameter | Plot |
|---|---|
| CZT HV Monitor | 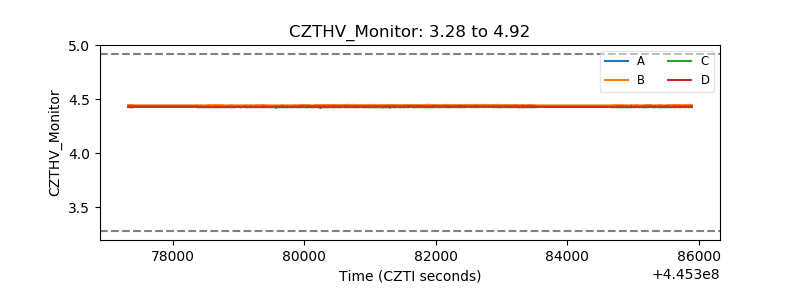 |
| D_VDD | 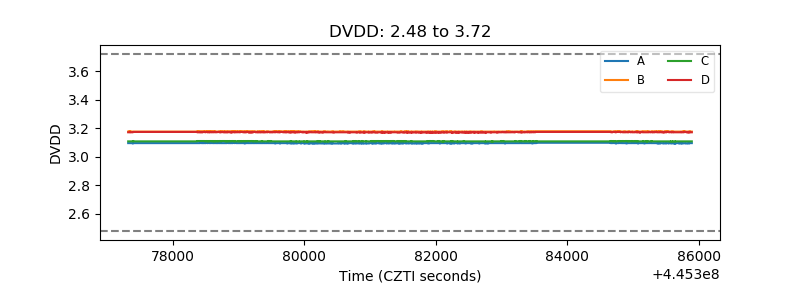 |
| Temperature 1 | 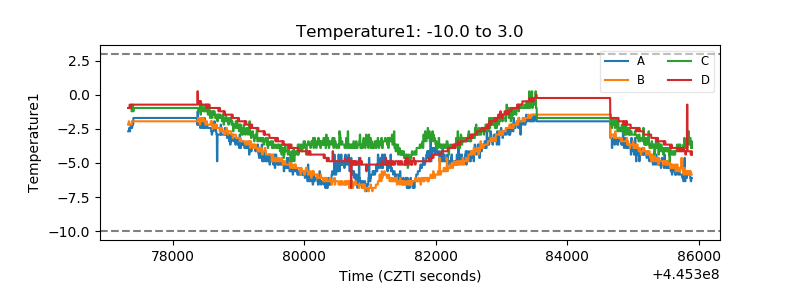 |
| Veto HV Monitor | 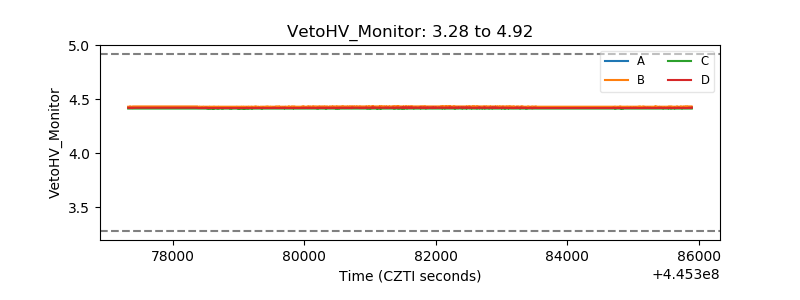 |
| Veto LLD | 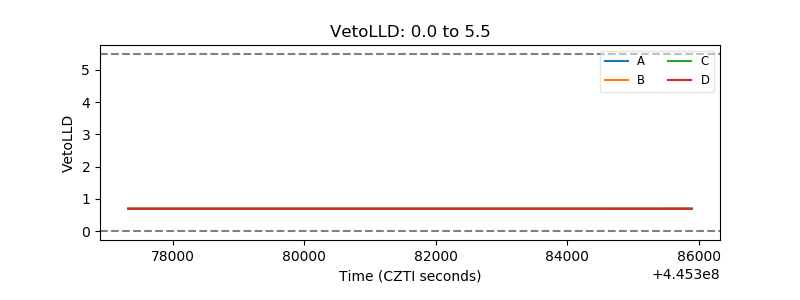 |
| Alpha Counter | 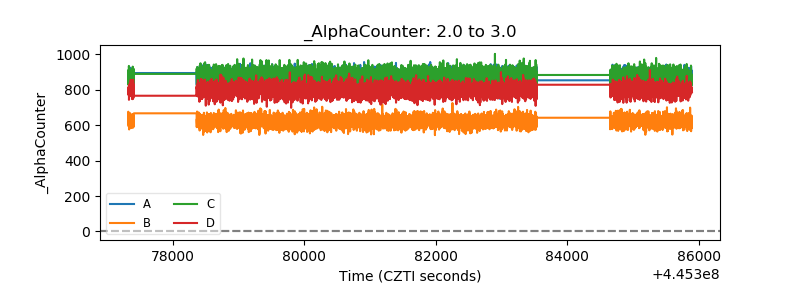 |
| _CPM_Rate | 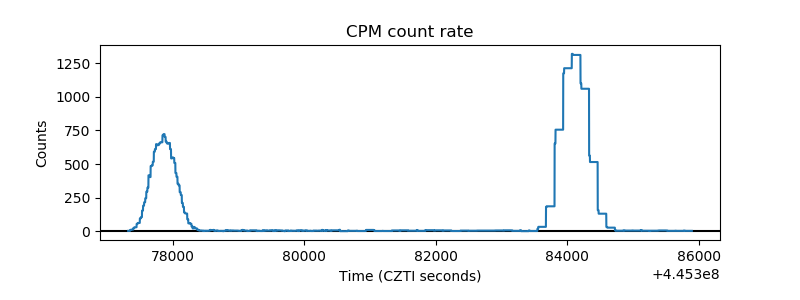 |
| CZT Counter | 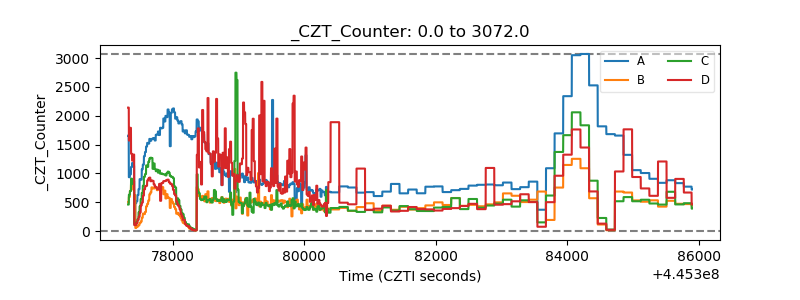 |
| +2.5 Volts monitor | 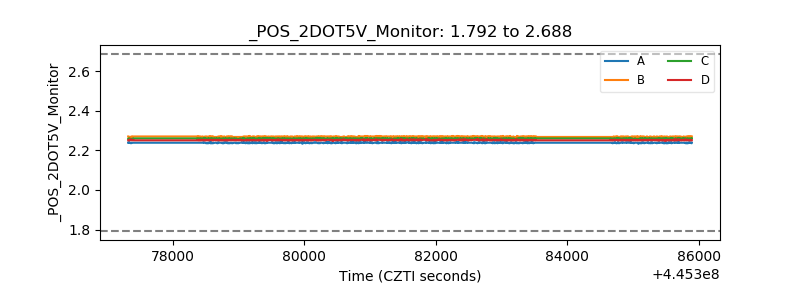 |
| +5 Volts monitor | 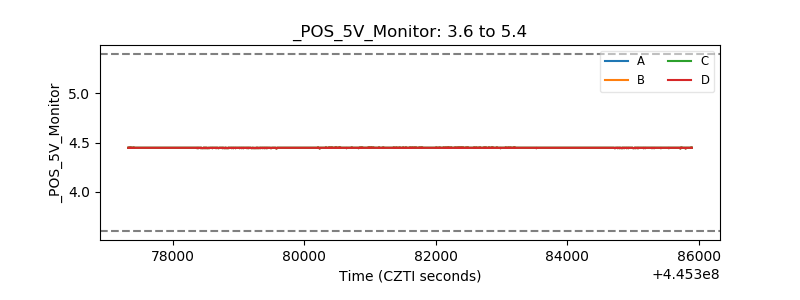 |
| _ROLL_ROT | 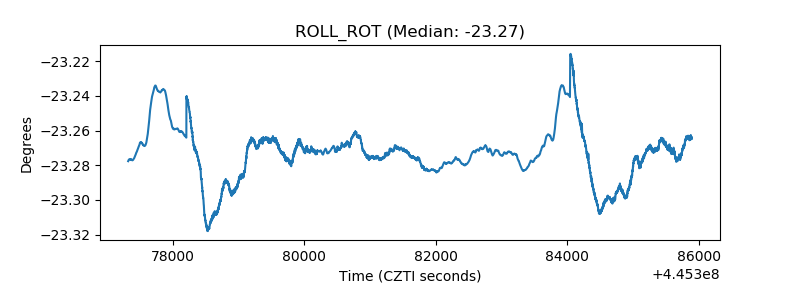 |
| _Roll_DEC | 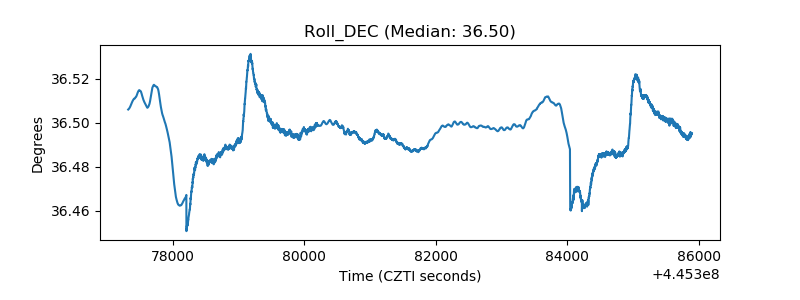 |
| _Roll_RA | 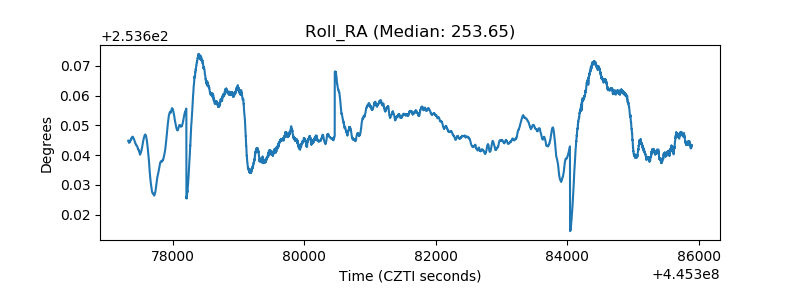 |
| Veto Counter | 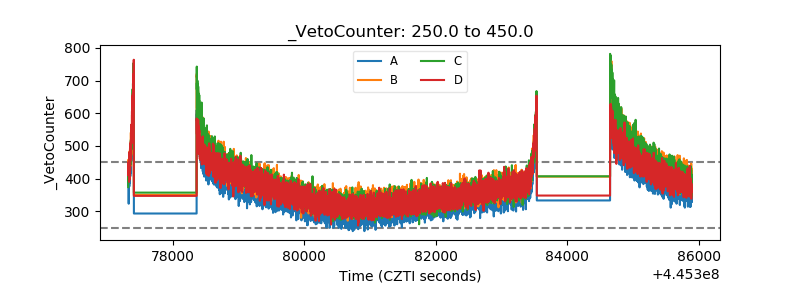 |