| Param | Original file | Final file |
|---|---|---|
| Filename | modeM0/AS1A13_024T03_9000006064_45284cztM0_level2.fits | modeM0/AS1A13_024T03_9000006064_45284cztM0_level2_quad_clean.evt |
| Size (bytes) | 464,518,080 | 107,694,720 |
| Size | 443.0 MB | 102.7 MB |
| Events in quadrant A | 5,417,840 | 713,585 |
| Events in quadrant B | 3,611,116 | 761,123 |
| Events in quadrant C | 3,048,037 | 727,270 |
| Events in quadrant D | 4,631,953 | 621,771 |
| Mode M0 | |||
|---|---|---|---|
| Quadrant | BADHDUFLAG | Total packets | Discarded packets |
| A | 0 | 21009 | 2 |
| B | 0 | 14875 | 2 |
| C | 0 | 13462 | 2 |
| D | 0 | 18314 | 2 |
| Mode SS | |||
|---|---|---|---|
| Quadrant | BADHDUFLAG | Total packets | Discarded packets |
| A | 0 | 128 | 0 |
| B | 0 | 128 | 0 |
| C | 0 | 128 | 0 |
| D | 0 | 128 | 0 |
| Mode M9 | |||
|---|---|---|---|
| Quadrant | BADHDUFLAG | Total packets | Discarded packets |
| A | 0 | 21 | 0 |
| B | 0 | 21 | 0 |
| C | 0 | 22 | 0 |
| D | 0 | 22 | 0 |
| Quadrant | Total seconds | Saturated seconds | Saturation percentage |
|---|---|---|---|
| A | 6260 | 256 | 4.089457% |
| B | 6260 | 162 | 2.587859% |
| C | 6260 | 54 | 0.862620% |
| D | 6260 | 367 | 5.862620% |
Noise dominated data is calculated using 1-second bins in cleaned event files. If a bin has >2000 counts, and if more than 50% of those come from <1% of pixels, then it is considered to be noise-dominated and hence unusable.
| Quadrant | # 1 sec bins | Bins with >0 counts | Bins with >2000 counts | High rate bins dominated by noise | Noise dominated (total time) | Noise dominated (detector-on time) | Marked lightcurve |
|---|---|---|---|---|---|---|---|
| A | 7445 | 6260 | 76 | 76 | 1.02% | 1.21% | 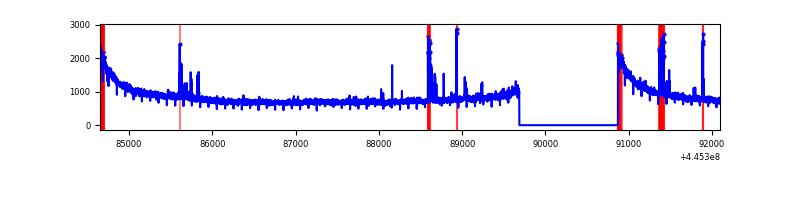 |
| B | 7445 | 6260 | 116 | 116 | 1.56% | 1.85% | 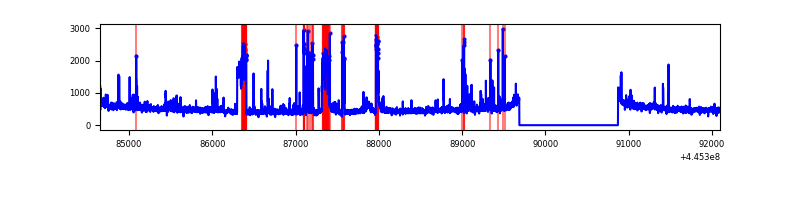 |
| C | 7445 | 6261 | 25 | 25 | 0.34% | 0.40% | 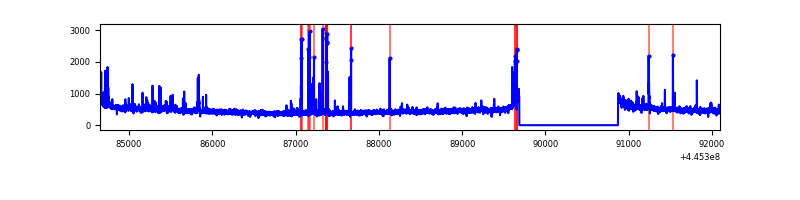 |
| D | 7445 | 6260 | 239 | 239 | 3.21% | 3.82% | 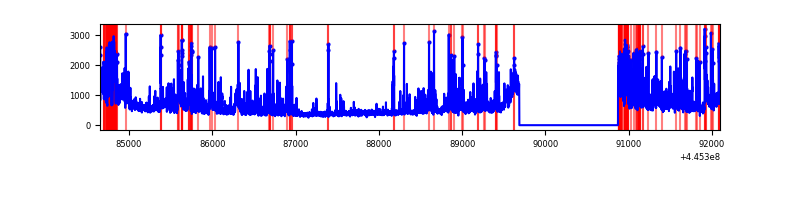 |
Top three noisy pixels from each quadrant. If the there are fewer than three noisy pixels in the level2.evt file, extra rows are filled as -1
| Pixel properties | Quadrant properties | ||||||
|---|---|---|---|---|---|---|---|
| Quadrant | DetID | PixID | Counts | Sigma | Mean | Median | Sigma |
| A | 10 | 83 | 2446163 | 16292.42 | 722 | 710 | 150.1 |
| A | 13 | 248 | 153765 | 1019.7 | 722 | 710 | 150.1 |
| A | 0 | 243 | 15608 | 99.26 | 722 | 710 | 150.1 |
| B | 5 | 32 | 290221 | 2019.18 | 733 | 710 | 143.4 |
| B | 0 | 189 | 203915 | 1417.24 | 733 | 710 | 143.4 |
| B | 5 | 172 | 96012 | 664.68 | 733 | 710 | 143.4 |
| C | 14 | 254 | 189205 | 1118.64 | 721 | 727 | 168.5 |
| C | 12 | 2 | 25481 | 146.92 | 721 | 727 | 168.5 |
| C | 3 | 233 | 17386 | 98.87 | 721 | 727 | 168.5 |
| D | 12 | 33 | 337432 | 1934.09 | 695 | 672 | 174.1 |
| D | 2 | 249 | 312444 | 1790.58 | 695 | 672 | 174.1 |
| D | 13 | 249 | 296488 | 1698.94 | 695 | 672 | 174.1 |
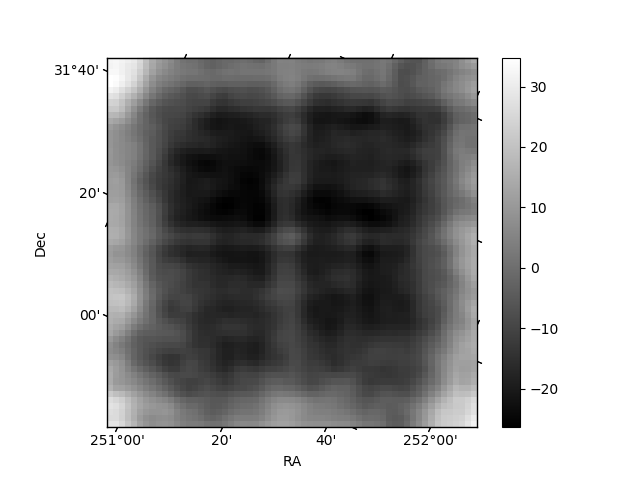
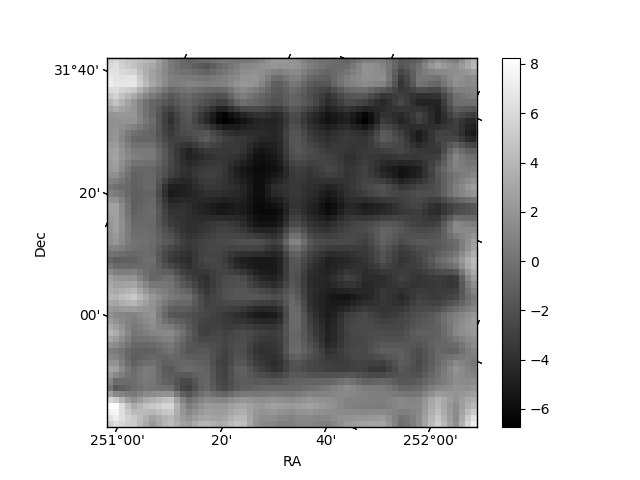
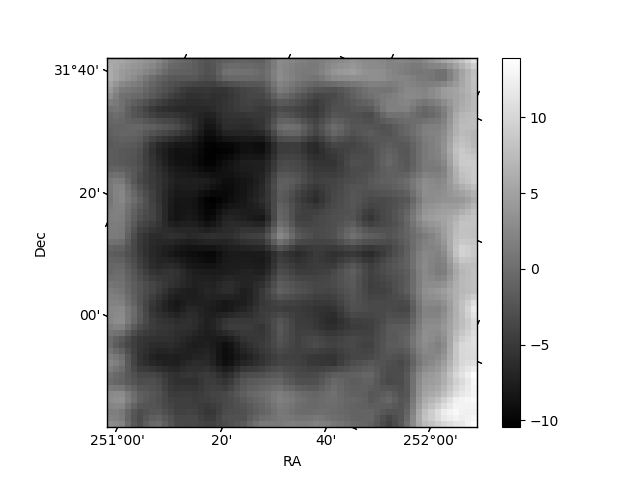
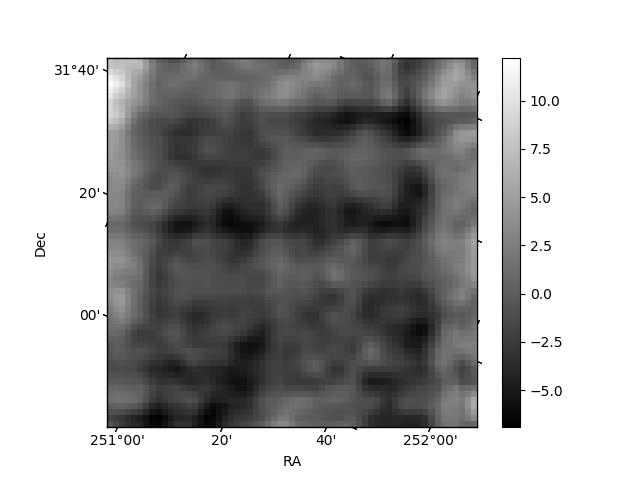
Histogram calculated using DETX and DETY for each event in the final _common_clean file
| Quadrant A | 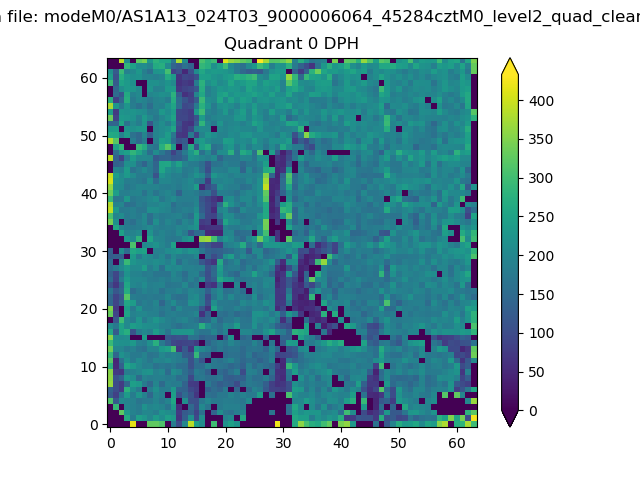 |
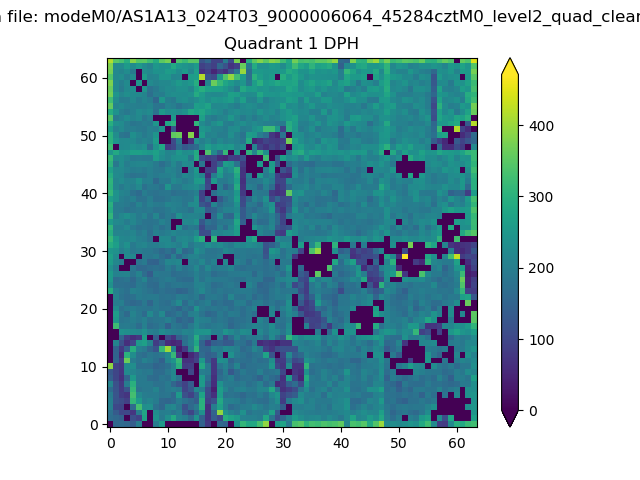 |
Quadrant B |
|---|---|---|---|
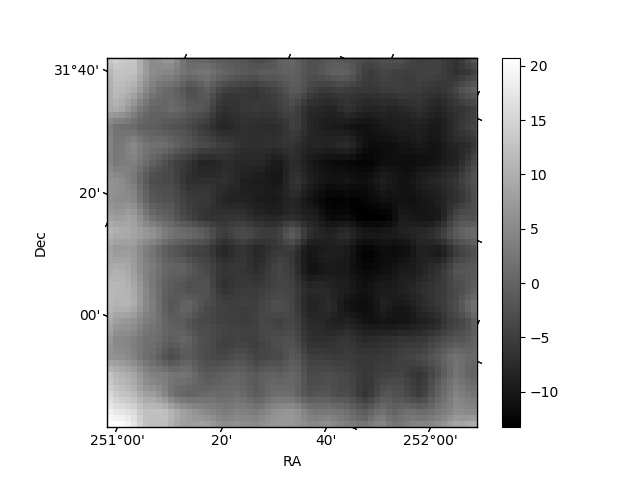
| Quadrant D | 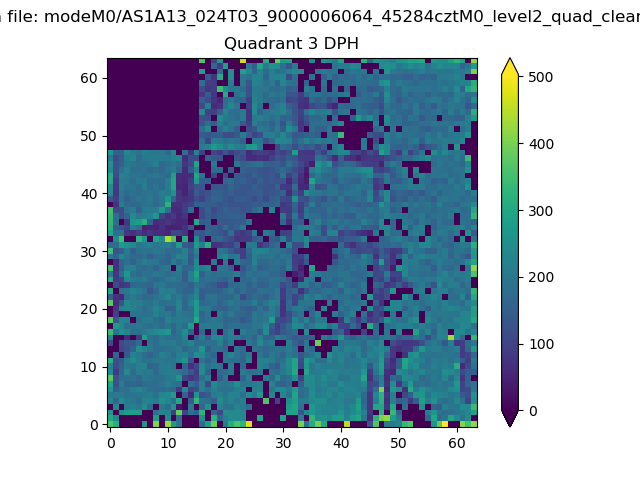 |
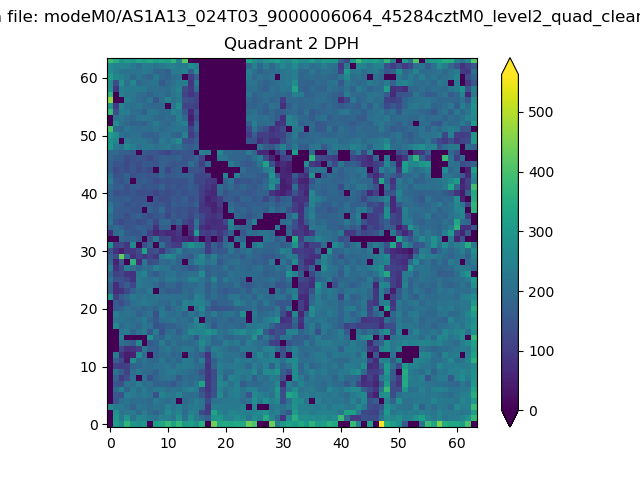 |
Quadrant C |
| Plot type | Count rate plots | Images |
|---|---|---|
| Comparison with Poisson distribution Blue bars denote a histogram of data divided into 1 sec bins. Red curve is a Poisson curve with rate = median count rate of data. |
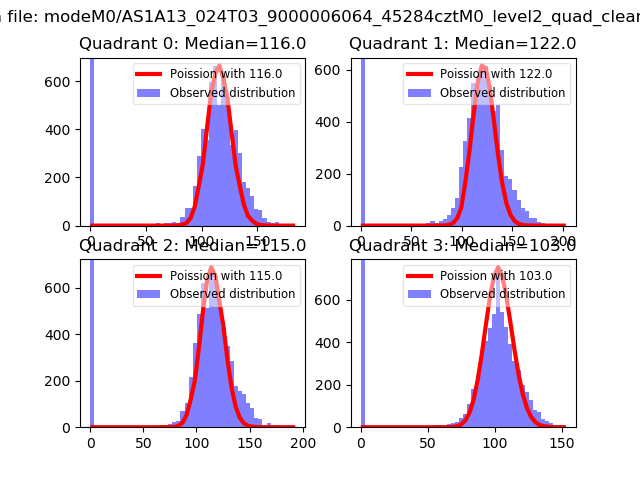 |
 |
| Quadrant-wise count rates Data is divided into 100 sec bins |
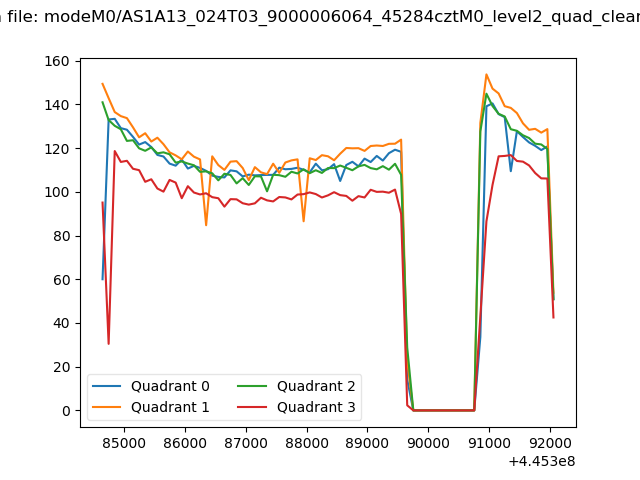 |
|
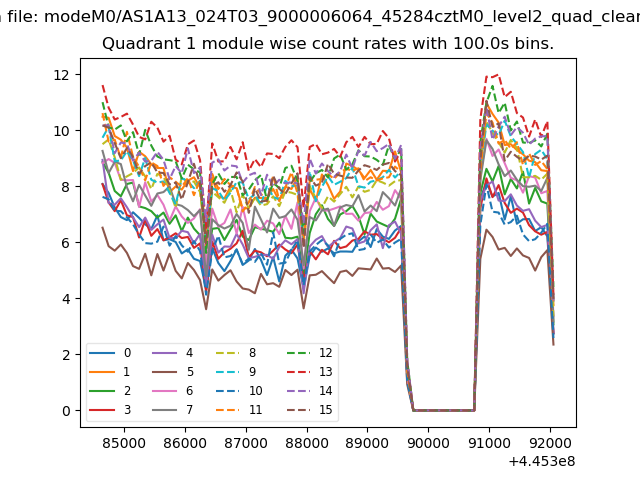
| Module-wise count rates for Quadrant A Data is divided into 100 sec bins |
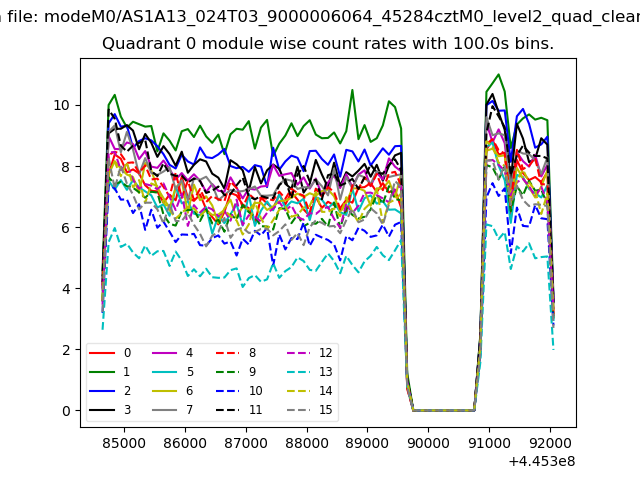 |
 |
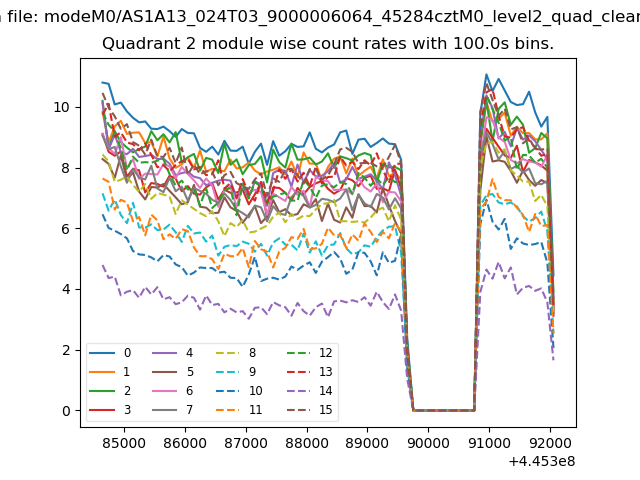
| Module-wise count rates for Quadrant B Data is divided into 100 sec bins |
 |
 |
| Module-wise count rates for Quadrant C Data is divided into 100 sec bins |
 |
 |
| Module-wise count rates for Quadrant D Data is divided into 100 sec bins |
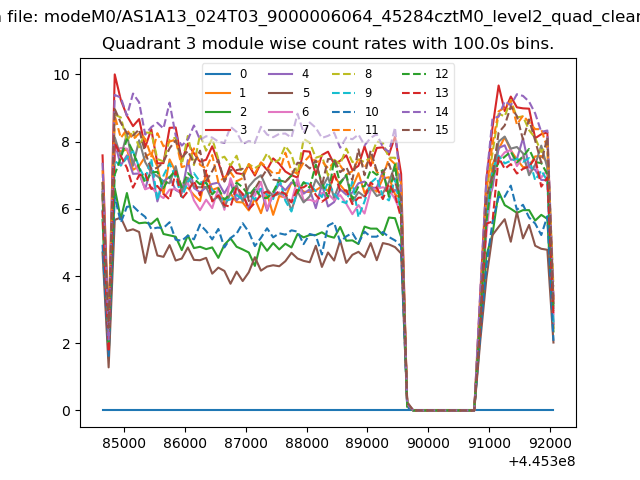 |
 |
| Parameter | Plot |
|---|---|
| CZT HV Monitor | 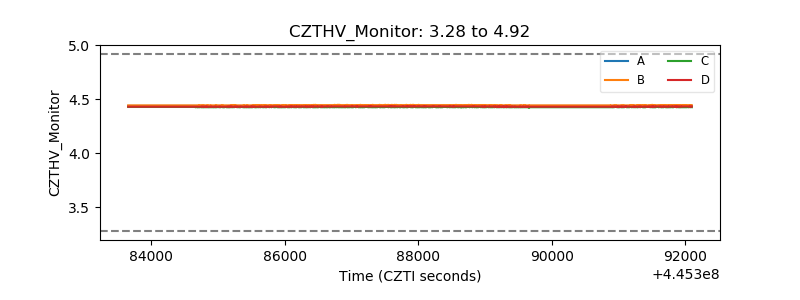 |
| D_VDD | 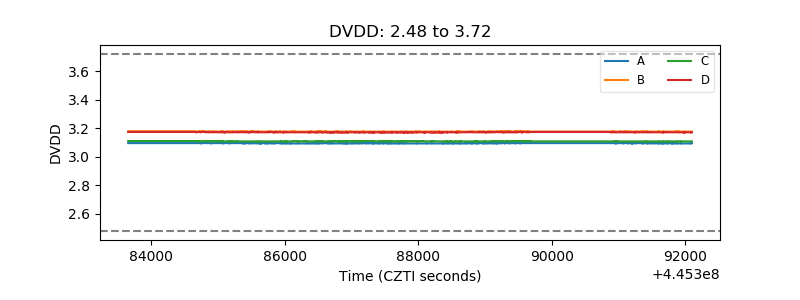 |
| Temperature 1 | 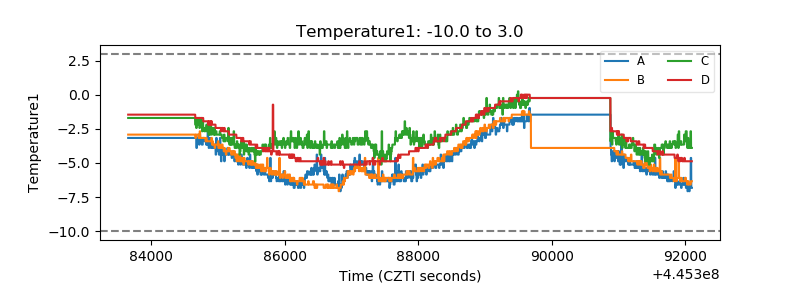 |
| Veto HV Monitor |  |
| Veto LLD | 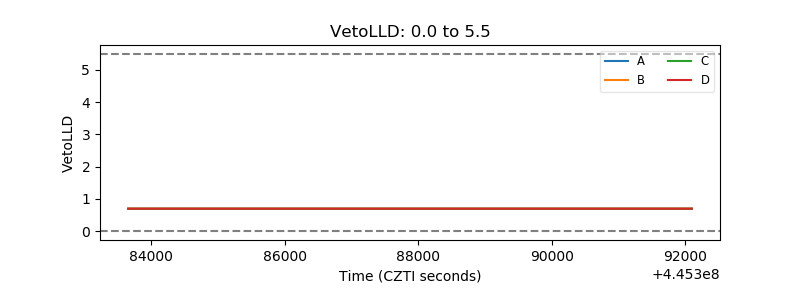 |
| Alpha Counter | 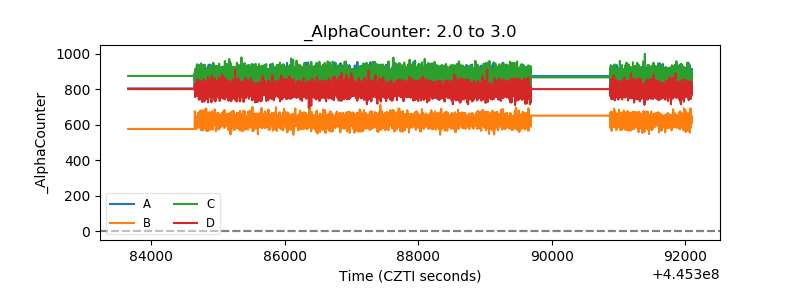 |
| _CPM_Rate | 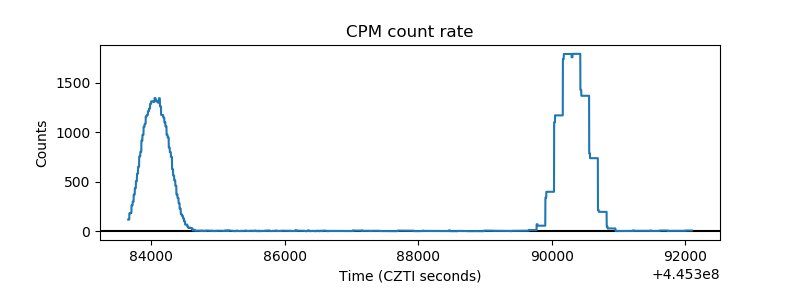 |
| CZT Counter | 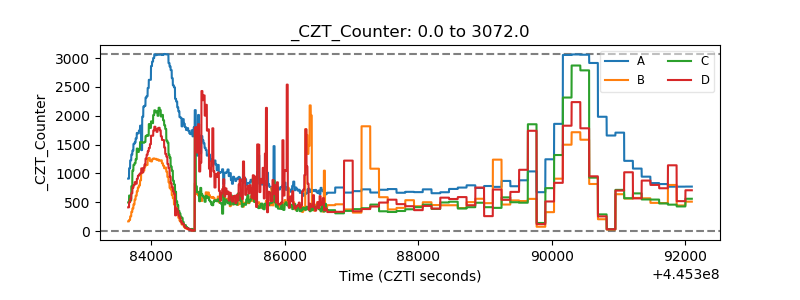 |
| +2.5 Volts monitor | 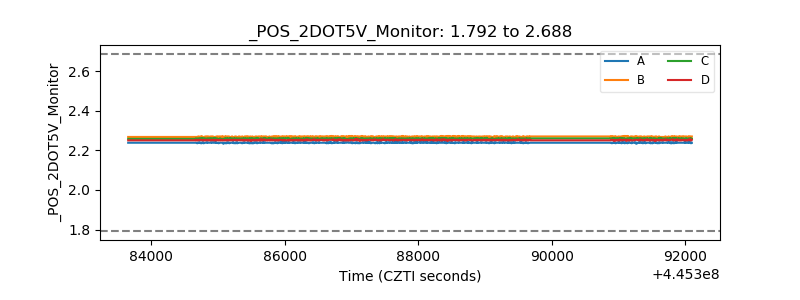 |
| +5 Volts monitor | 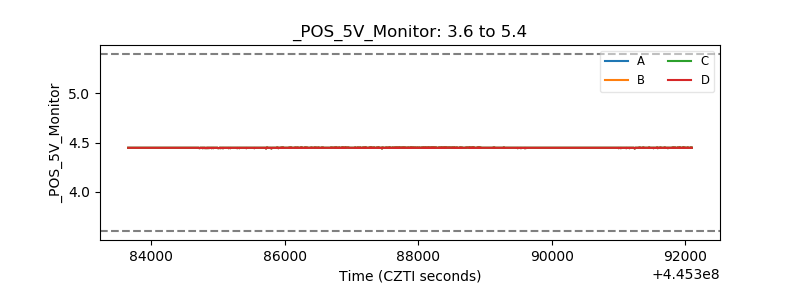 |
| _ROLL_ROT | 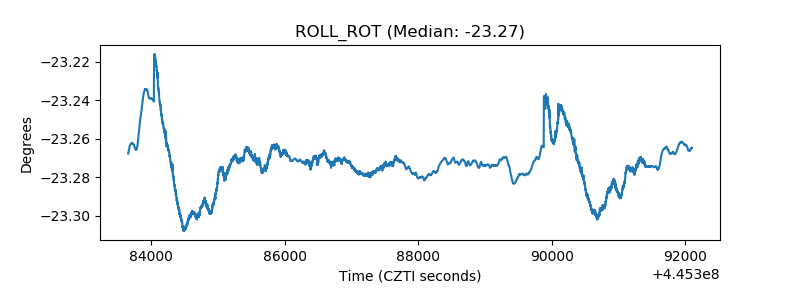 |
| _Roll_DEC | 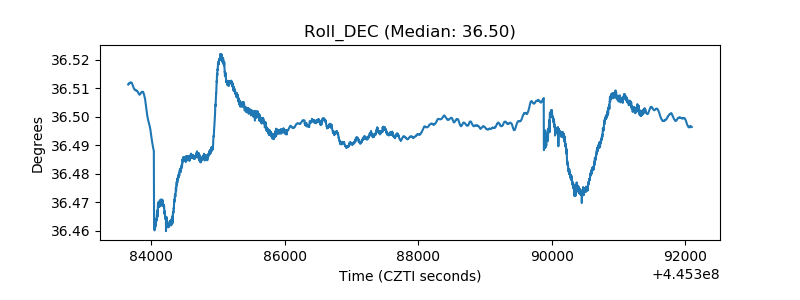 |
| _Roll_RA | 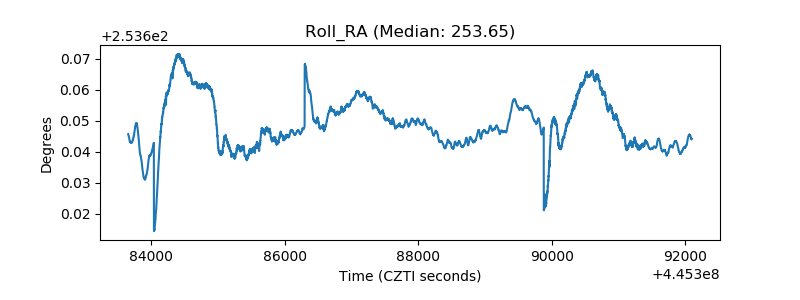 |
| Veto Counter | 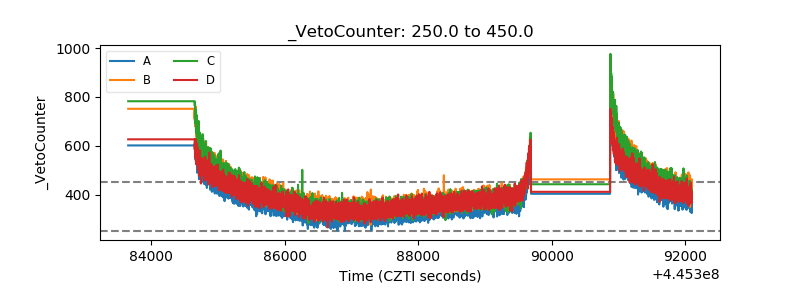 |