| Param | Original file | Final file |
|---|---|---|
| Filename | modeM0/AS1A13_024T03_9000006064_45285cztM0_level2.fits | modeM0/AS1A13_024T03_9000006064_45285cztM0_level2_quad_clean.evt |
| Size (bytes) | 479,370,240 | 112,181,760 |
| Size | 457.2 MB | 107.0 MB |
| Events in quadrant A | 5,819,433 | 736,405 |
| Events in quadrant B | 3,431,149 | 798,244 |
| Events in quadrant C | 3,413,637 | 758,330 |
| Events in quadrant D | 4,585,677 | 658,963 |
| Mode M0 | |||
|---|---|---|---|
| Quadrant | BADHDUFLAG | Total packets | Discarded packets |
| A | 0 | 22045 | 6 |
| B | 0 | 14463 | 2 |
| C | 0 | 14623 | 2 |
| D | 0 | 18145 | 2 |
| Mode SS | |||
|---|---|---|---|
| Quadrant | BADHDUFLAG | Total packets | Discarded packets |
| A | 0 | 130 | 0 |
| B | 0 | 130 | 0 |
| C | 0 | 130 | 0 |
| D | 0 | 130 | 0 |
| Mode M9 | |||
|---|---|---|---|
| Quadrant | BADHDUFLAG | Total packets | Discarded packets |
| A | 0 | 20 | 0 |
| B | 0 | 20 | 0 |
| C | 0 | 21 | 0 |
| D | 0 | 21 | 0 |
| Quadrant | Total seconds | Saturated seconds | Saturation percentage |
|---|---|---|---|
| A | 6376 | 336 | 5.269762% |
| B | 6376 | 131 | 2.054580% |
| C | 6376 | 96 | 1.505646% |
| D | 6376 | 287 | 4.501255% |
Noise dominated data is calculated using 1-second bins in cleaned event files. If a bin has >2000 counts, and if more than 50% of those come from <1% of pixels, then it is considered to be noise-dominated and hence unusable.
| Quadrant | # 1 sec bins | Bins with >0 counts | Bins with >2000 counts | High rate bins dominated by noise | Noise dominated (total time) | Noise dominated (detector-on time) | Marked lightcurve |
|---|---|---|---|---|---|---|---|
| A | 7610 | 6375 | 160 | 160 | 2.10% | 2.51% | 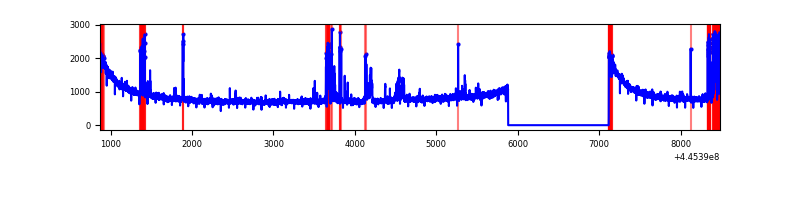 |
| B | 7611 | 6377 | 52 | 52 | 0.68% | 0.82% | 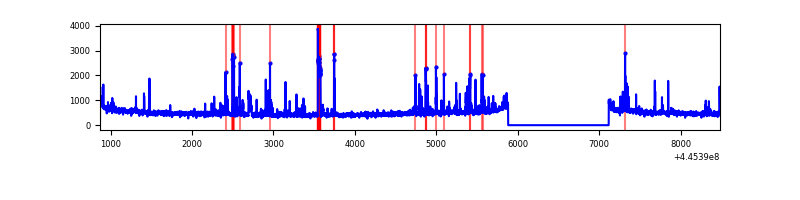 |
| C | 7611 | 6376 | 74 | 74 | 0.97% | 1.16% | 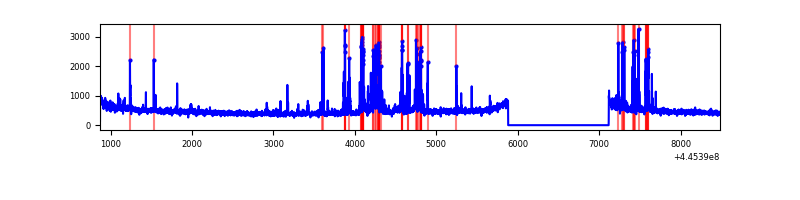 |
| D | 7611 | 6377 | 237 | 237 | 3.11% | 3.72% | 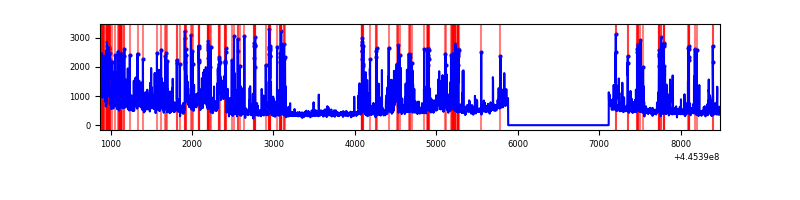 |
Top three noisy pixels from each quadrant. If the there are fewer than three noisy pixels in the level2.evt file, extra rows are filled as -1
| Pixel properties | Quadrant properties | ||||||
|---|---|---|---|---|---|---|---|
| Quadrant | DetID | PixID | Counts | Sigma | Mean | Median | Sigma |
| A | 10 | 83 | 2471565 | 16021.34 | 739 | 723 | 154.2 |
| A | 13 | 248 | 270209 | 1747.39 | 739 | 723 | 154.2 |
| A | 10 | 248 | 205414 | 1327.25 | 739 | 723 | 154.2 |
| B | 5 | 32 | 195182 | 1330.48 | 752 | 731 | 146.2 |
| B | 10 | 3 | 78653 | 533.16 | 752 | 731 | 146.2 |
| B | 0 | 189 | 78106 | 529.42 | 752 | 731 | 146.2 |
| C | 14 | 254 | 465030 | 2690.09 | 740 | 745 | 172.6 |
| C | 2 | 14 | 29593 | 167.14 | 740 | 745 | 172.6 |
| C | 3 | 233 | 20799 | 116.19 | 740 | 745 | 172.6 |
| D | 13 | 249 | 425682 | 2358.55 | 716 | 693 | 180.2 |
| D | 2 | 249 | 409741 | 2270.08 | 716 | 693 | 180.2 |
| D | 13 | 84 | 231590 | 1281.4 | 716 | 693 | 180.2 |
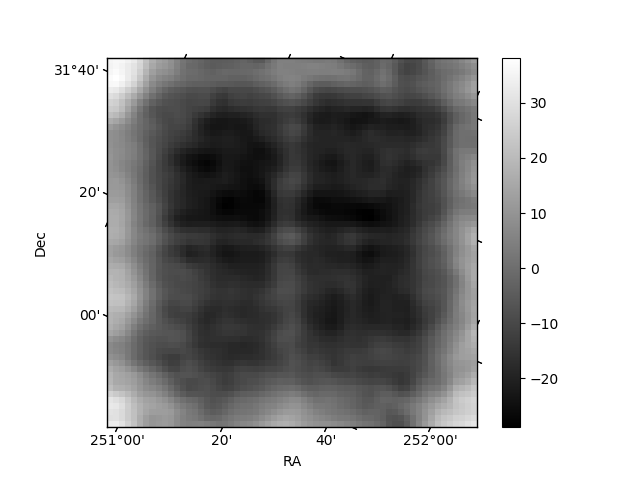
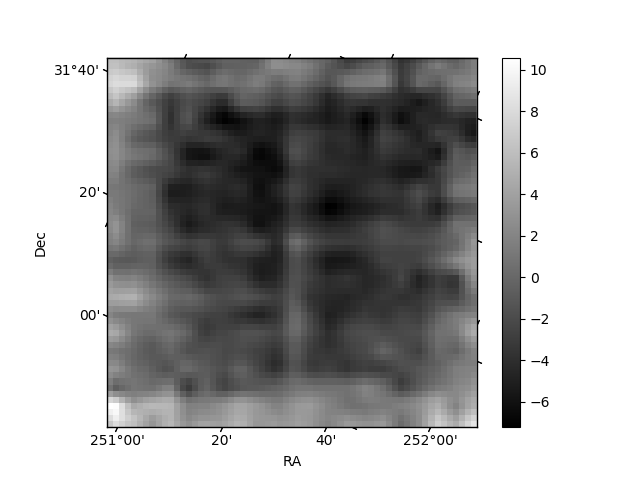
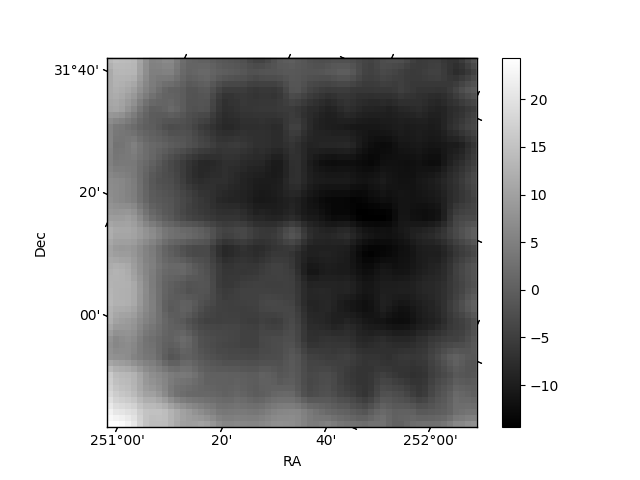
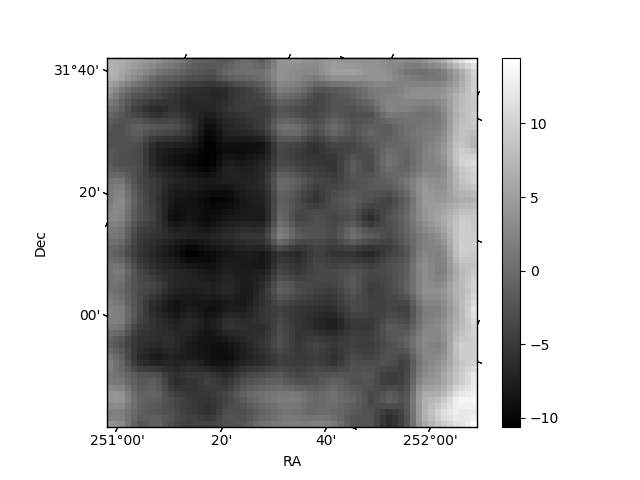
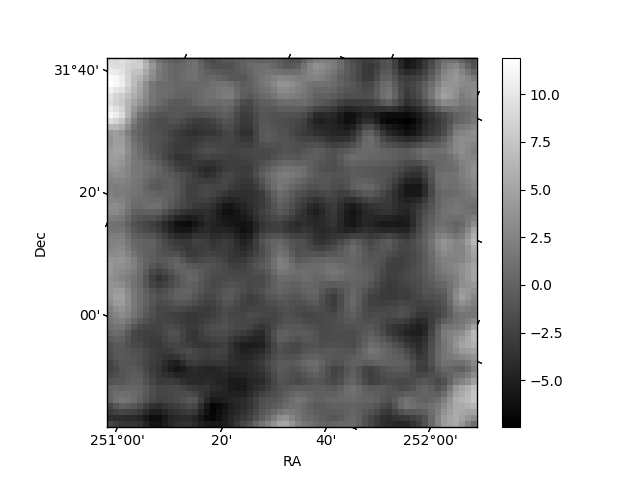
Histogram calculated using DETX and DETY for each event in the final _common_clean file
| Quadrant A | 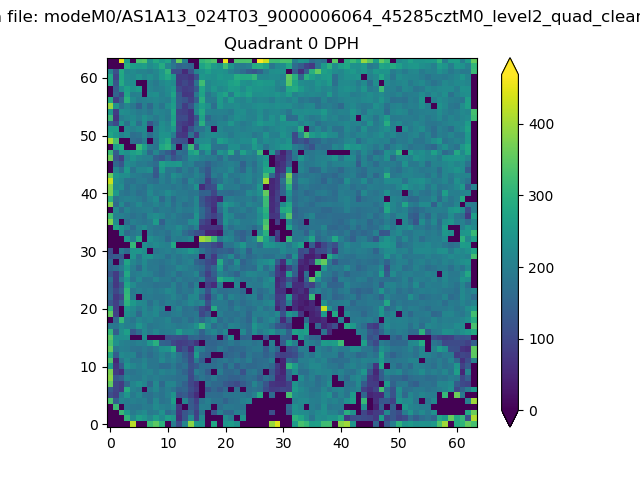 |
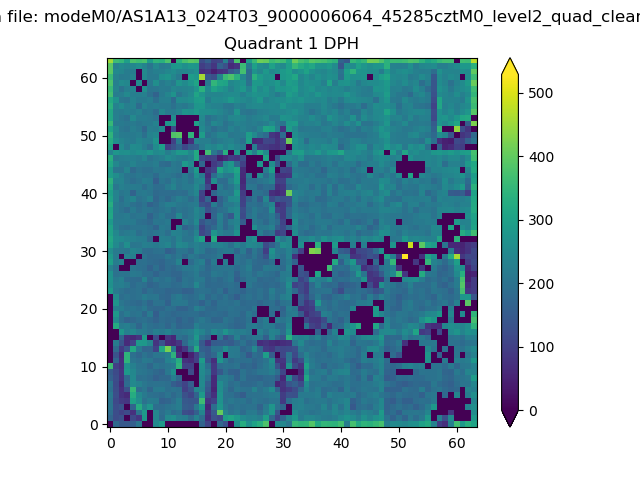 |
Quadrant B |
|---|---|---|---|
| Quadrant D | 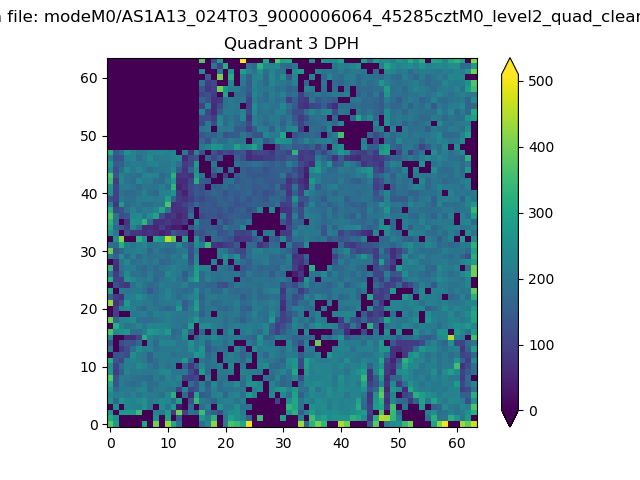 |
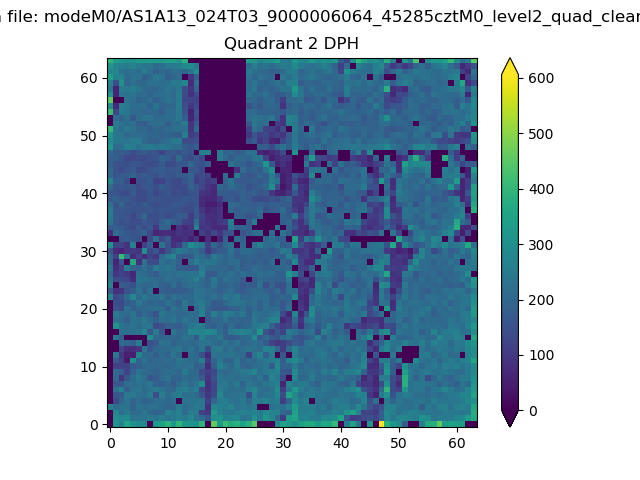 |
Quadrant C |
| Plot type | Count rate plots | Images |
|---|---|---|
| Comparison with Poisson distribution Blue bars denote a histogram of data divided into 1 sec bins. Red curve is a Poisson curve with rate = median count rate of data. |
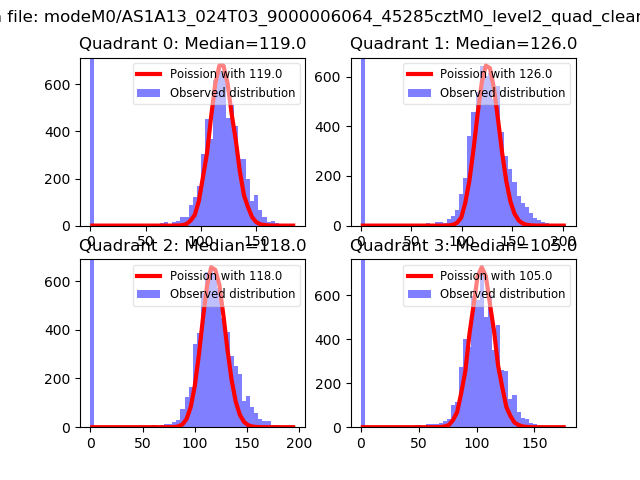 |
 |
| Quadrant-wise count rates Data is divided into 100 sec bins |
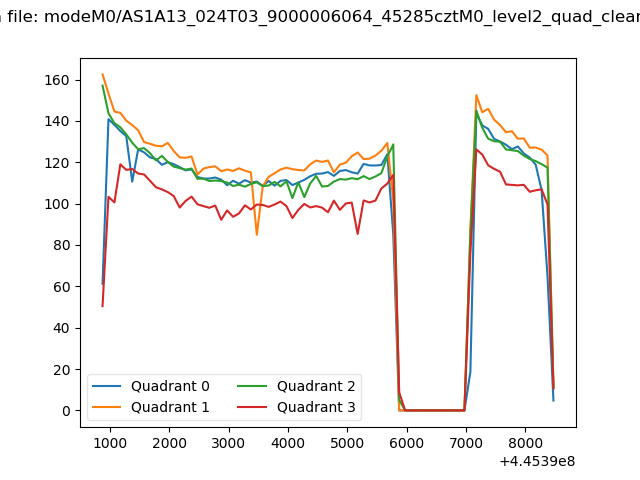 |
|
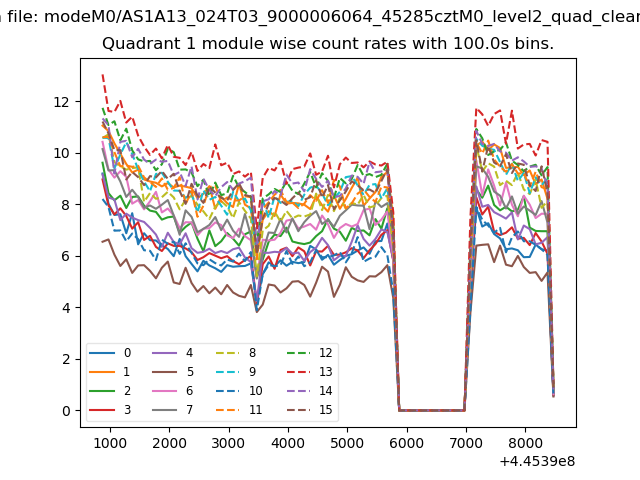
| Module-wise count rates for Quadrant A Data is divided into 100 sec bins |
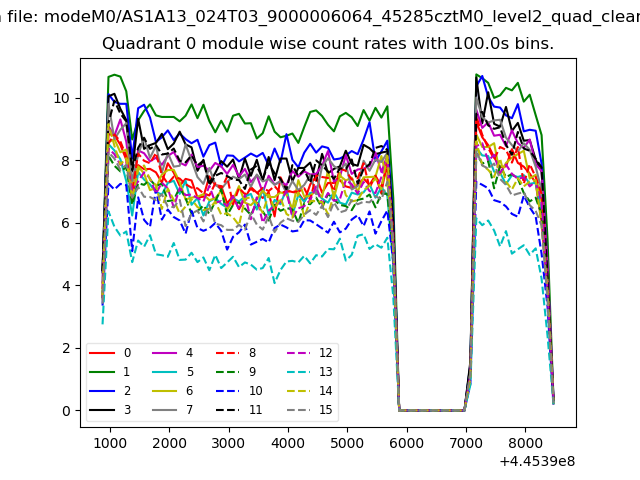 |
 |
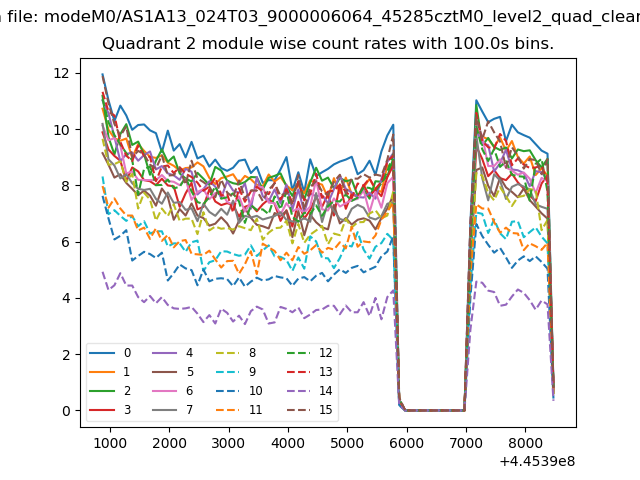
| Module-wise count rates for Quadrant B Data is divided into 100 sec bins |
 |
 |
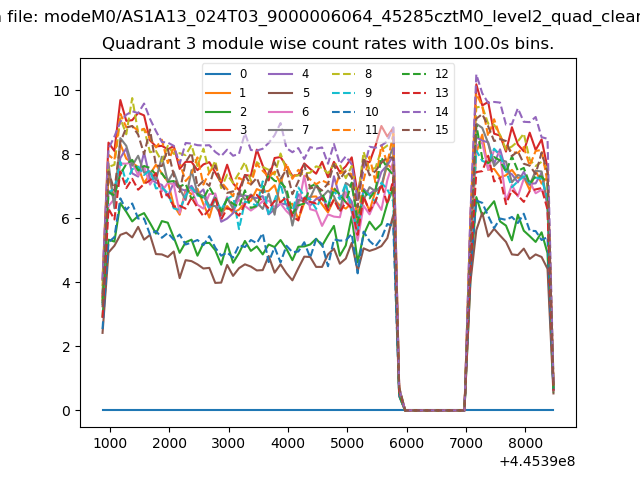
| Module-wise count rates for Quadrant C Data is divided into 100 sec bins |
 |
 |
| Module-wise count rates for Quadrant D Data is divided into 100 sec bins |
 |
 |
| Parameter | Plot |
|---|---|
| CZT HV Monitor | 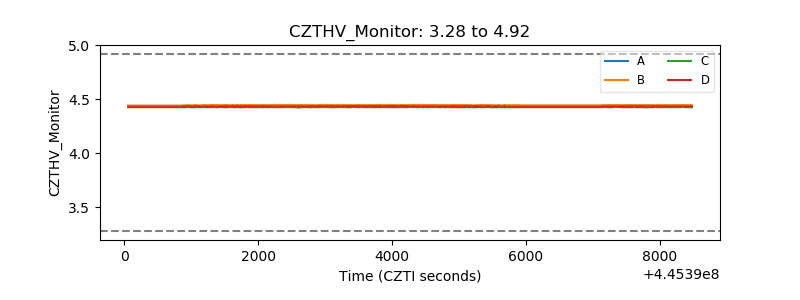 |
| D_VDD | 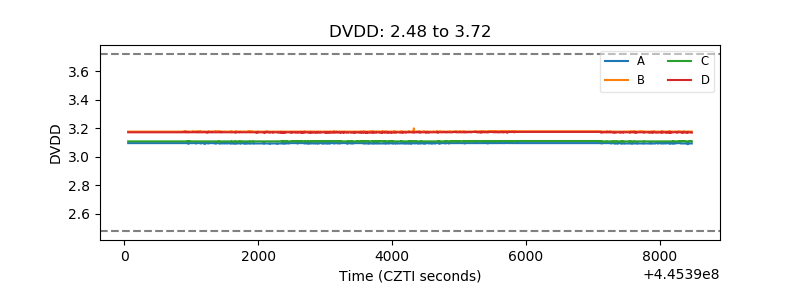 |
| Temperature 1 | 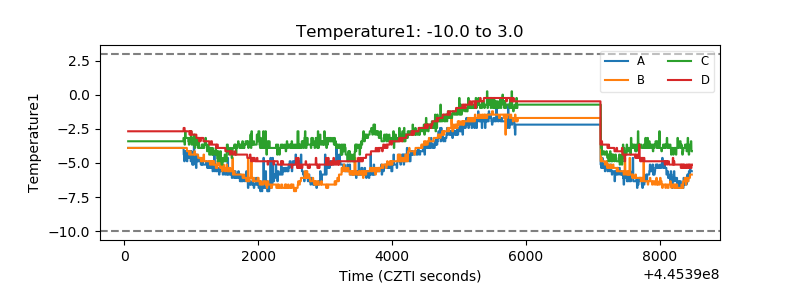 |
| Veto HV Monitor | 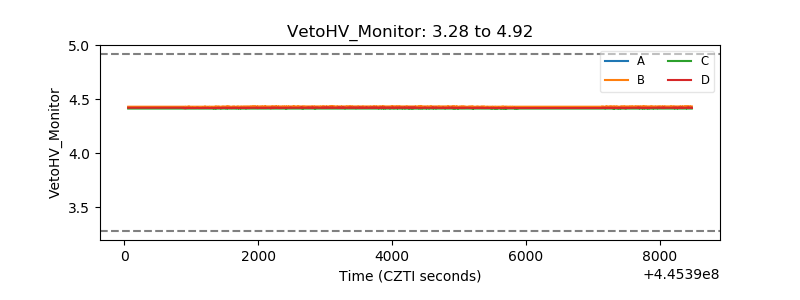 |
| Veto LLD | 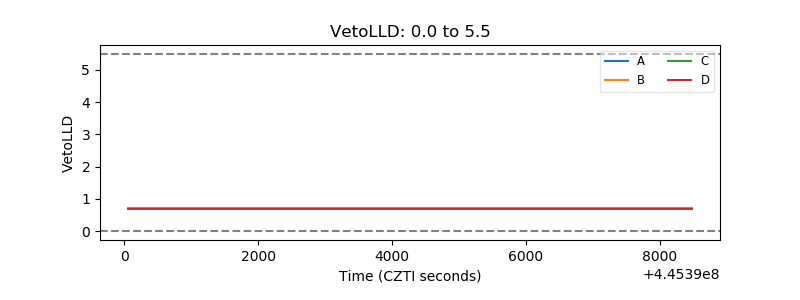 |
| Alpha Counter | 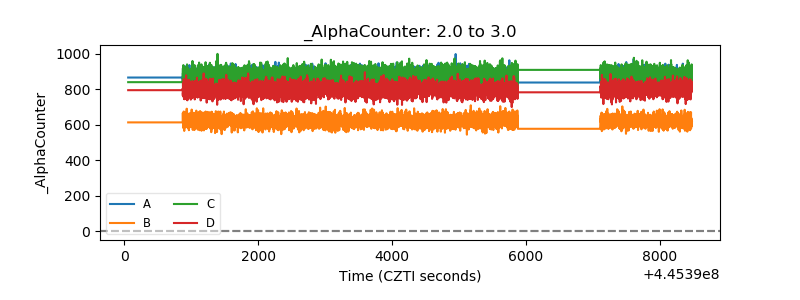 |
| _CPM_Rate | 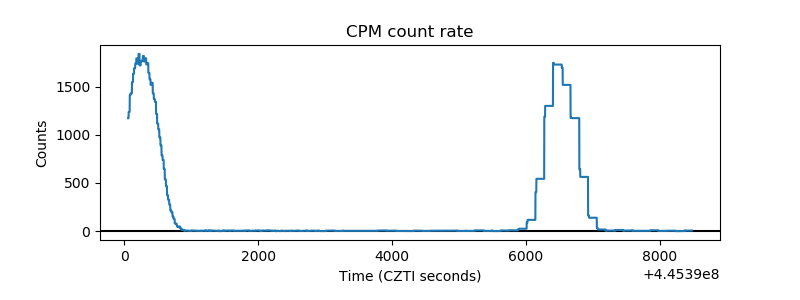 |
| CZT Counter | 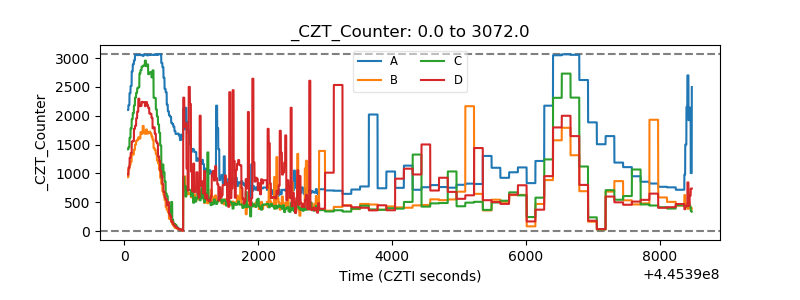 |
| +2.5 Volts monitor | 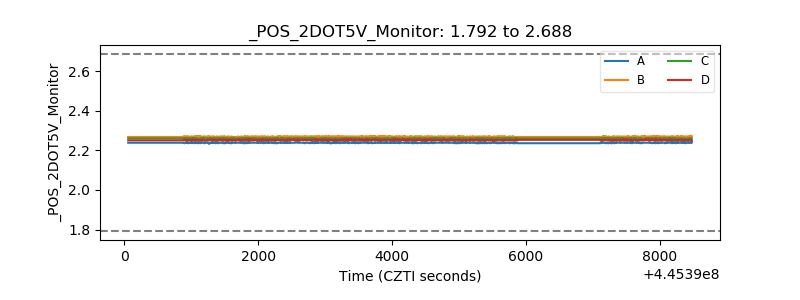 |
| +5 Volts monitor | 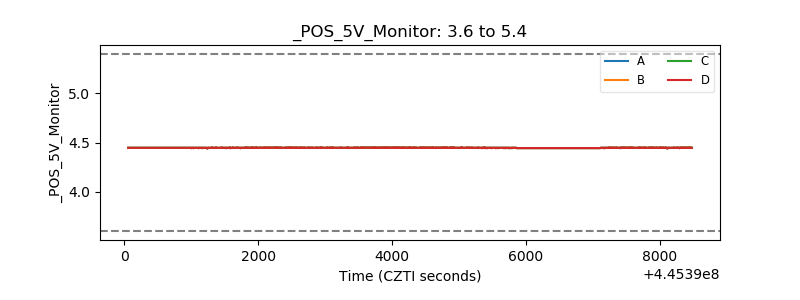 |
| _ROLL_ROT | 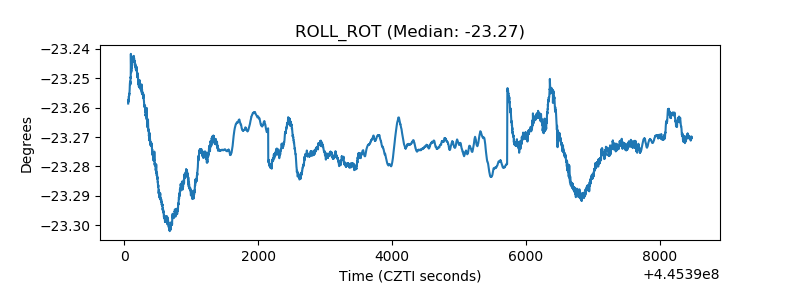 |
| _Roll_DEC | 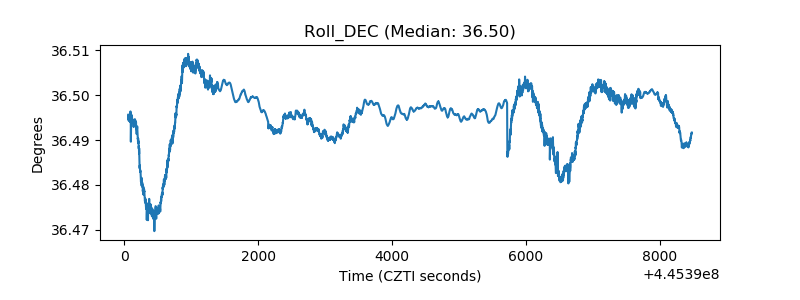 |
| _Roll_RA | 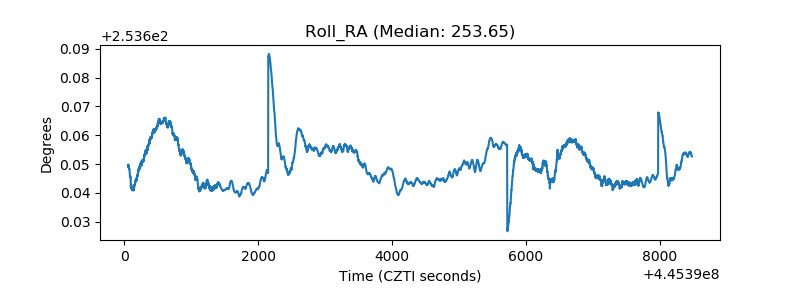 |
| Veto Counter | 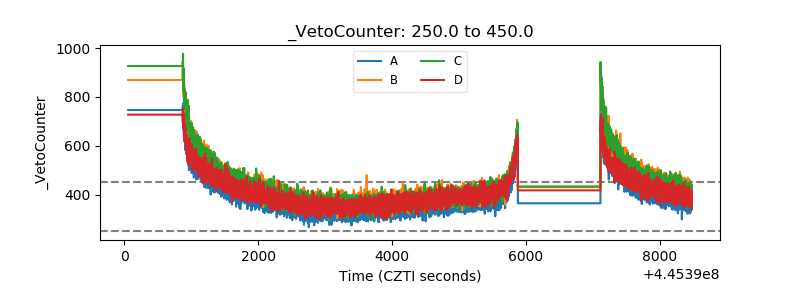 |