| Param | Original file | Final file |
|---|---|---|
| Filename | modeM0/AS1A13_024T03_9000006064_45286cztM0_level2.fits | modeM0/AS1A13_024T03_9000006064_45286cztM0_level2_quad_clean.evt |
| Size (bytes) | 488,761,920 | 116,245,440 |
| Size | 466.1 MB | 110.9 MB |
| Events in quadrant A | 6,550,246 | 748,300 |
| Events in quadrant B | 3,413,664 | 834,223 |
| Events in quadrant C | 3,364,875 | 783,639 |
| Events in quadrant D | 4,244,199 | 687,433 |
| Mode M0 | |||
|---|---|---|---|
| Quadrant | BADHDUFLAG | Total packets | Discarded packets |
| A | 0 | 24251 | 2 |
| B | 0 | 14630 | 2 |
| C | 0 | 14785 | 2 |
| D | 0 | 17395 | 2 |
| Mode SS | |||
|---|---|---|---|
| Quadrant | BADHDUFLAG | Total packets | Discarded packets |
| A | 0 | 136 | 0 |
| B | 0 | 136 | 0 |
| C | 0 | 136 | 0 |
| D | 0 | 136 | 0 |
| Mode M9 | |||
|---|---|---|---|
| Quadrant | BADHDUFLAG | Total packets | Discarded packets |
| A | 0 | 12 | 0 |
| B | 0 | 12 | 0 |
| C | 0 | 12 | 0 |
| D | 0 | 12 | 0 |
| Quadrant | Total seconds | Saturated seconds | Saturation percentage |
|---|---|---|---|
| A | 6690 | 520 | 7.772795% |
| B | 6690 | 92 | 1.375187% |
| C | 6691 | 96 | 1.434763% |
| D | 6691 | 275 | 4.109999% |
Noise dominated data is calculated using 1-second bins in cleaned event files. If a bin has >2000 counts, and if more than 50% of those come from <1% of pixels, then it is considered to be noise-dominated and hence unusable.
| Quadrant | # 1 sec bins | Bins with >0 counts | Bins with >2000 counts | High rate bins dominated by noise | Noise dominated (total time) | Noise dominated (detector-on time) | Marked lightcurve |
|---|---|---|---|---|---|---|---|
| A | 7925 | 6690 | 386 | 386 | 4.87% | 5.77% | 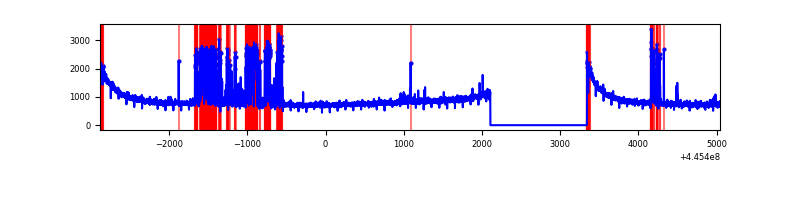 |
| B | 7925 | 6690 | 24 | 24 | 0.30% | 0.36% | 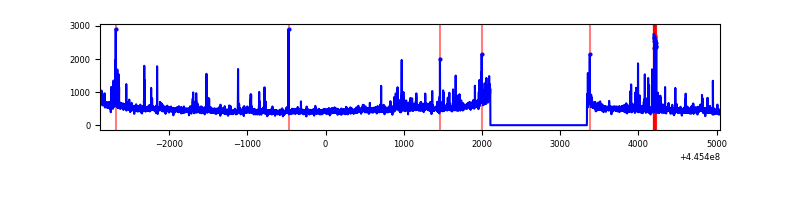 |
| C | 7926 | 6691 | 45 | 45 | 0.57% | 0.67% | 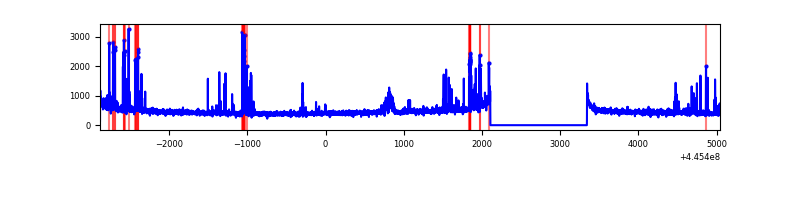 |
| D | 7926 | 6691 | 222 | 222 | 2.80% | 3.32% |  |
Top three noisy pixels from each quadrant. If the there are fewer than three noisy pixels in the level2.evt file, extra rows are filled as -1
| Pixel properties | Quadrant properties | ||||||
|---|---|---|---|---|---|---|---|
| Quadrant | DetID | PixID | Counts | Sigma | Mean | Median | Sigma |
| A | 10 | 83 | 2599904 | 16468.08 | 753 | 738 | 157.8 |
| A | 13 | 248 | 1006464 | 6372.19 | 753 | 738 | 157.8 |
| A | 10 | 248 | 22004 | 134.74 | 753 | 738 | 157.8 |
| B | 10 | 3 | 76558 | 498.55 | 781 | 758 | 152.0 |
| B | 5 | 172 | 68081 | 442.8 | 781 | 758 | 152.0 |
| B | 0 | 189 | 54996 | 356.73 | 781 | 758 | 152.0 |
| C | 14 | 254 | 294843 | 1651.28 | 759 | 765 | 178.1 |
| C | 0 | 239 | 37979 | 208.96 | 759 | 765 | 178.1 |
| C | 2 | 14 | 34130 | 187.35 | 759 | 765 | 178.1 |
| D | 13 | 249 | 458573 | 2477.57 | 736 | 715 | 184.8 |
| D | 13 | 171 | 196855 | 1061.36 | 736 | 715 | 184.8 |
| D | 2 | 249 | 194874 | 1050.64 | 736 | 715 | 184.8 |
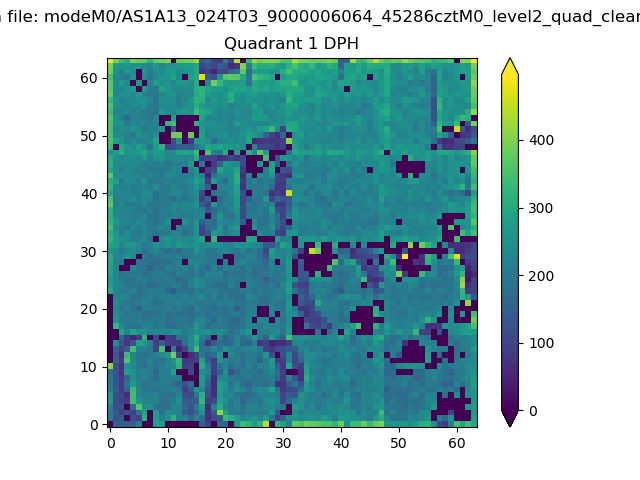
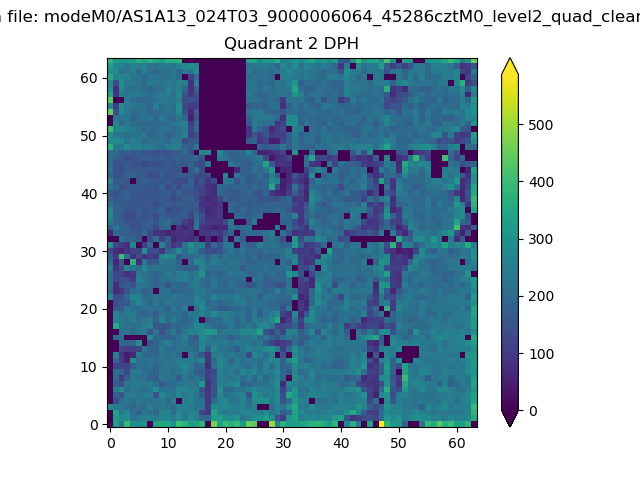
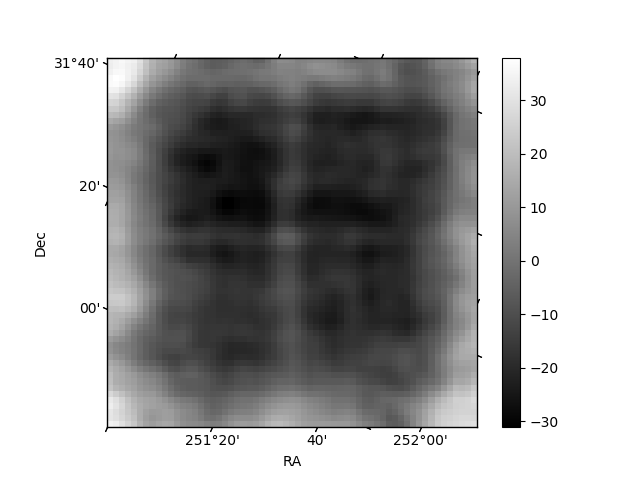
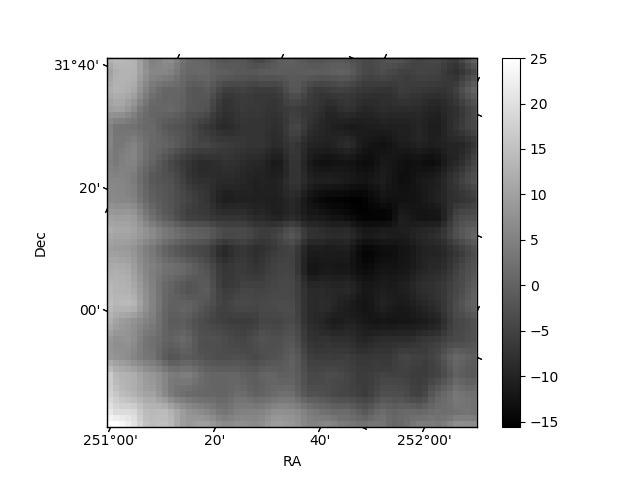
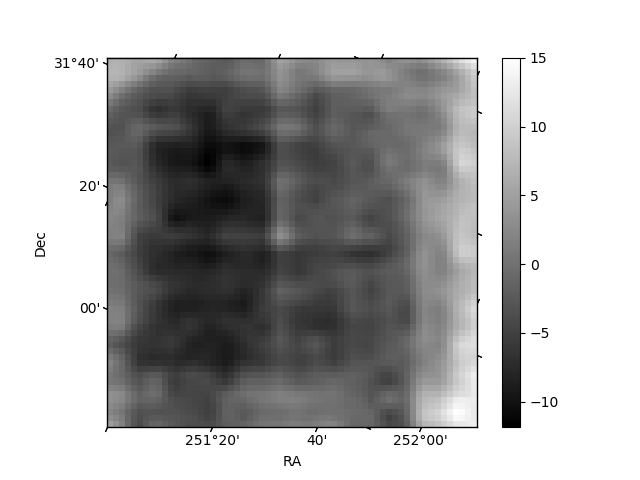
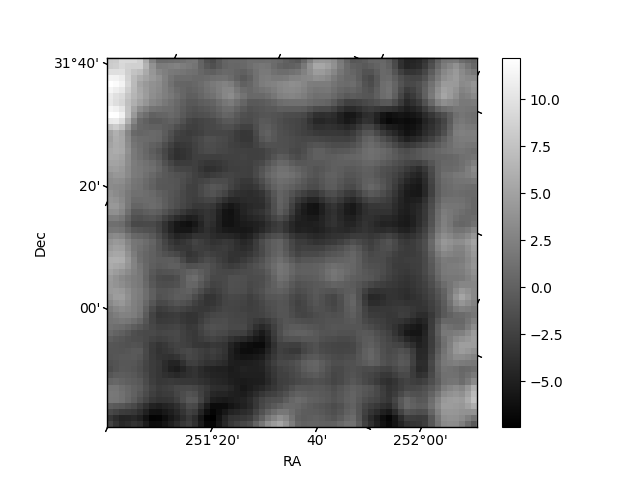
Histogram calculated using DETX and DETY for each event in the final _common_clean file
| Quadrant A | 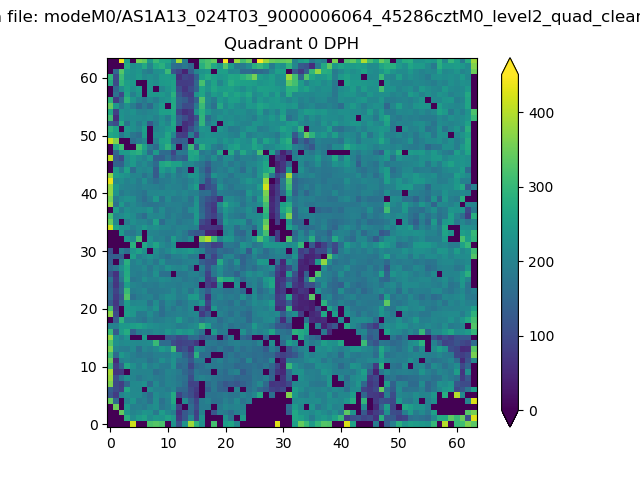 |
 |
Quadrant B |
|---|---|---|---|
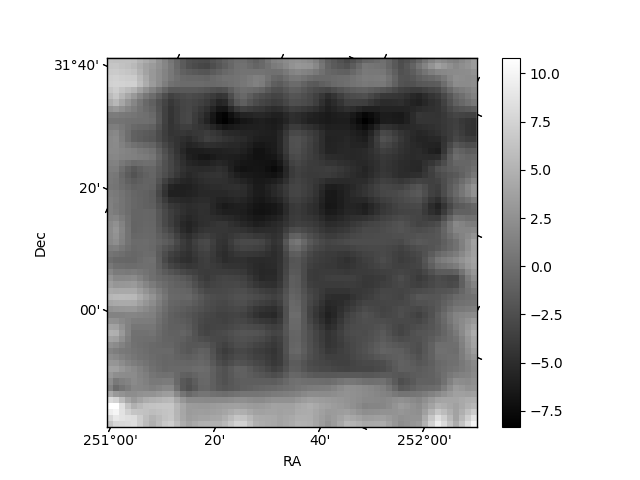
| Quadrant D | 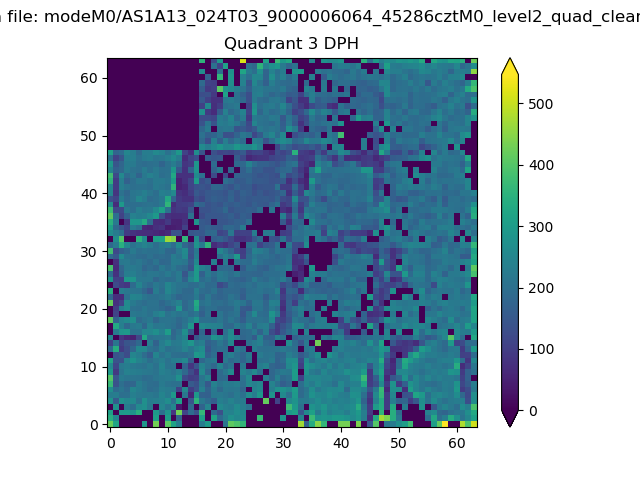 |
 |
Quadrant C |
| Plot type | Count rate plots | Images |
|---|---|---|
| Comparison with Poisson distribution Blue bars denote a histogram of data divided into 1 sec bins. Red curve is a Poisson curve with rate = median count rate of data. |
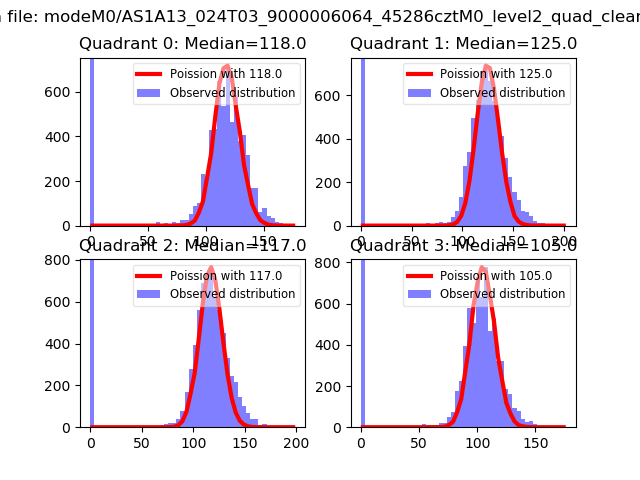 |
 |
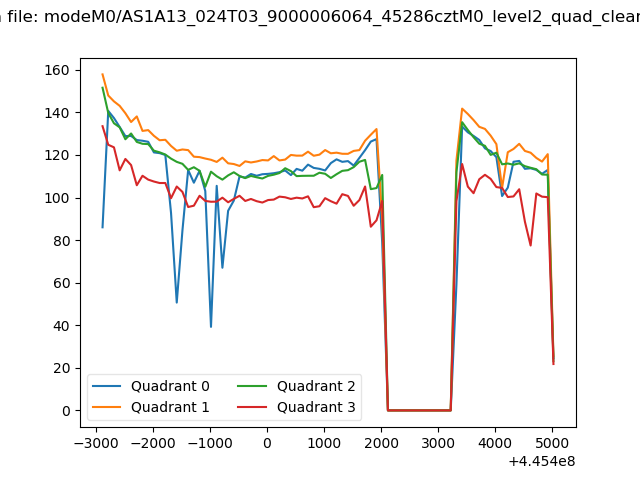
| Quadrant-wise count rates Data is divided into 100 sec bins |
 |
|
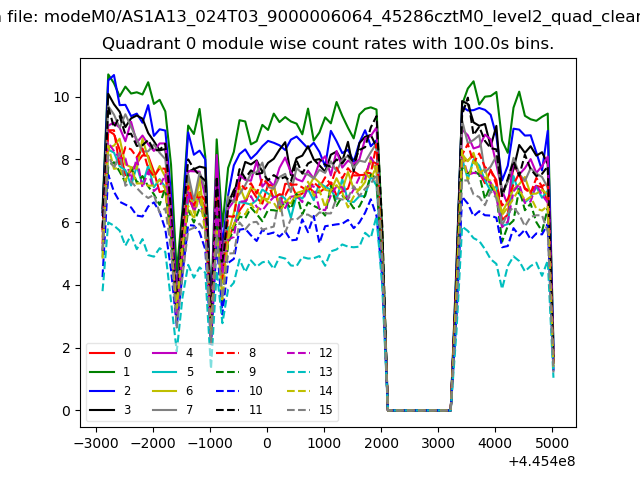
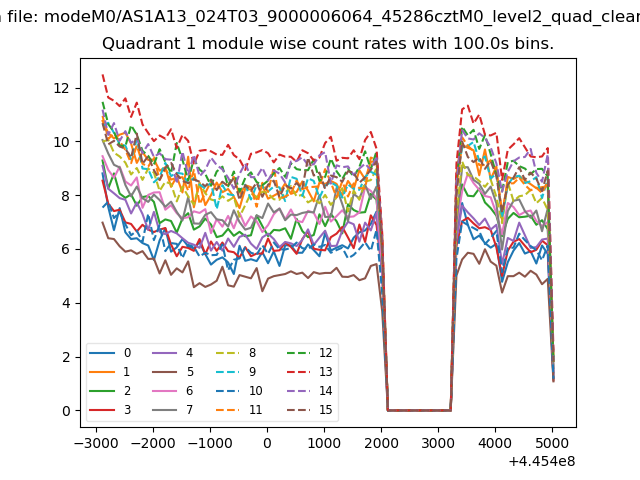
| Module-wise count rates for Quadrant A Data is divided into 100 sec bins |
 |
 |
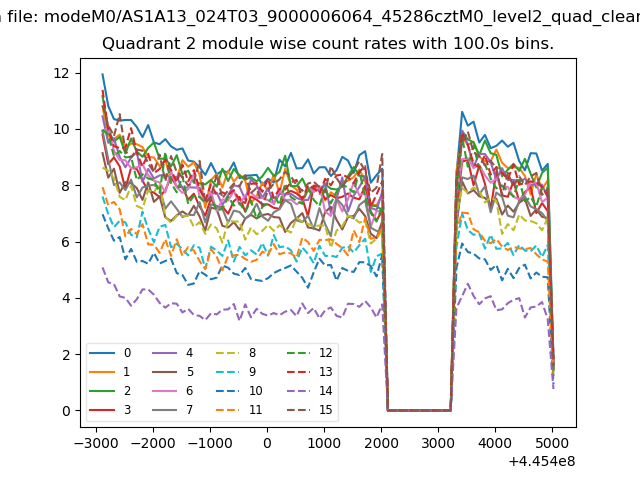
| Module-wise count rates for Quadrant B Data is divided into 100 sec bins |
 |
 |
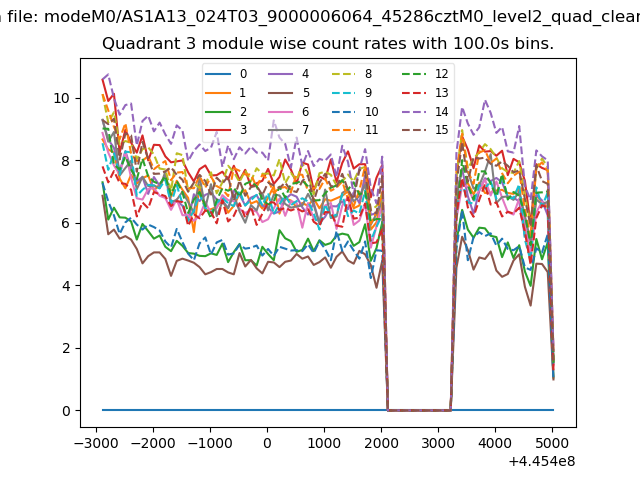
| Module-wise count rates for Quadrant C Data is divided into 100 sec bins |
 |
 |
| Module-wise count rates for Quadrant D Data is divided into 100 sec bins |
 |
 |
| Parameter | Plot |
|---|---|
| CZT HV Monitor | 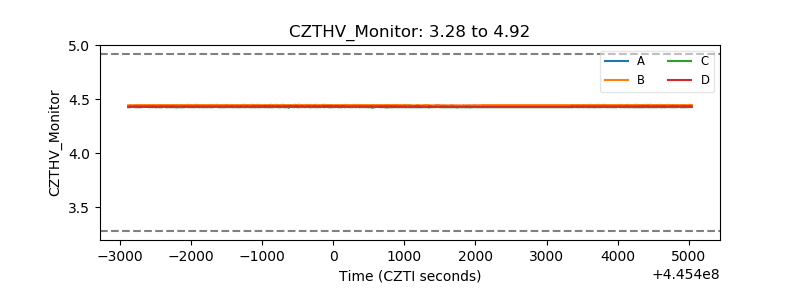 |
| D_VDD | 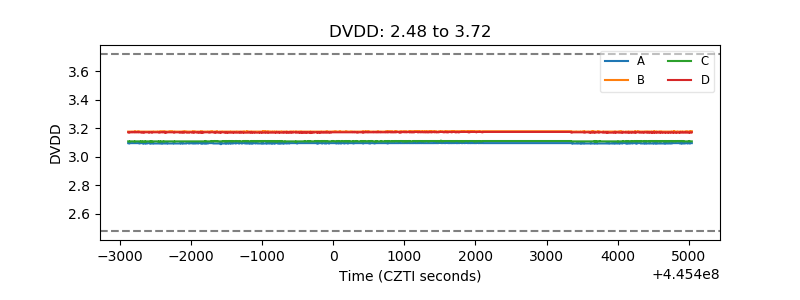 |
| Temperature 1 | 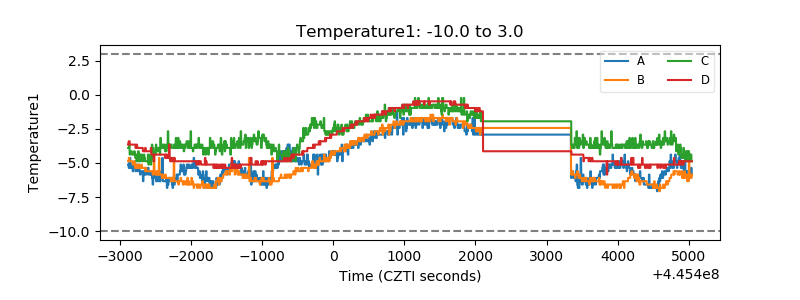 |
| Veto HV Monitor | 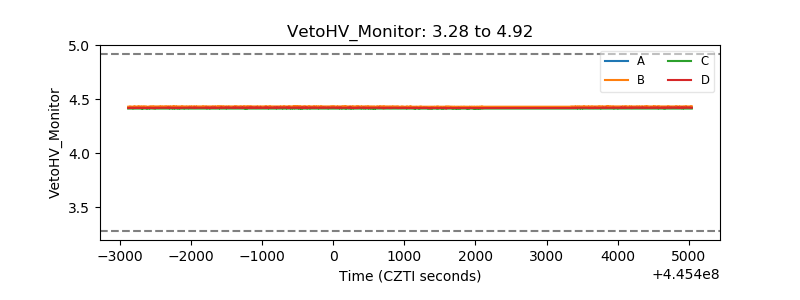 |
| Veto LLD | 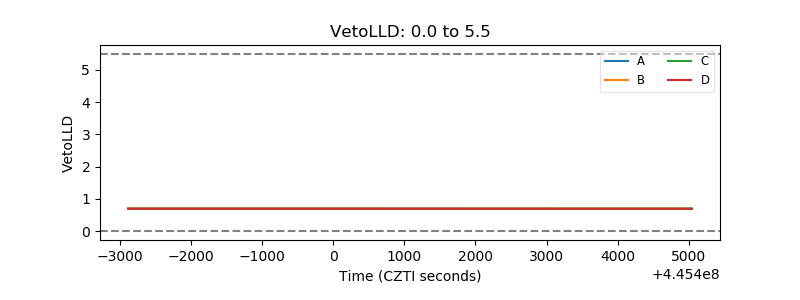 |
| Alpha Counter | 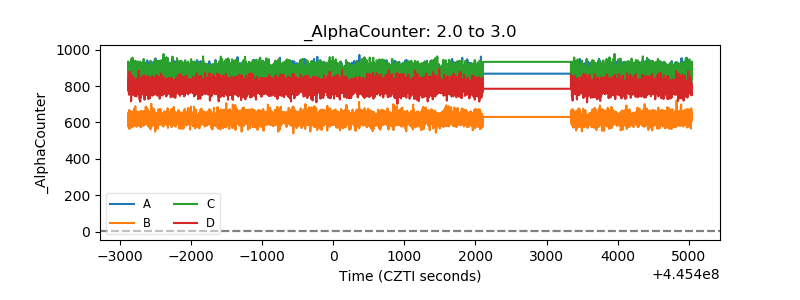 |
| _CPM_Rate | 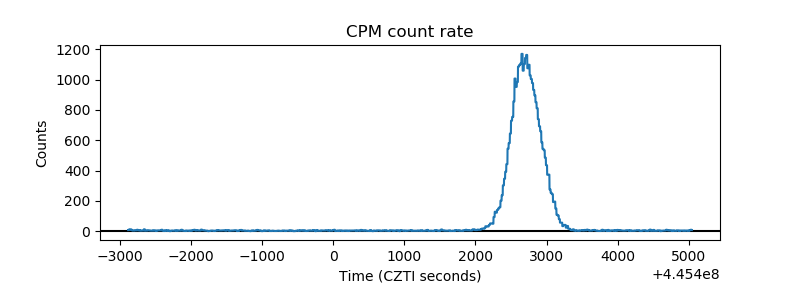 |
| CZT Counter | 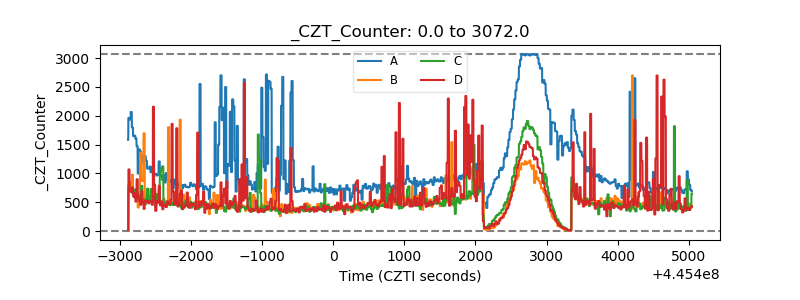 |
| +2.5 Volts monitor | 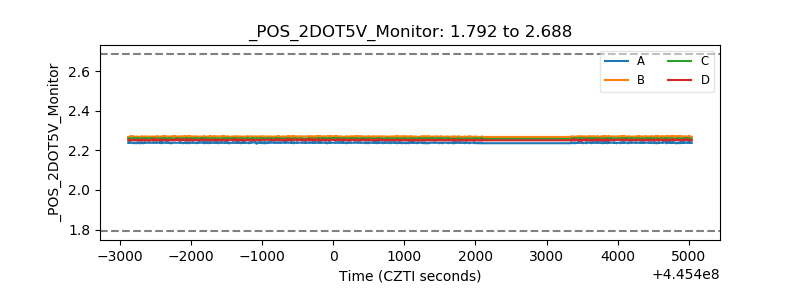 |
| +5 Volts monitor | 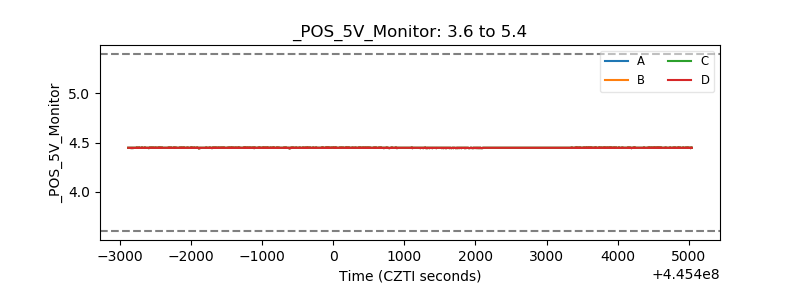 |
| _ROLL_ROT | 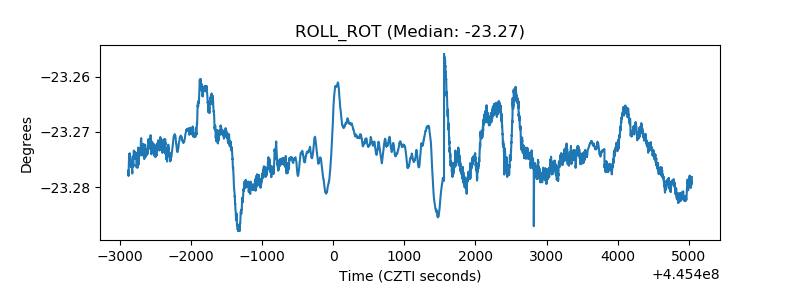 |
| _Roll_DEC | 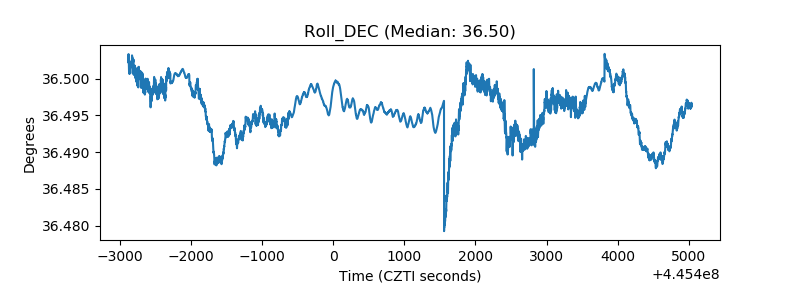 |
| _Roll_RA | 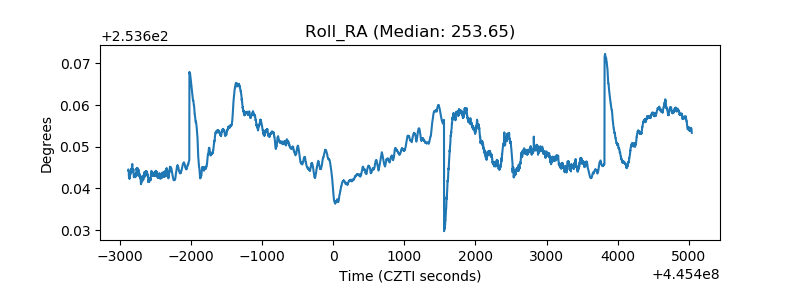 |
| Veto Counter | 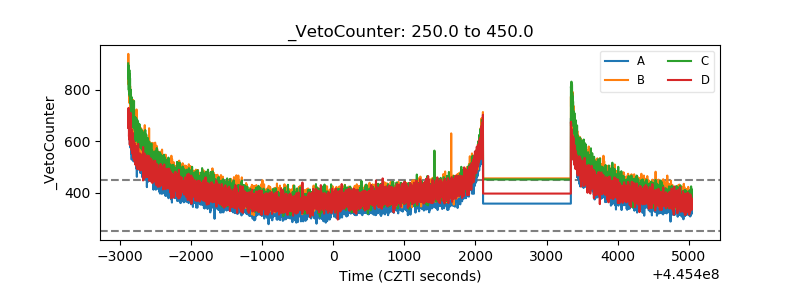 |