| Param | Original file | Final file |
|---|---|---|
| Filename | modeM0/AS1A13_024T03_9000006064_45287cztM0_level2.fits | modeM0/AS1A13_024T03_9000006064_45287cztM0_level2_quad_clean.evt |
| Size (bytes) | 402,768,000 | 96,739,200 |
| Size | 384.1 MB | 92.3 MB |
| Events in quadrant A | 5,073,018 | 634,249 |
| Events in quadrant B | 2,987,640 | 676,289 |
| Events in quadrant C | 2,678,979 | 645,494 |
| Events in quadrant D | 3,720,120 | 569,596 |
| Mode M0 | |||
|---|---|---|---|
| Quadrant | BADHDUFLAG | Total packets | Discarded packets |
| A | 0 | 19436 | 1 |
| B | 0 | 12877 | 1 |
| C | 0 | 12245 | 1 |
| D | 0 | 15129 | 1 |
| Mode SS | |||
|---|---|---|---|
| Quadrant | BADHDUFLAG | Total packets | Discarded packets |
| A | 0 | 118 | 0 |
| B | 0 | 118 | 0 |
| C | 0 | 118 | 0 |
| D | 0 | 118 | 0 |
| Mode M9 | |||
|---|---|---|---|
| Quadrant | BADHDUFLAG | Total packets | Discarded packets |
| A | 0 | 12 | 0 |
| B | 0 | 12 | 0 |
| C | 0 | 12 | 0 |
| D | 0 | 12 | 0 |
| Quadrant | Total seconds | Saturated seconds | Saturation percentage |
|---|---|---|---|
| A | 5779 | 280 | 4.845129% |
| B | 5779 | 117 | 2.024572% |
| C | 5780 | 17 | 0.294118% |
| D | 5780 | 203 | 3.512111% |
Noise dominated data is calculated using 1-second bins in cleaned event files. If a bin has >2000 counts, and if more than 50% of those come from <1% of pixels, then it is considered to be noise-dominated and hence unusable.
| Quadrant | # 1 sec bins | Bins with >0 counts | Bins with >2000 counts | High rate bins dominated by noise | Noise dominated (total time) | Noise dominated (detector-on time) | Marked lightcurve |
|---|---|---|---|---|---|---|---|
| A | 6944 | 5780 | 165 | 165 | 2.38% | 2.85% | 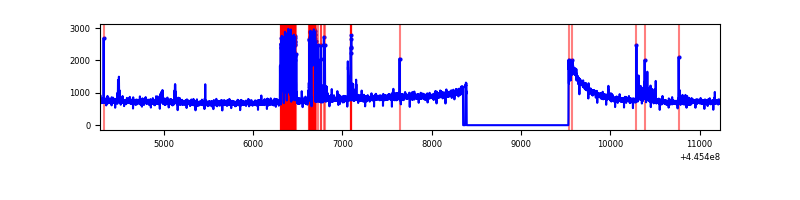 |
| B | 6944 | 5781 | 67 | 67 | 0.96% | 1.16% | 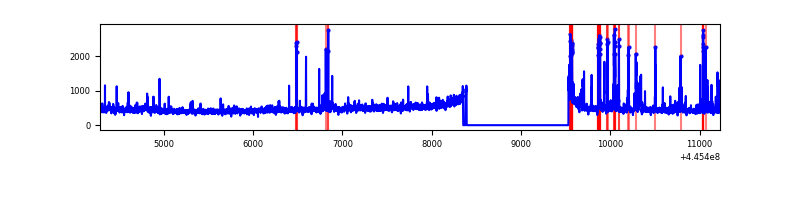 |
| C | 6945 | 5782 | 16 | 16 | 0.23% | 0.28% | 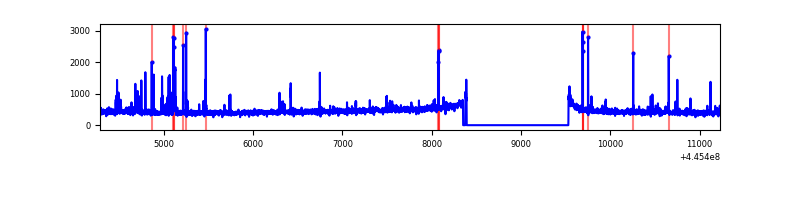 |
| D | 6945 | 5782 | 211 | 211 | 3.04% | 3.65% | 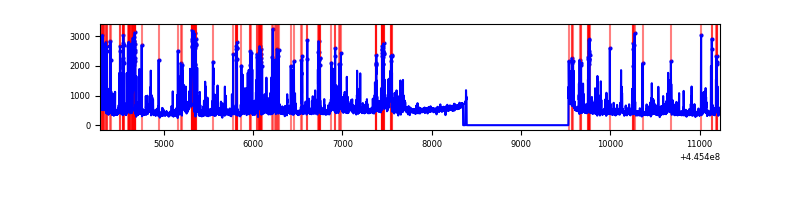 |
Top three noisy pixels from each quadrant. If the there are fewer than three noisy pixels in the level2.evt file, extra rows are filled as -1
| Pixel properties | Quadrant properties | ||||||
|---|---|---|---|---|---|---|---|
| Quadrant | DetID | PixID | Counts | Sigma | Mean | Median | Sigma |
| A | 10 | 83 | 2084644 | 15607.22 | 639 | 626 | 133.5 |
| A | 10 | 248 | 302651 | 2261.87 | 639 | 626 | 133.5 |
| A | 13 | 248 | 210690 | 1573.17 | 639 | 626 | 133.5 |
| B | 5 | 172 | 193992 | 1510.14 | 647 | 628 | 128.0 |
| B | 5 | 32 | 71775 | 555.65 | 647 | 628 | 128.0 |
| B | 0 | 189 | 63180 | 488.52 | 647 | 628 | 128.0 |
| C | 14 | 254 | 147532 | 979.41 | 636 | 639 | 150.0 |
| C | 3 | 233 | 34963 | 228.86 | 636 | 639 | 150.0 |
| C | 12 | 249 | 10921 | 68.56 | 636 | 639 | 150.0 |
| D | 13 | 249 | 402689 | 2587.64 | 620 | 600 | 155.4 |
| D | 2 | 249 | 401854 | 2582.26 | 620 | 600 | 155.4 |
| D | 10 | 199 | 124092 | 794.73 | 620 | 600 | 155.4 |
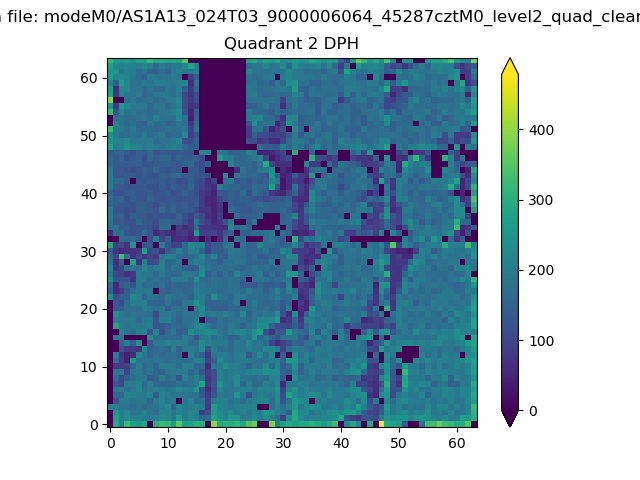
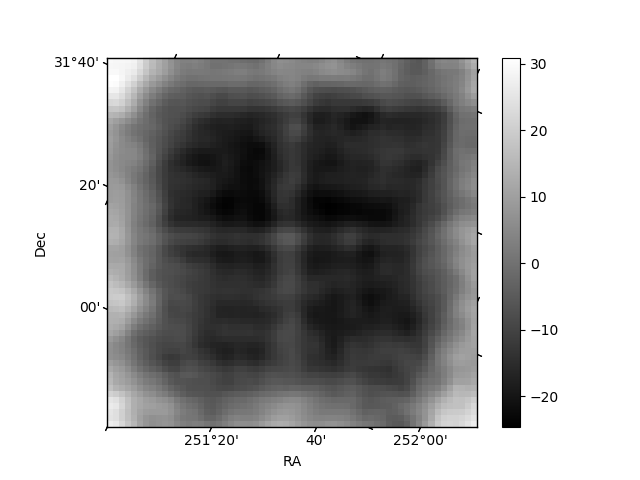
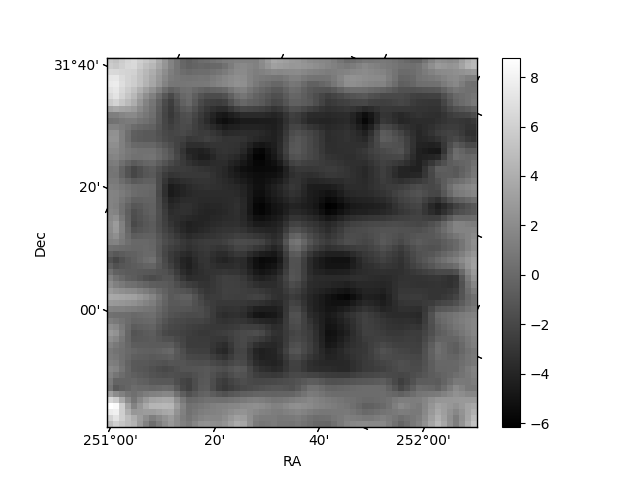
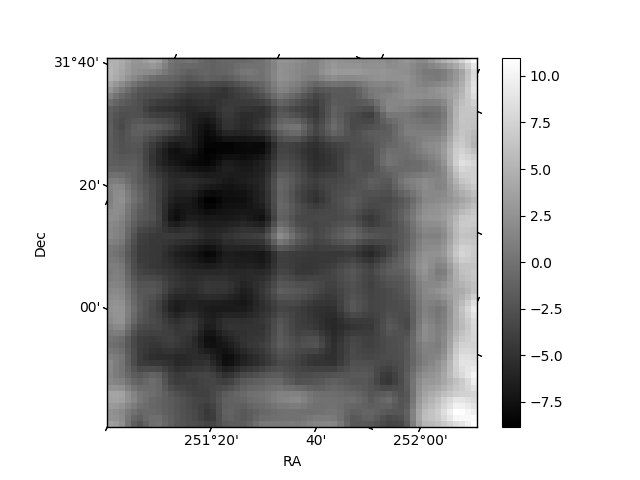
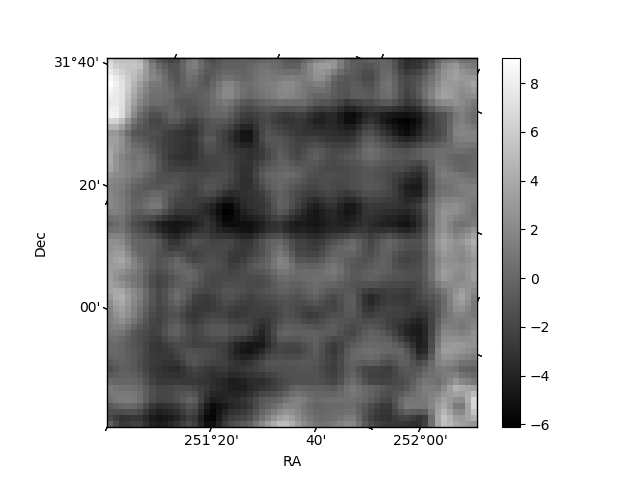
Histogram calculated using DETX and DETY for each event in the final _common_clean file
| Quadrant A | 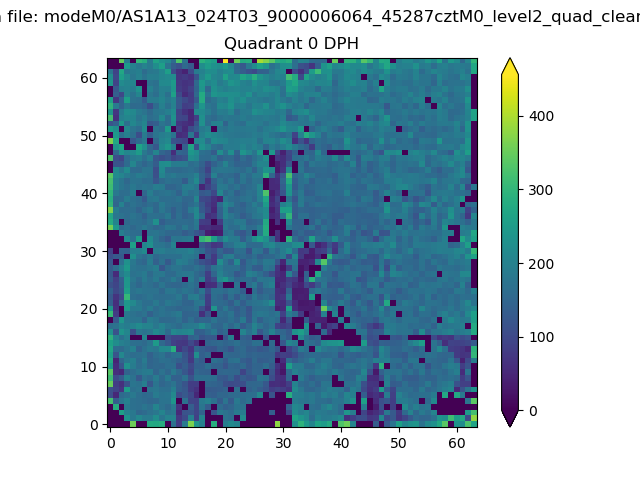 |
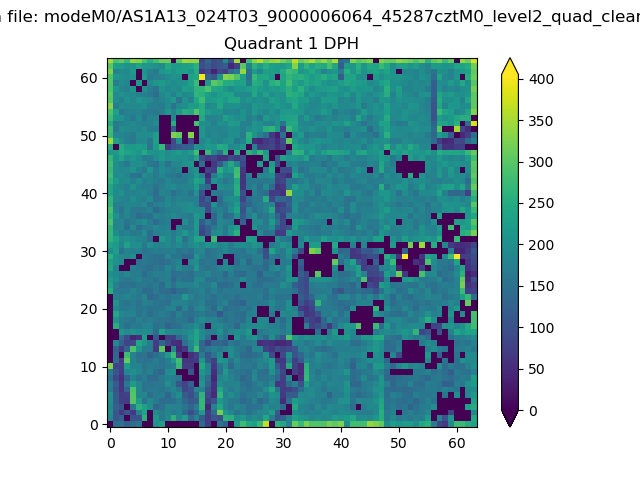 |
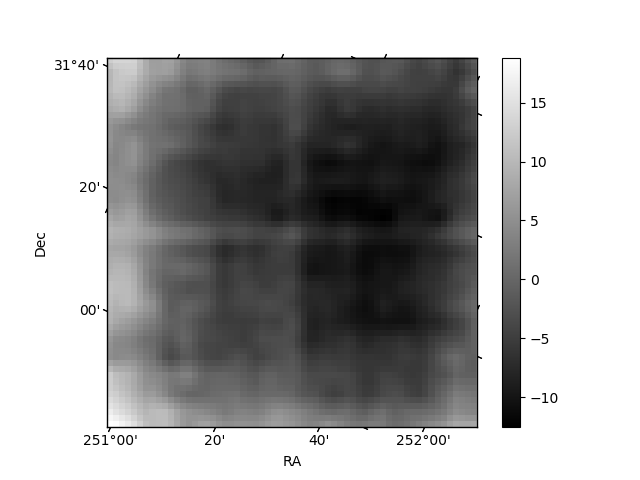
Quadrant B |
|---|---|---|---|
| Quadrant D | 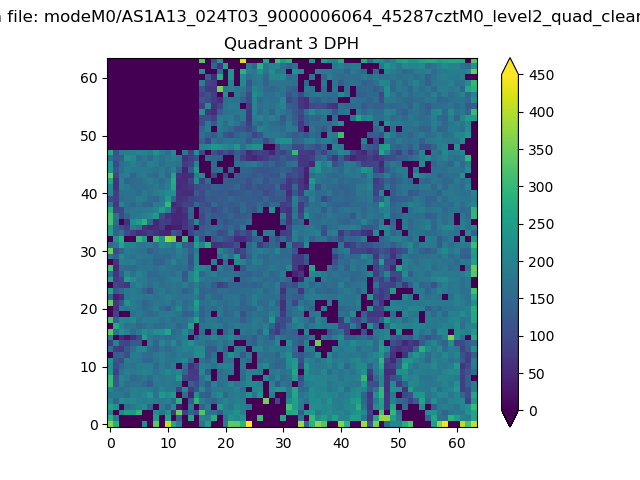 |
 |
Quadrant C |
| Plot type | Count rate plots | Images |
|---|---|---|
| Comparison with Poisson distribution Blue bars denote a histogram of data divided into 1 sec bins. Red curve is a Poisson curve with rate = median count rate of data. |
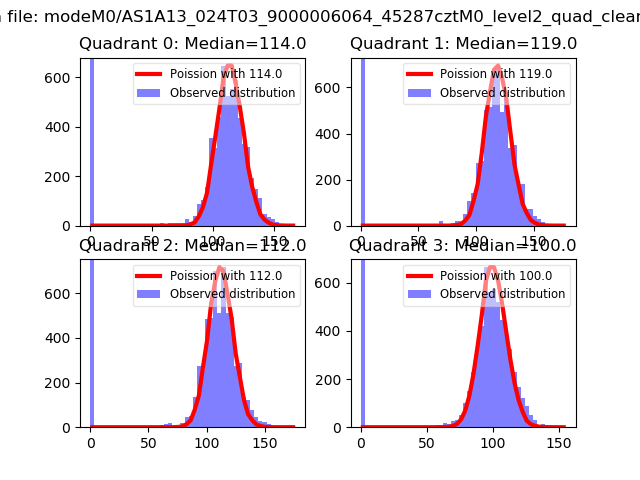 |
 |
| Quadrant-wise count rates Data is divided into 100 sec bins |
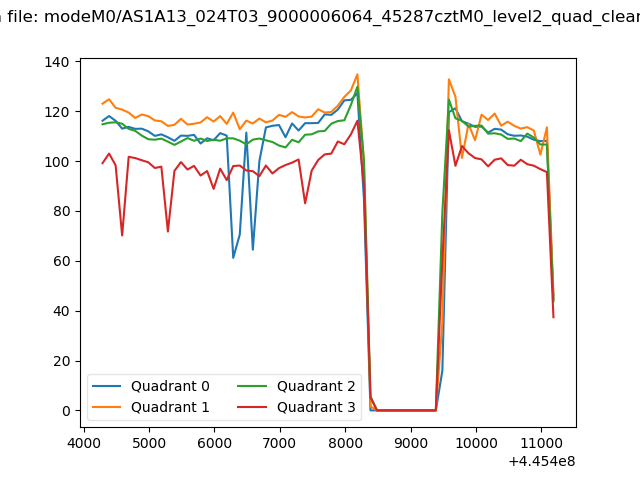 |
|
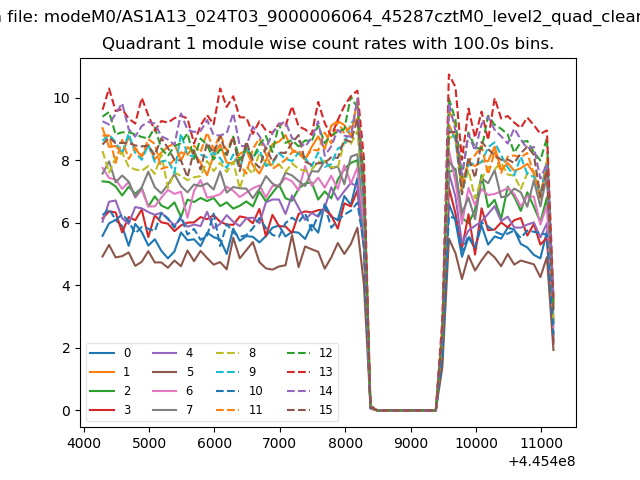
| Module-wise count rates for Quadrant A Data is divided into 100 sec bins |
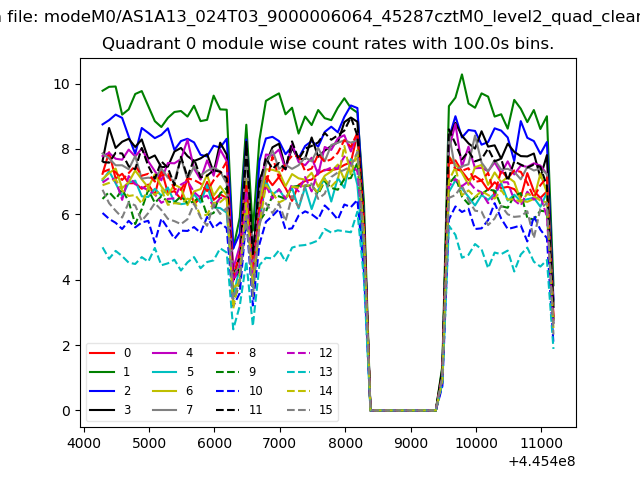 |
 |
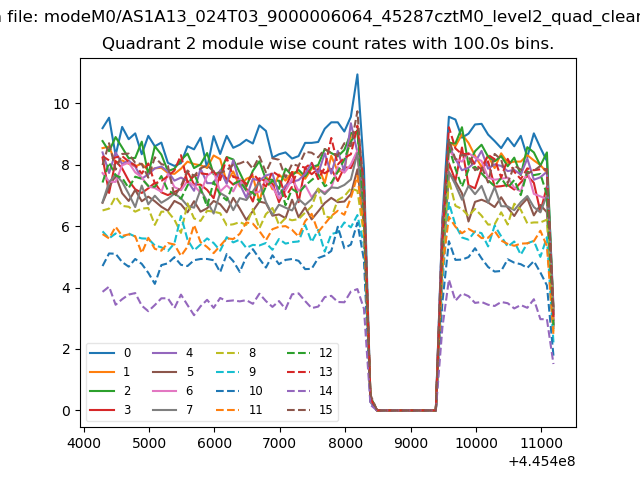
| Module-wise count rates for Quadrant B Data is divided into 100 sec bins |
 |
 |
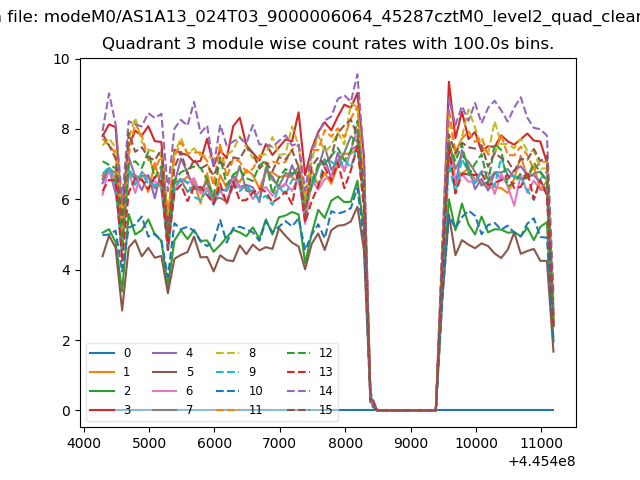
| Module-wise count rates for Quadrant C Data is divided into 100 sec bins |
 |
 |
| Module-wise count rates for Quadrant D Data is divided into 100 sec bins |
 |
 |
| Parameter | Plot |
|---|---|
| CZT HV Monitor | 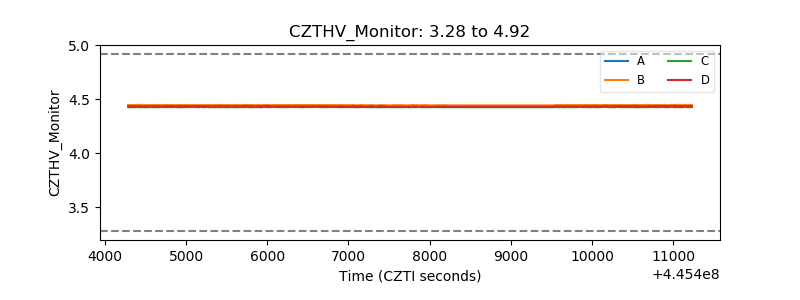 |
| D_VDD | 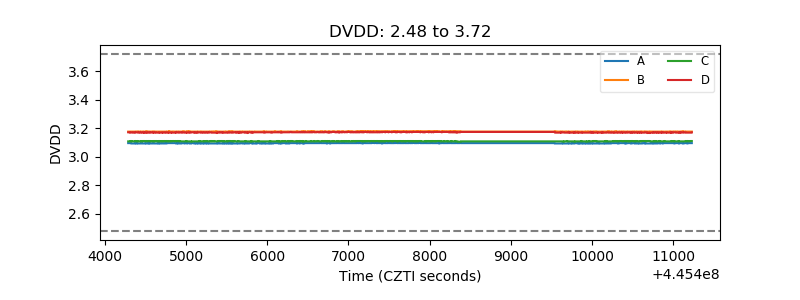 |
| Temperature 1 | 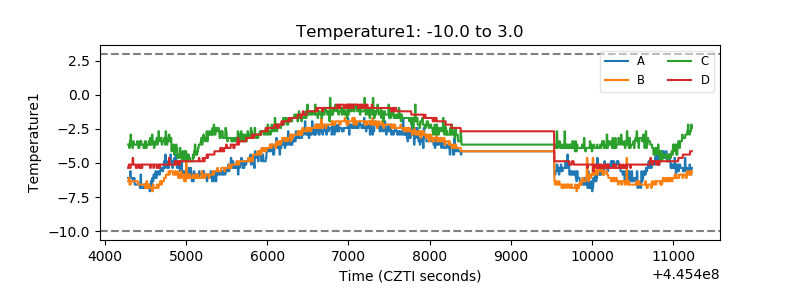 |
| Veto HV Monitor | 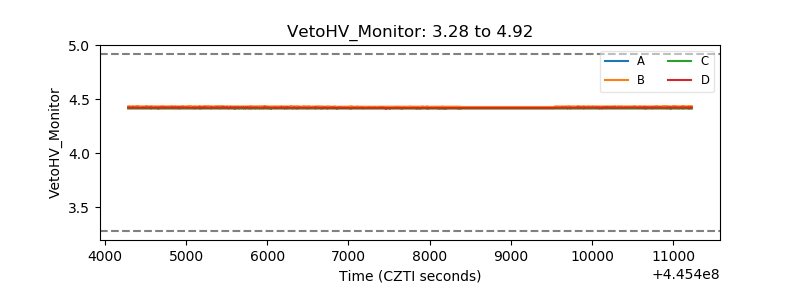 |
| Veto LLD | 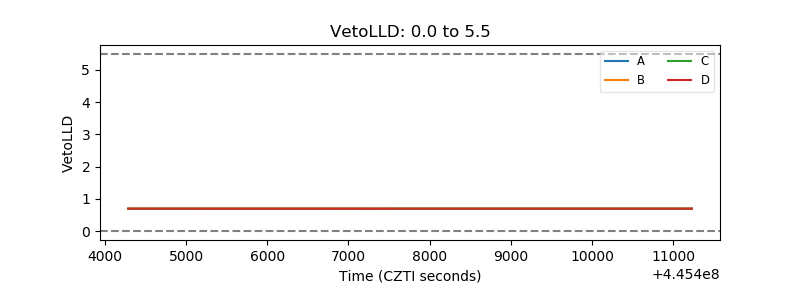 |
| Alpha Counter | 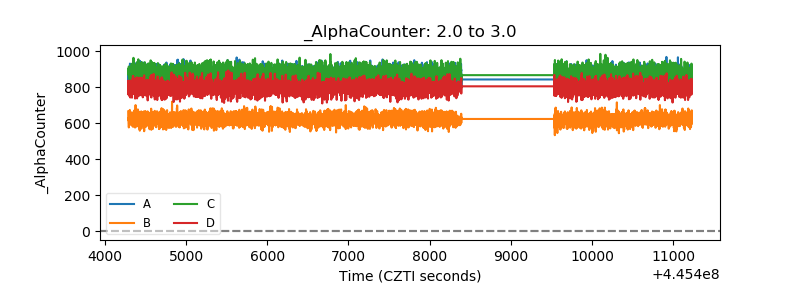 |
| _CPM_Rate | 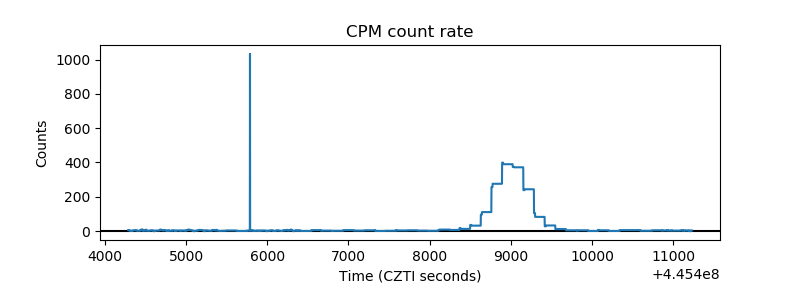 |
| CZT Counter |  |
| +2.5 Volts monitor | 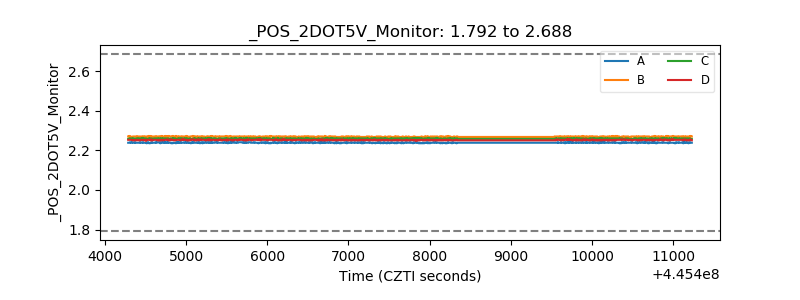 |
| +5 Volts monitor | 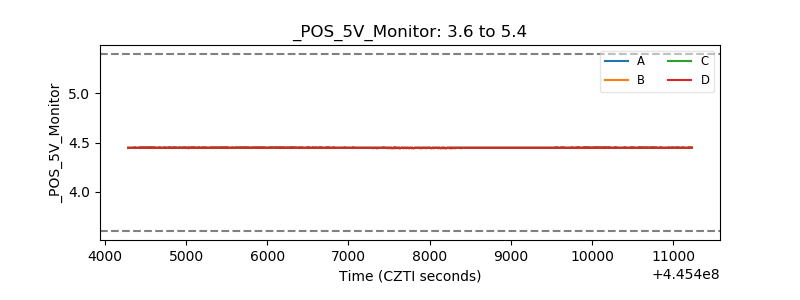 |
| _ROLL_ROT | 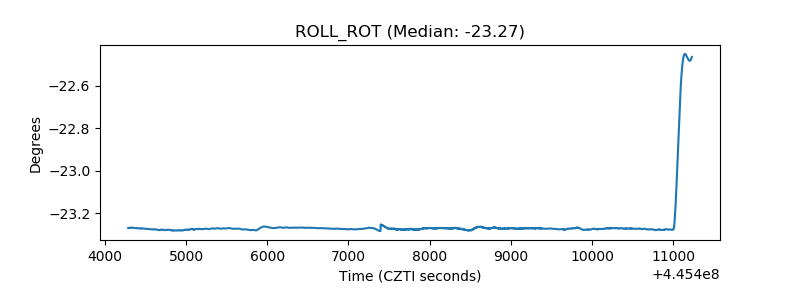 |
| _Roll_DEC | 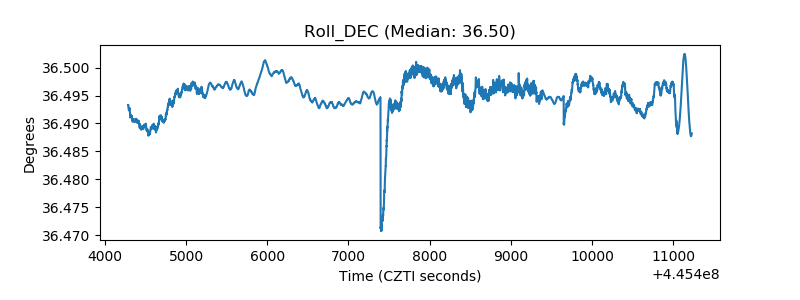 |
| _Roll_RA | 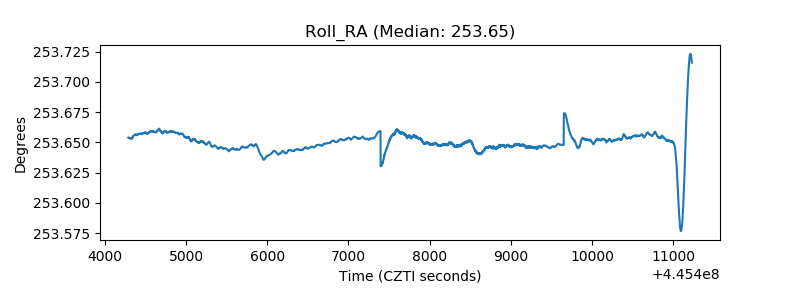 |
| Veto Counter | 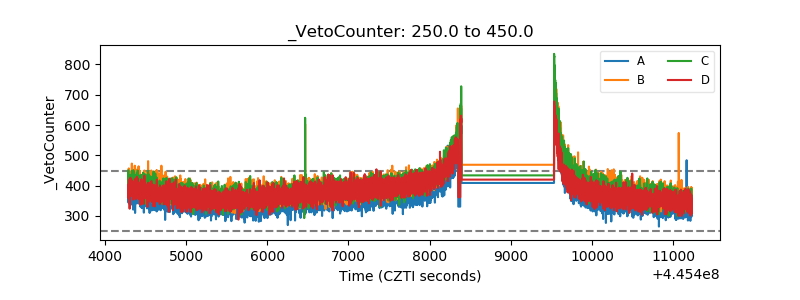 |