| Param | Original file | Final file |
|---|---|---|
| Filename | modeM0/AS1A13_024T03_9000006064_45288cztM0_level2.fits | modeM0/AS1A13_024T03_9000006064_45288cztM0_level2_quad_clean.evt |
| Size (bytes) | 436,250,880 | 102,528,000 |
| Size | 416.0 MB | 97.8 MB |
| Events in quadrant A | 5,565,424 | 671,037 |
| Events in quadrant B | 3,642,223 | 710,743 |
| Events in quadrant C | 2,923,363 | 676,661 |
| Events in quadrant D | 3,531,213 | 608,696 |
| Mode M0 | |||
|---|---|---|---|
| Quadrant | BADHDUFLAG | Total packets | Discarded packets |
| A | 0 | 21048 | 1 |
| B | 0 | 15323 | 1 |
| C | 0 | 13376 | 1 |
| D | 0 | 14921 | 3 |
| Mode SS | |||
|---|---|---|---|
| Quadrant | BADHDUFLAG | Total packets | Discarded packets |
| A | 0 | 128 | 0 |
| B | 0 | 128 | 0 |
| C | 0 | 128 | 0 |
| D | 0 | 128 | 0 |
| Mode M9 | |||
|---|---|---|---|
| Quadrant | BADHDUFLAG | Total packets | Discarded packets |
| A | 0 | 8 | 0 |
| B | 0 | 8 | 0 |
| C | 0 | 8 | 0 |
| D | 0 | 8 | 0 |
| Quadrant | Total seconds | Saturated seconds | Saturation percentage |
|---|---|---|---|
| A | 6263 | 262 | 4.183299% |
| B | 6264 | 147 | 2.346743% |
| C | 6264 | 47 | 0.750319% |
| D | 6263 | 113 | 1.804247% |
Noise dominated data is calculated using 1-second bins in cleaned event files. If a bin has >2000 counts, and if more than 50% of those come from <1% of pixels, then it is considered to be noise-dominated and hence unusable.
| Quadrant | # 1 sec bins | Bins with >0 counts | Bins with >2000 counts | High rate bins dominated by noise | Noise dominated (total time) | Noise dominated (detector-on time) | Marked lightcurve |
|---|---|---|---|---|---|---|---|
| A | 7118 | 6263 | 149 | 149 | 2.09% | 2.38% | 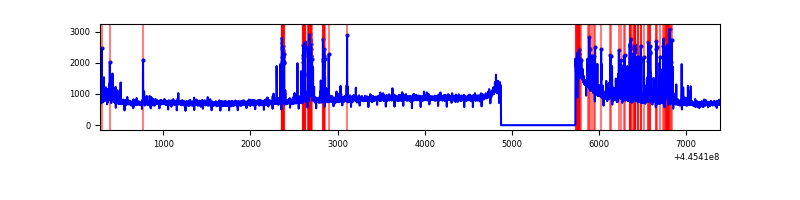 |
| B | 7119 | 6264 | 50 | 50 | 0.70% | 0.80% | 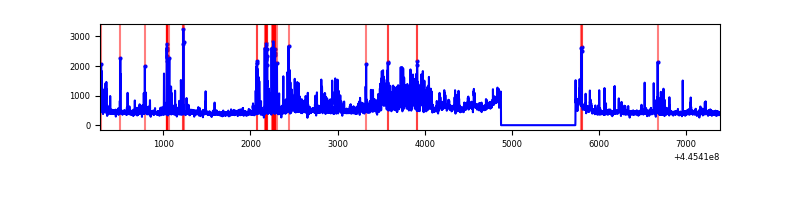 |
| C | 7119 | 6265 | 29 | 29 | 0.41% | 0.46% | 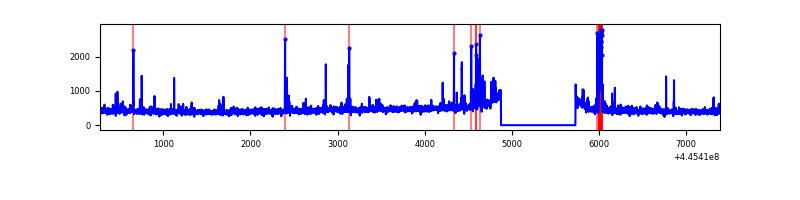 |
| D | 7118 | 6264 | 76 | 76 | 1.07% | 1.21% | 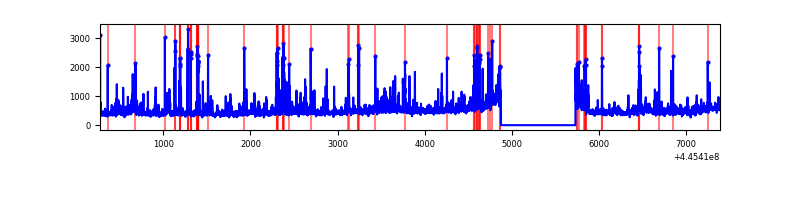 |
Top three noisy pixels from each quadrant. If the there are fewer than three noisy pixels in the level2.evt file, extra rows are filled as -1
| Pixel properties | Quadrant properties | ||||||
|---|---|---|---|---|---|---|---|
| Quadrant | DetID | PixID | Counts | Sigma | Mean | Median | Sigma |
| A | 10 | 83 | 2284025 | 15808.55 | 695 | 681 | 144.4 |
| A | 13 | 248 | 533194 | 3686.81 | 695 | 681 | 144.4 |
| A | 10 | 248 | 51647 | 352.86 | 695 | 681 | 144.4 |
| B | 4 | 170 | 261362 | 1880.04 | 699 | 678 | 138.7 |
| B | 5 | 32 | 142677 | 1024.09 | 699 | 678 | 138.7 |
| B | 3 | 112 | 103272 | 739.9 | 699 | 678 | 138.7 |
| C | 14 | 254 | 173214 | 1063.29 | 685 | 690 | 162.3 |
| C | 3 | 233 | 48004 | 291.6 | 685 | 690 | 162.3 |
| C | 12 | 249 | 21120 | 125.91 | 685 | 690 | 162.3 |
| D | 2 | 249 | 274041 | 1602.17 | 677 | 655 | 170.6 |
| D | 13 | 249 | 172936 | 1009.65 | 677 | 655 | 170.6 |
| D | 9 | 49 | 153541 | 895.99 | 677 | 655 | 170.6 |
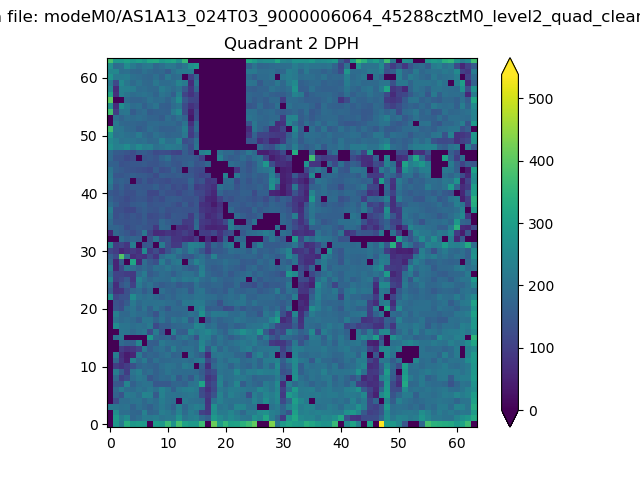
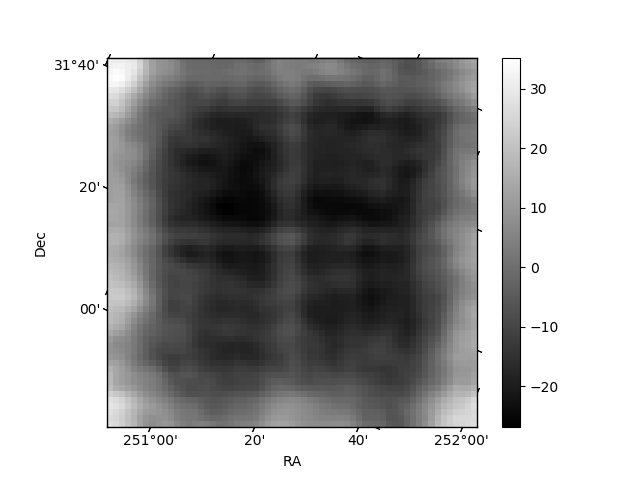
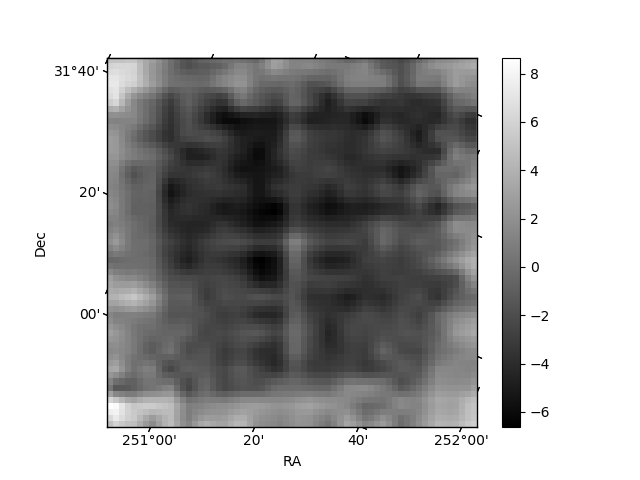
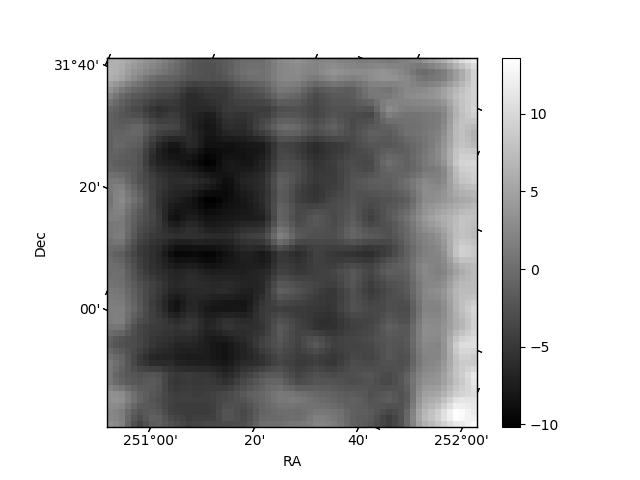
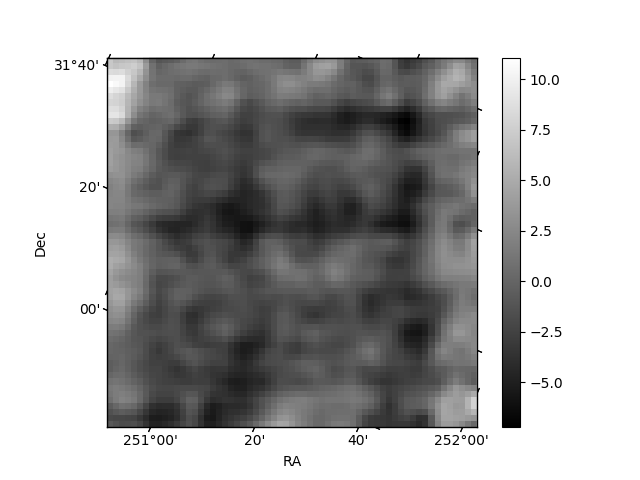
Histogram calculated using DETX and DETY for each event in the final _common_clean file
| Quadrant A | 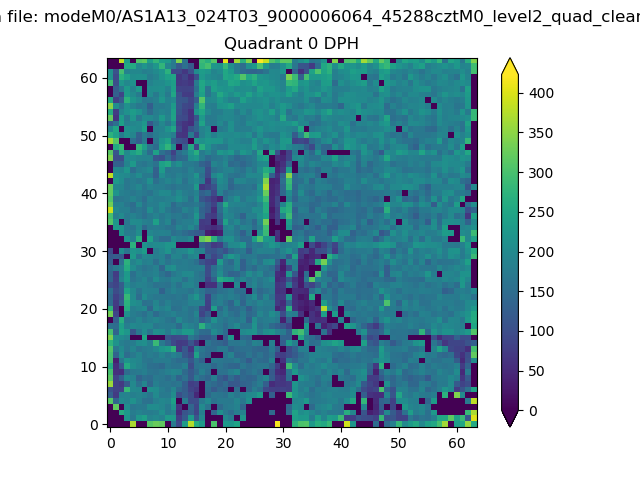 |
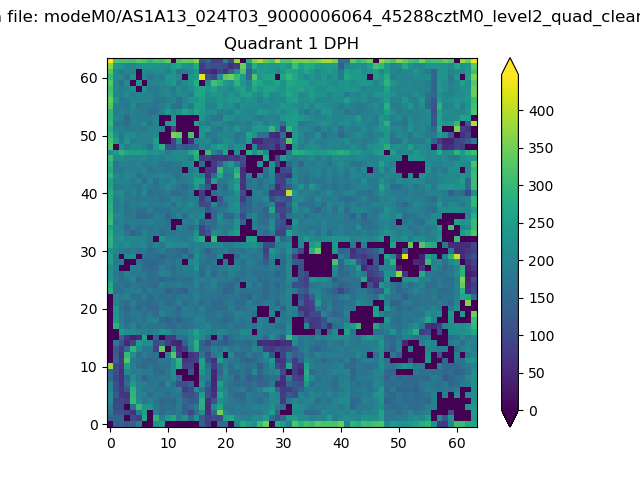 |
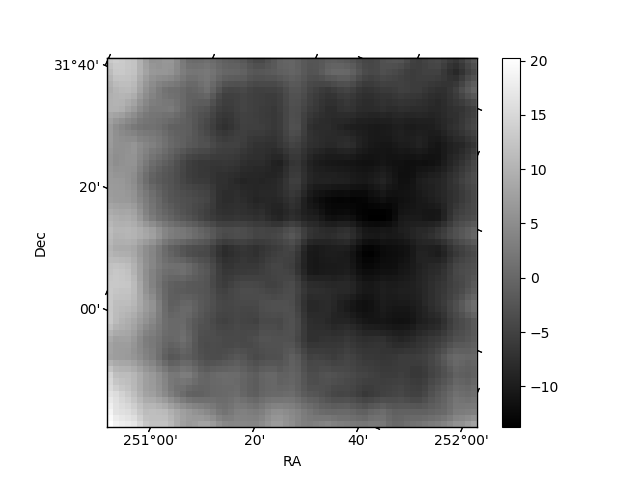
Quadrant B |
|---|---|---|---|
| Quadrant D | 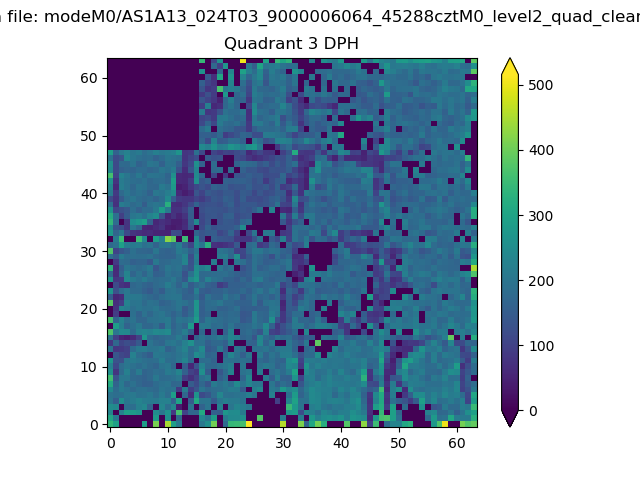 |
 |
Quadrant C |
| Plot type | Count rate plots | Images |
|---|---|---|
| Comparison with Poisson distribution Blue bars denote a histogram of data divided into 1 sec bins. Red curve is a Poisson curve with rate = median count rate of data. |
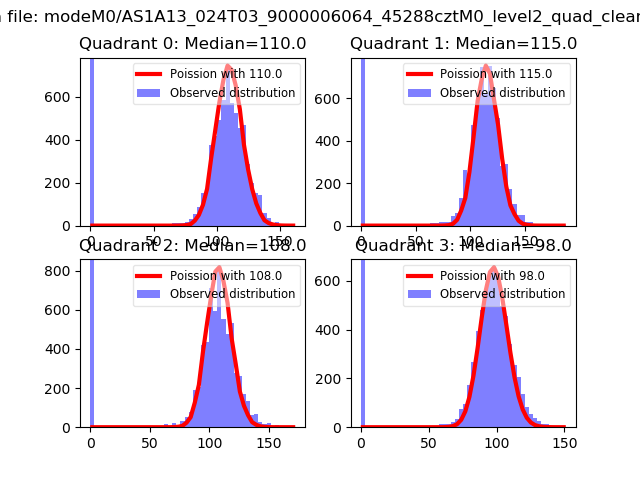 |
 |
| Quadrant-wise count rates Data is divided into 100 sec bins |
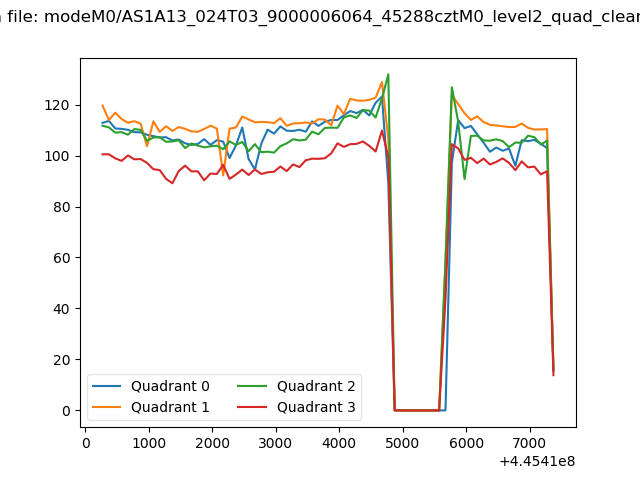 |
|
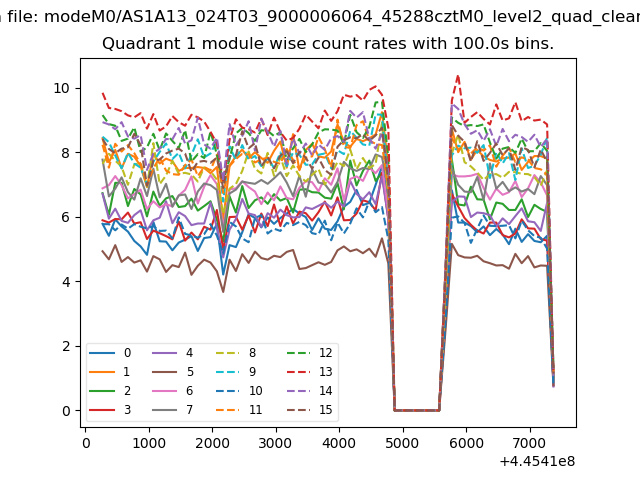
| Module-wise count rates for Quadrant A Data is divided into 100 sec bins |
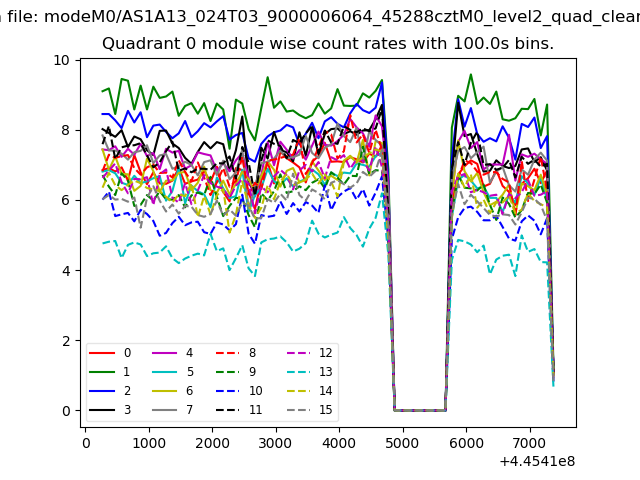 |
 |
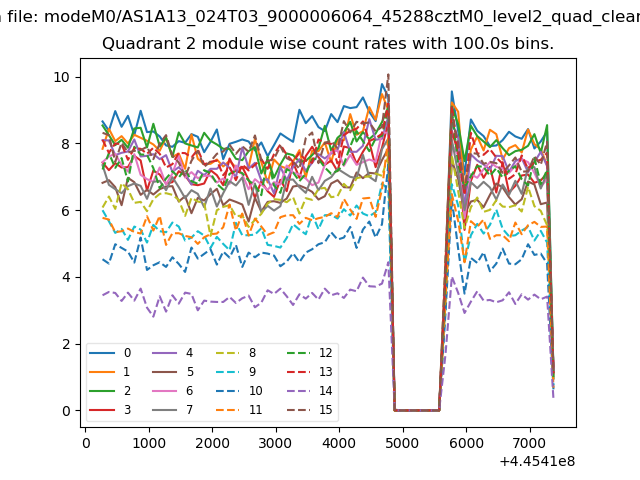
| Module-wise count rates for Quadrant B Data is divided into 100 sec bins |
 |
 |
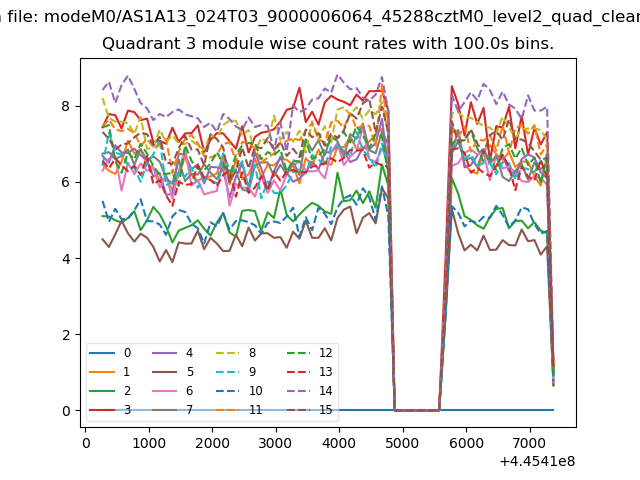
| Module-wise count rates for Quadrant C Data is divided into 100 sec bins |
 |
 |
| Module-wise count rates for Quadrant D Data is divided into 100 sec bins |
 |
 |
| Parameter | Plot |
|---|---|
| CZT HV Monitor | 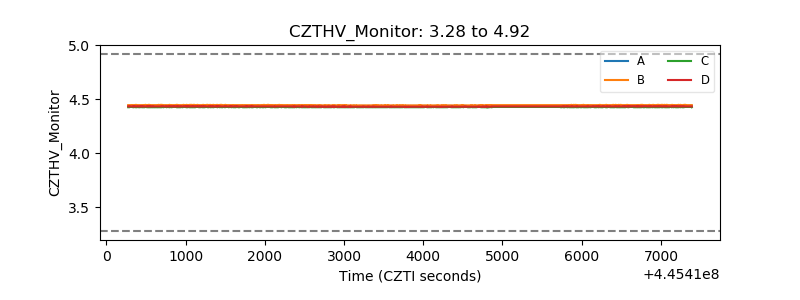 |
| D_VDD | 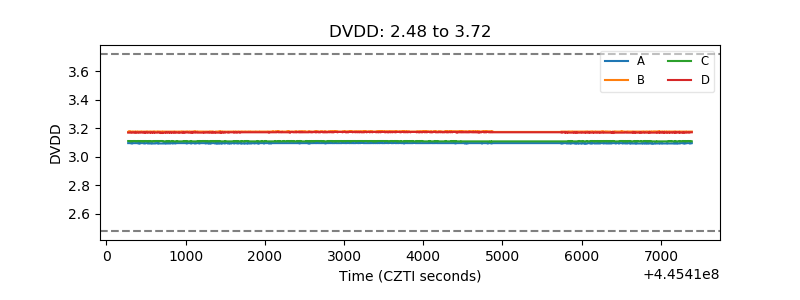 |
| Temperature 1 | 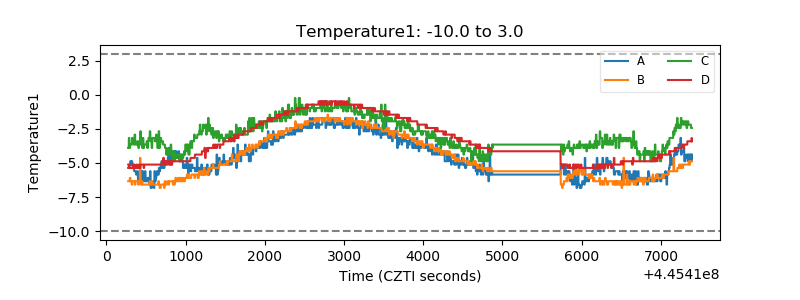 |
| Veto HV Monitor | 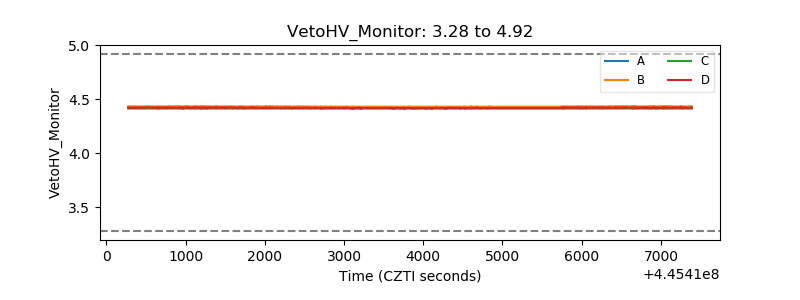 |
| Veto LLD | 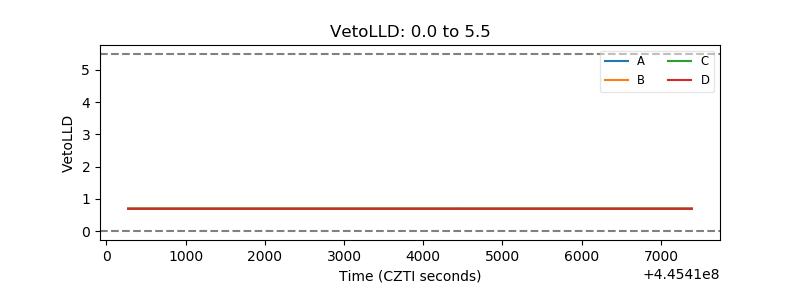 |
| Alpha Counter | 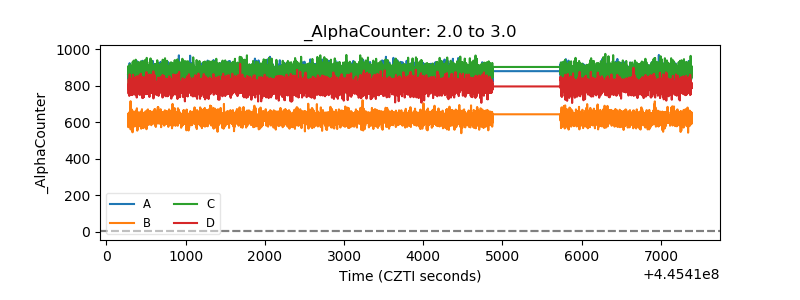 |
| _CPM_Rate | 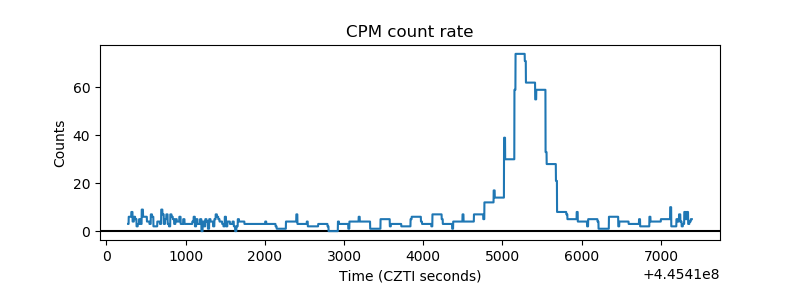 |
| CZT Counter | 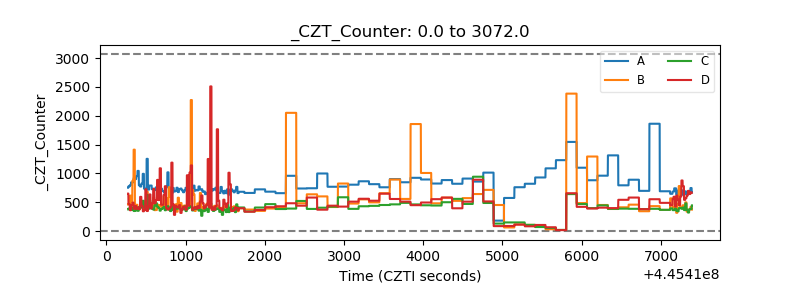 |
| +2.5 Volts monitor | 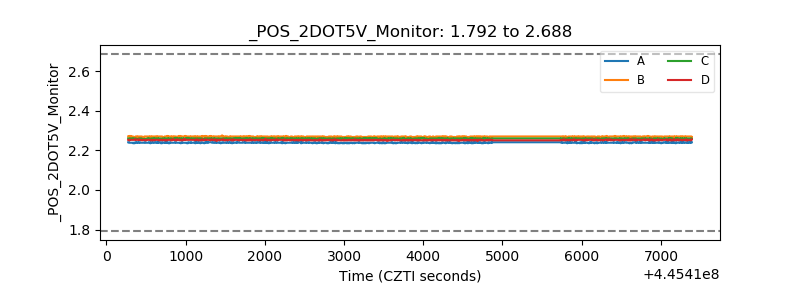 |
| +5 Volts monitor | 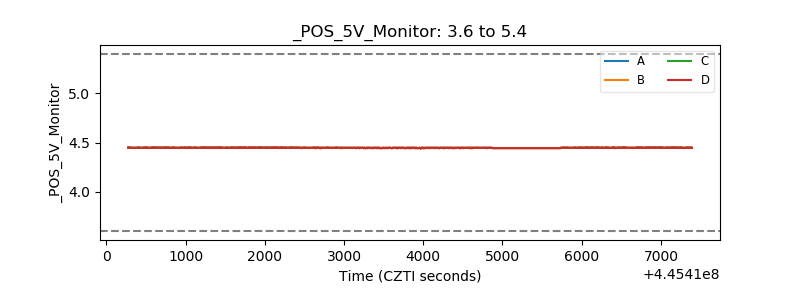 |
| _ROLL_ROT | 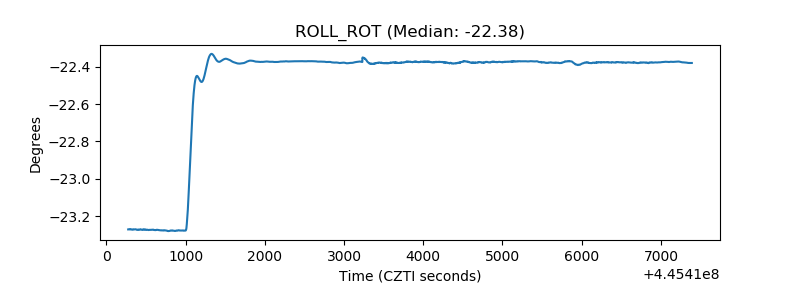 |
| _Roll_DEC | 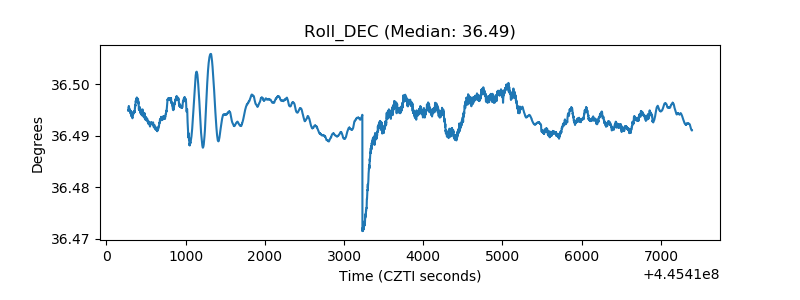 |
| _Roll_RA | 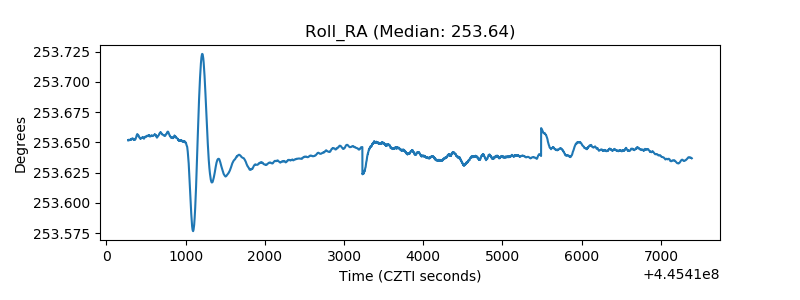 |
| Veto Counter | 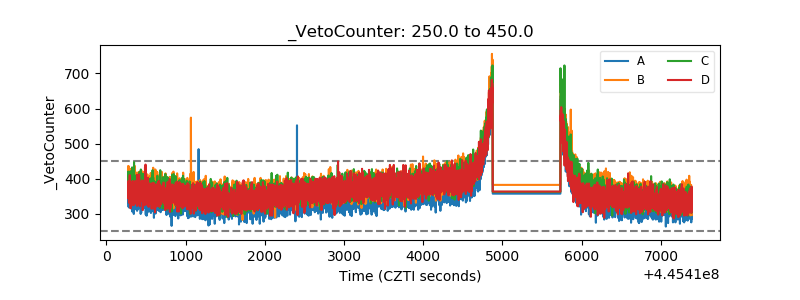 |