| Param | Original file | Final file |
|---|---|---|
| Filename | modeM0/AS1A13_024T03_9000006064_45289cztM0_level2.fits | modeM0/AS1A13_024T03_9000006064_45289cztM0_level2_quad_clean.evt |
| Size (bytes) | 483,042,240 | 111,916,800 |
| Size | 460.7 MB | 106.7 MB |
| Events in quadrant A | 5,817,279 | 727,936 |
| Events in quadrant B | 3,887,916 | 769,084 |
| Events in quadrant C | 3,221,580 | 747,000 |
| Events in quadrant D | 4,407,630 | 654,546 |
| Mode M0 | |||
|---|---|---|---|
| Quadrant | BADHDUFLAG | Total packets | Discarded packets |
| A | 0 | 22306 | 3 |
| B | 0 | 16503 | 2 |
| C | 0 | 14834 | 2 |
| D | 0 | 17983 | 2 |
| Mode SS | |||
|---|---|---|---|
| Quadrant | BADHDUFLAG | Total packets | Discarded packets |
| A | 0 | 144 | 0 |
| B | 0 | 144 | 0 |
| C | 0 | 144 | 0 |
| D | 0 | 144 | 0 |
| Mode M9 | |||
|---|---|---|---|
| Quadrant | BADHDUFLAG | Total packets | Discarded packets |
| A | 0 | 1 | 0 |
| B | 0 | 1 | 0 |
| C | 0 | 1 | 0 |
| D | 0 | 1 | 0 |
| Quadrant | Total seconds | Saturated seconds | Saturation percentage |
|---|---|---|---|
| A | 7029 | 354 | 5.036278% |
| B | 7029 | 297 | 4.225352% |
| C | 7030 | 115 | 1.635846% |
| D | 7030 | 369 | 5.248933% |
Noise dominated data is calculated using 1-second bins in cleaned event files. If a bin has >2000 counts, and if more than 50% of those come from <1% of pixels, then it is considered to be noise-dominated and hence unusable.
| Quadrant | # 1 sec bins | Bins with >0 counts | Bins with >2000 counts | High rate bins dominated by noise | Noise dominated (total time) | Noise dominated (detector-on time) | Marked lightcurve |
|---|---|---|---|---|---|---|---|
| A | 7169 | 7030 | 58 | 58 | 0.81% | 0.83% | 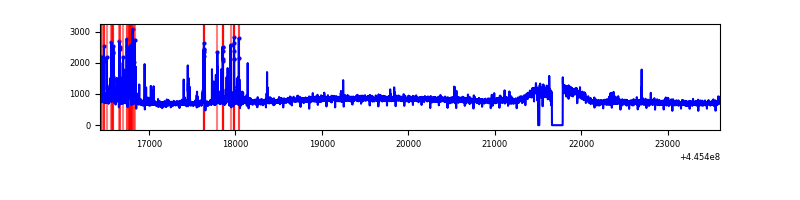 |
| B | 7169 | 7029 | 45 | 45 | 0.63% | 0.64% | 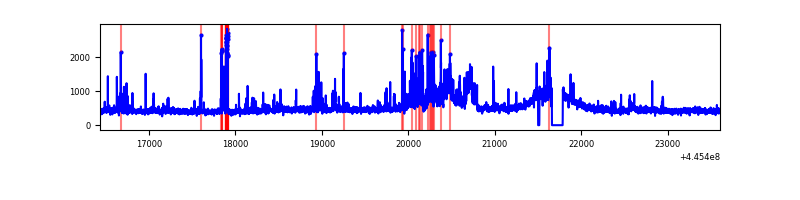 |
| C | 7170 | 7031 | 7 | 7 | 0.10% | 0.10% | 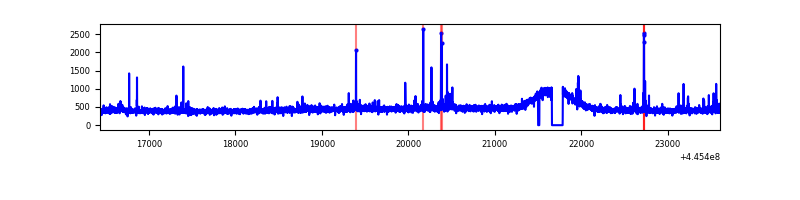 |
| D | 7170 | 7031 | 216 | 216 | 3.01% | 3.07% | 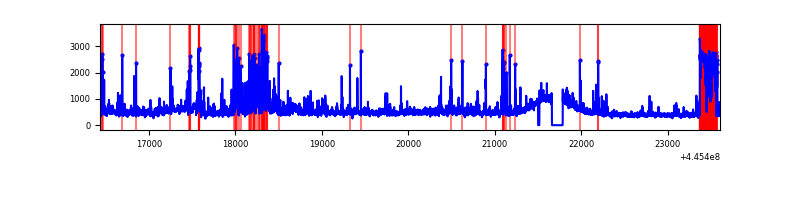 |
Top three noisy pixels from each quadrant. If the there are fewer than three noisy pixels in the level2.evt file, extra rows are filled as -1
| Pixel properties | Quadrant properties | ||||||
|---|---|---|---|---|---|---|---|
| Quadrant | DetID | PixID | Counts | Sigma | Mean | Median | Sigma |
| A | 10 | 83 | 2367620 | 14150.77 | 802 | 782 | 167.3 |
| A | 13 | 248 | 266293 | 1587.43 | 802 | 782 | 167.3 |
| A | 10 | 248 | 73573 | 435.2 | 802 | 782 | 167.3 |
| B | 0 | 189 | 431476 | 2689.74 | 801 | 776 | 160.1 |
| B | 5 | 172 | 80619 | 498.62 | 801 | 776 | 160.1 |
| B | 5 | 32 | 60947 | 375.77 | 801 | 776 | 160.1 |
| C | 14 | 254 | 60766 | 320.1 | 793 | 795 | 187.3 |
| C | 2 | 14 | 31526 | 164.03 | 793 | 795 | 187.3 |
| C | 3 | 233 | 30054 | 156.17 | 793 | 795 | 187.3 |
| D | 2 | 249 | 676126 | 3386.25 | 782 | 756 | 199.4 |
| D | 9 | 49 | 363148 | 1817.01 | 782 | 756 | 199.4 |
| D | 13 | 171 | 94597 | 470.51 | 782 | 756 | 199.4 |
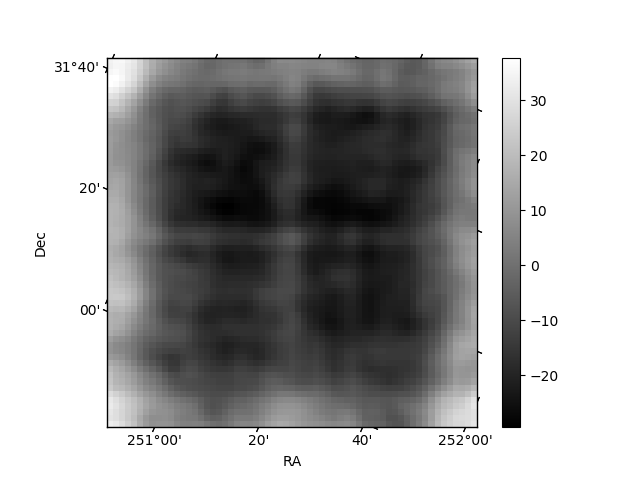
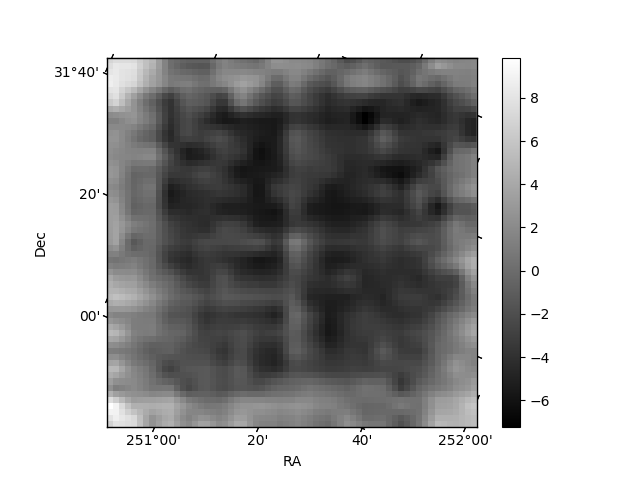
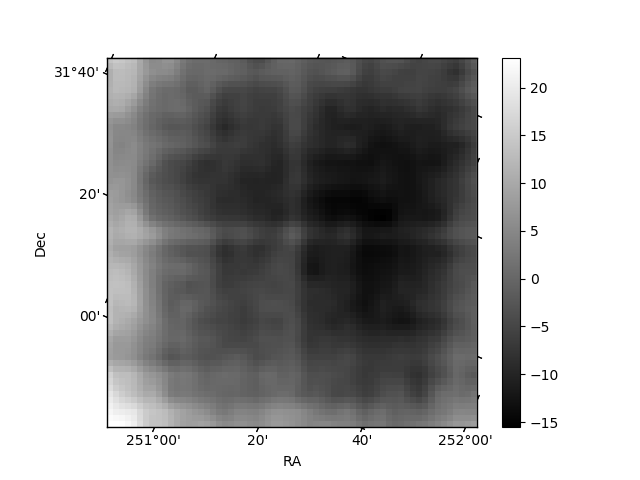
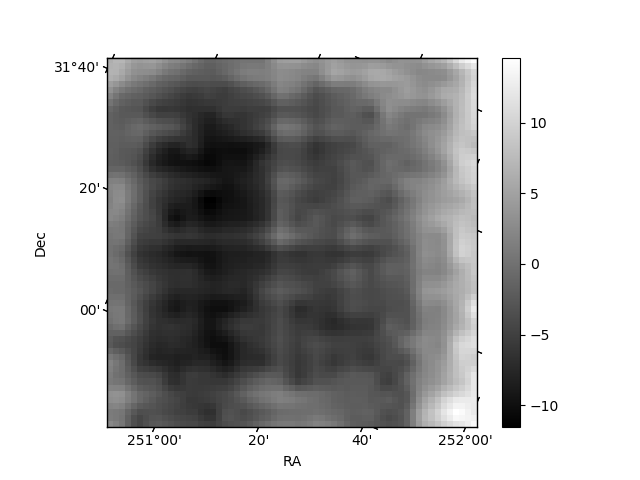
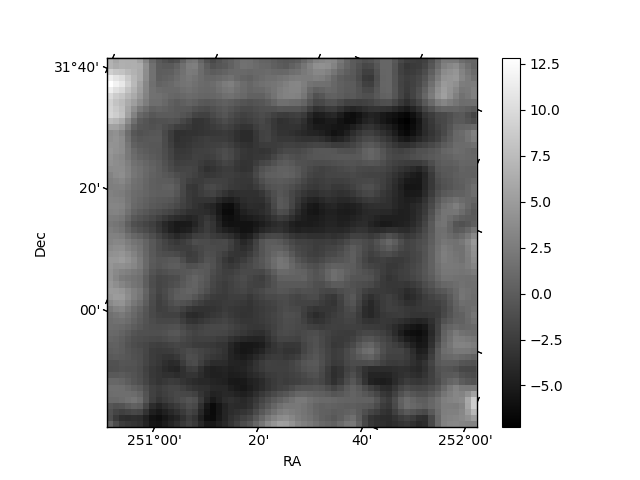
Histogram calculated using DETX and DETY for each event in the final _common_clean file
| Quadrant A | 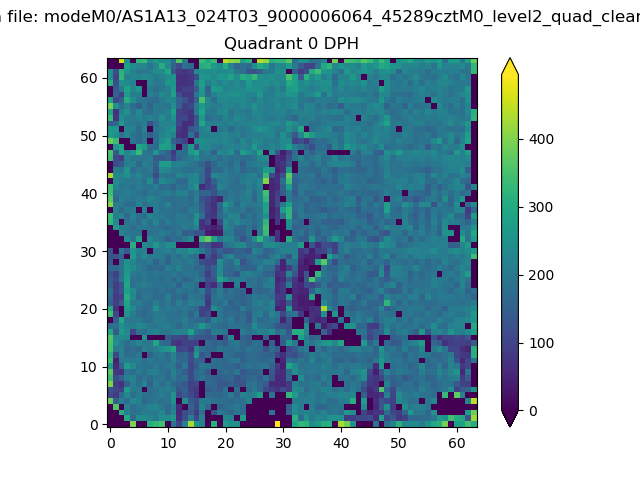 |
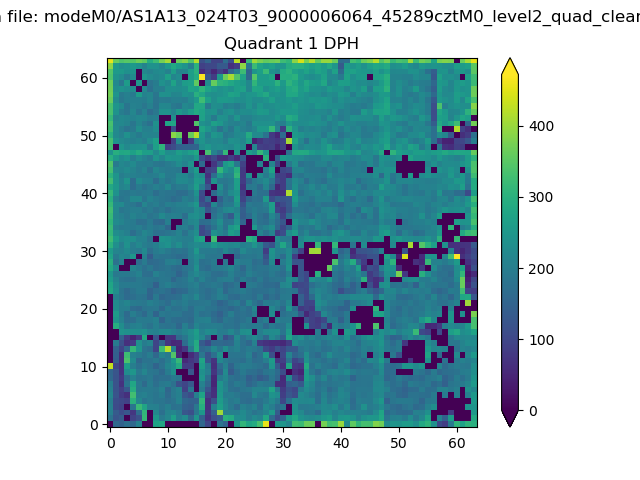 |
Quadrant B |
|---|---|---|---|
| Quadrant D | 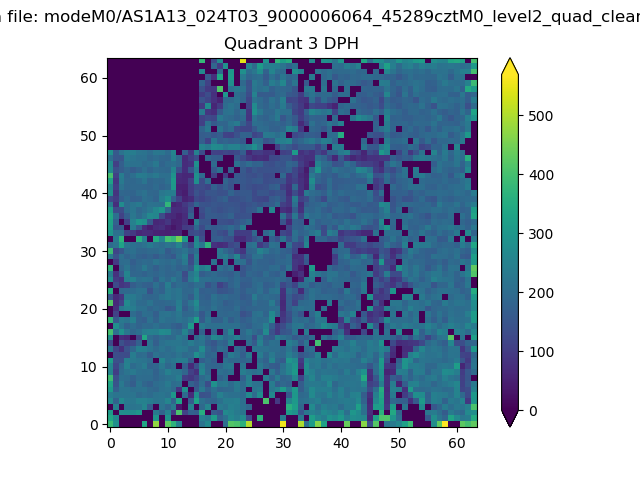 |
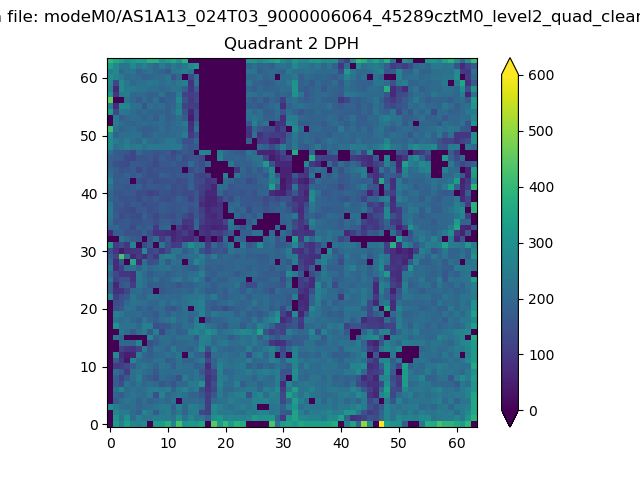 |
Quadrant C |
| Plot type | Count rate plots | Images |
|---|---|---|
| Comparison with Poisson distribution Blue bars denote a histogram of data divided into 1 sec bins. Red curve is a Poisson curve with rate = median count rate of data. |
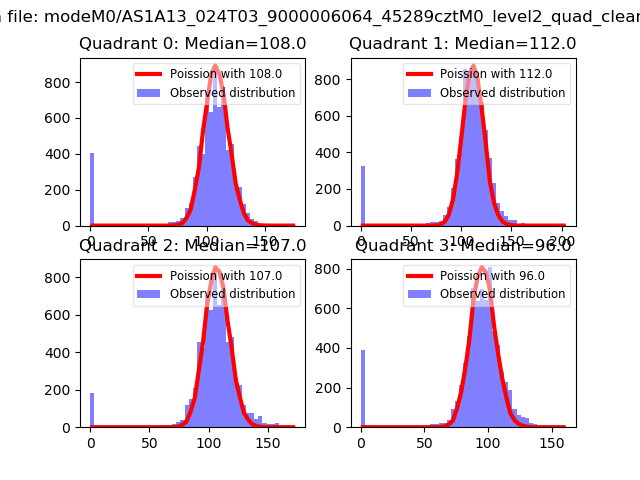 |
 |
| Quadrant-wise count rates Data is divided into 100 sec bins |
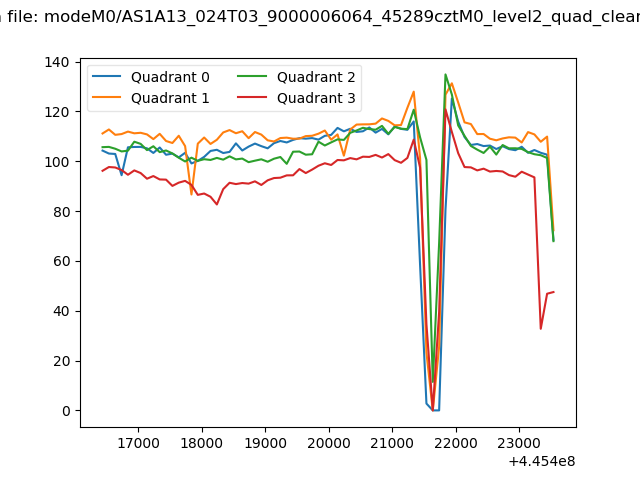 |
|
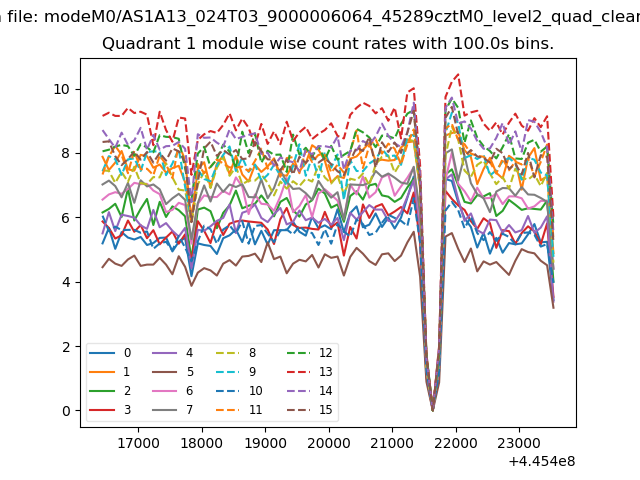
| Module-wise count rates for Quadrant A Data is divided into 100 sec bins |
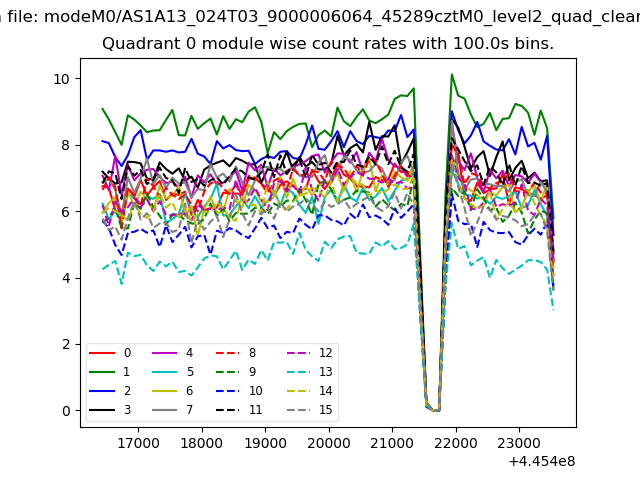 |
 |
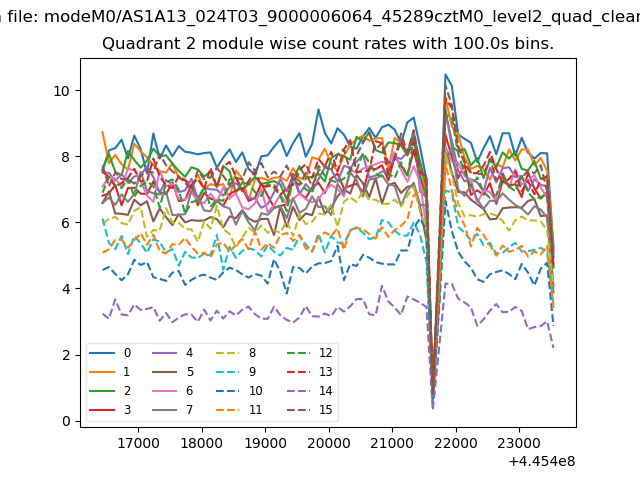
| Module-wise count rates for Quadrant B Data is divided into 100 sec bins |
 |
 |
| Module-wise count rates for Quadrant C Data is divided into 100 sec bins |
 |
 |
| Module-wise count rates for Quadrant D Data is divided into 100 sec bins |
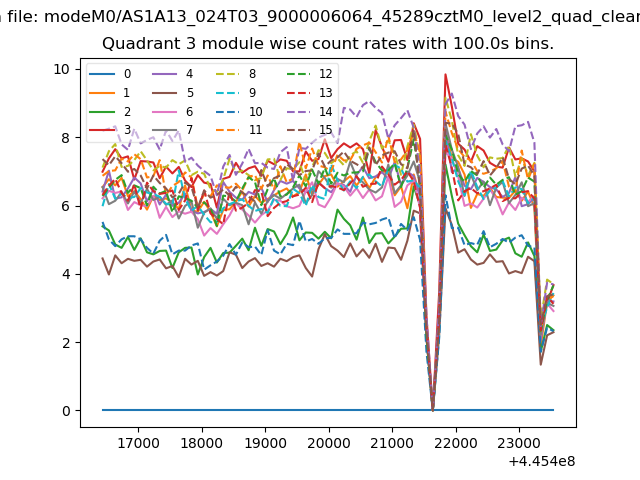 |
 |
| Parameter | Plot |
|---|---|
| CZT HV Monitor | 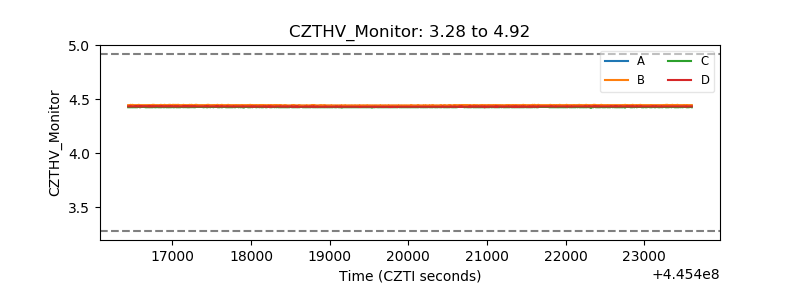 |
| D_VDD | 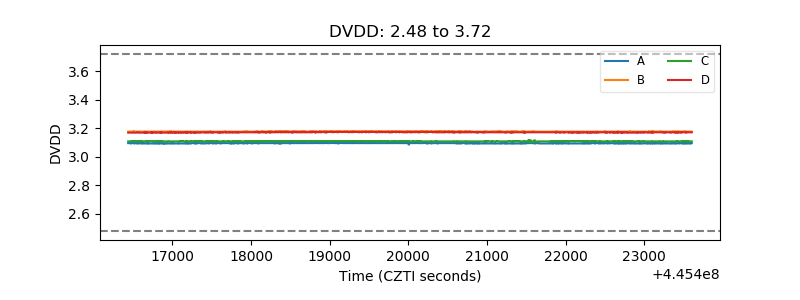 |
| Temperature 1 | 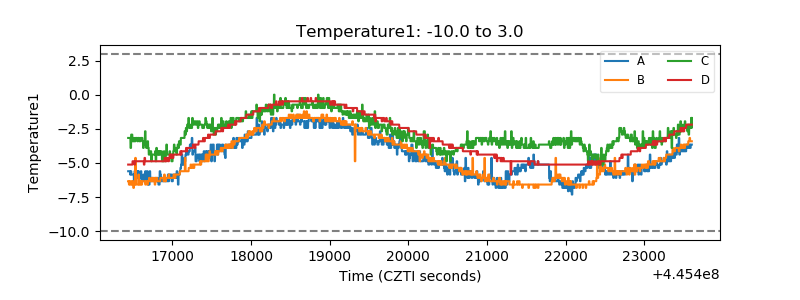 |
| Veto HV Monitor | 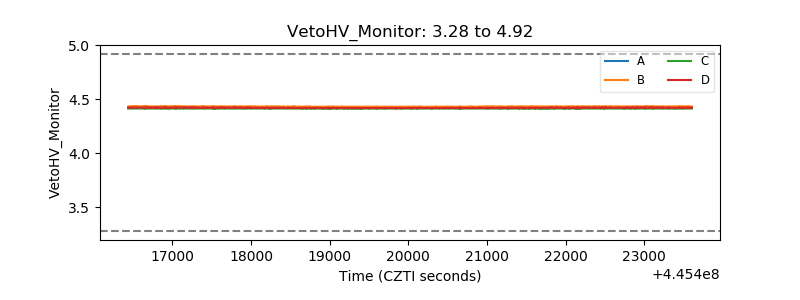 |
| Veto LLD | 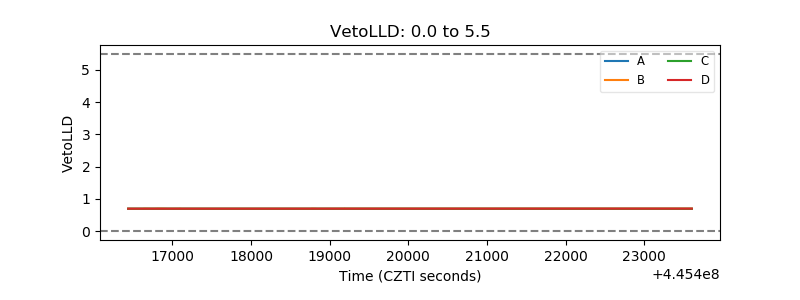 |
| Alpha Counter | 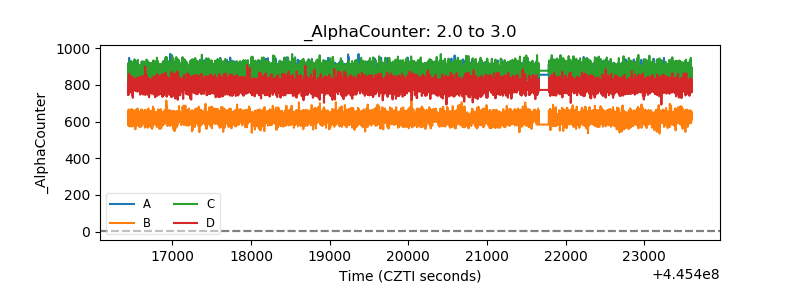 |
| _CPM_Rate | 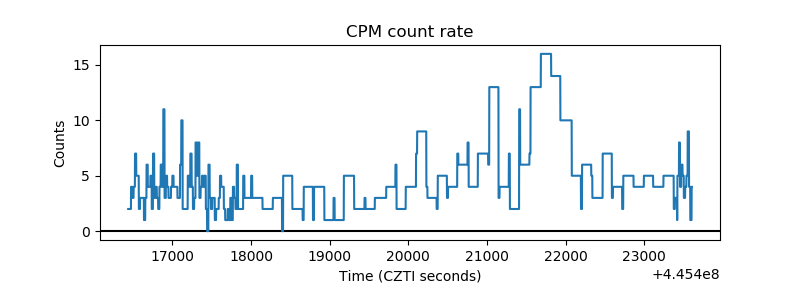 |
| CZT Counter | 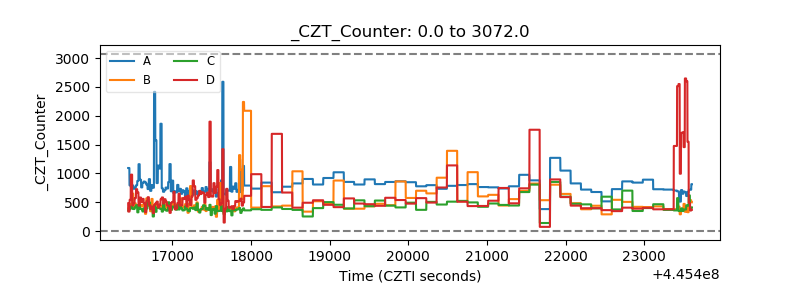 |
| +2.5 Volts monitor | 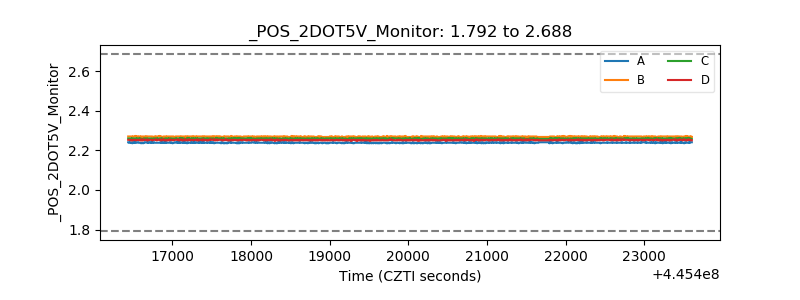 |
| +5 Volts monitor | 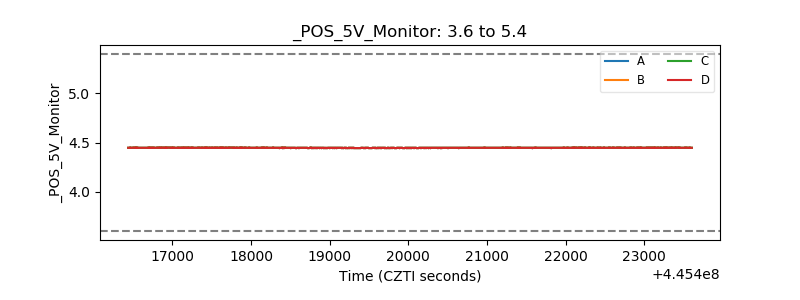 |
| _ROLL_ROT | 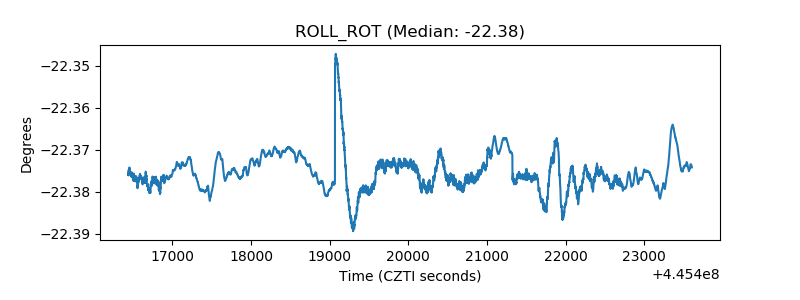 |
| _Roll_DEC | 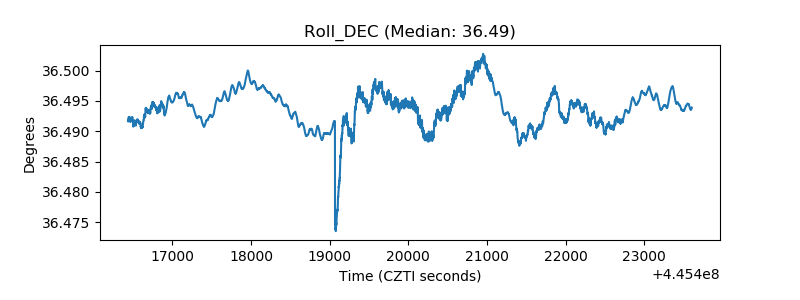 |
| _Roll_RA | 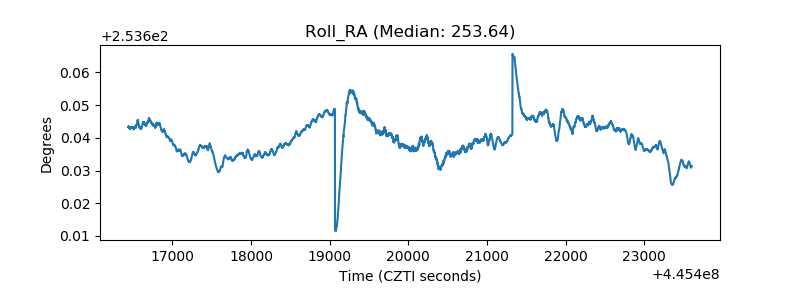 |
| Veto Counter | 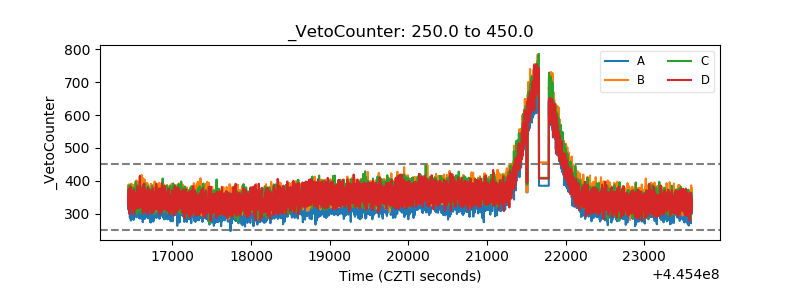 |