| Param | Original file | Final file |
|---|---|---|
| Filename | modeM0/AS1A13_024T03_9000006064_45290cztM0_level2.fits | modeM0/AS1A13_024T03_9000006064_45290cztM0_level2_quad_clean.evt |
| Size (bytes) | 615,219,840 | 113,722,560 |
| Size | 586.7 MB | 108.5 MB |
| Events in quadrant A | 5,987,821 | 781,915 |
| Events in quadrant B | 3,624,140 | 816,672 |
| Events in quadrant C | 3,810,396 | 766,863 |
| Events in quadrant D | 8,777,452 | 562,778 |
| Mode M0 | |||
|---|---|---|---|
| Quadrant | BADHDUFLAG | Total packets | Discarded packets |
| A | 0 | 23027 | 0 |
| B | 0 | 15787 | 0 |
| C | 0 | 16732 | 0 |
| D | 0 | 31348 | 0 |
| Mode SS | |||
|---|---|---|---|
| Quadrant | BADHDUFLAG | Total packets | Discarded packets |
| A | 0 | 148 | 0 |
| B | 0 | 148 | 0 |
| C | 0 | 148 | 0 |
| D | 0 | 148 | 0 |
| Quadrant | Total seconds | Saturated seconds | Saturation percentage |
|---|---|---|---|
| A | 7399 | 112 | 1.513718% |
| B | 7400 | 47 | 0.635135% |
| C | 7400 | 110 | 1.486486% |
| D | 7400 | 1661 | 22.445946% |
Noise dominated data is calculated using 1-second bins in cleaned event files. If a bin has >2000 counts, and if more than 50% of those come from <1% of pixels, then it is considered to be noise-dominated and hence unusable.
| Quadrant | # 1 sec bins | Bins with >0 counts | Bins with >2000 counts | High rate bins dominated by noise | Noise dominated (total time) | Noise dominated (detector-on time) | Marked lightcurve |
|---|---|---|---|---|---|---|---|
| A | 7399 | 7399 | 81 | 81 | 1.09% | 1.09% | 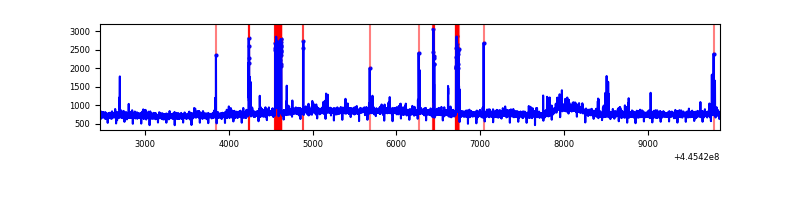 |
| B | 7400 | 7400 | 30 | 30 | 0.41% | 0.41% | 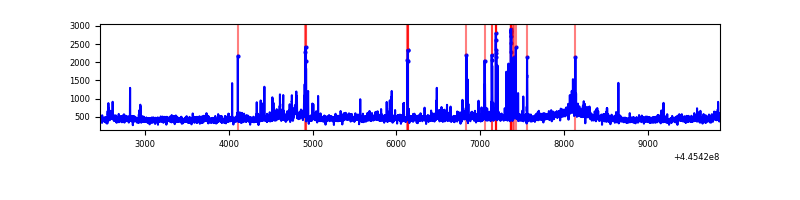 |
| C | 7400 | 7400 | 93 | 93 | 1.26% | 1.26% | 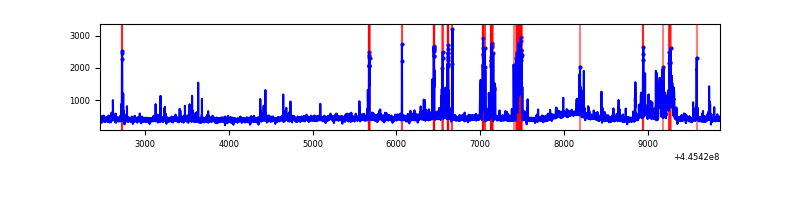 |
| D | 7400 | 7400 | 1712 | 1712 | 23.14% | 23.14% | 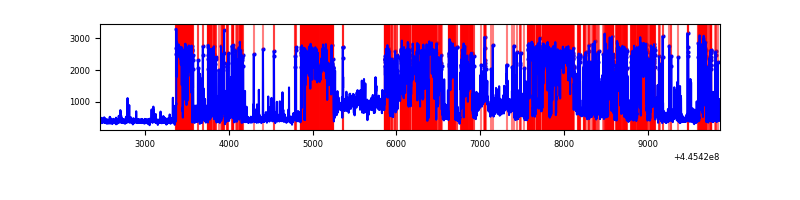 |
Top three noisy pixels from each quadrant. If the there are fewer than three noisy pixels in the level2.evt file, extra rows are filled as -1
| Pixel properties | Quadrant properties | ||||||
|---|---|---|---|---|---|---|---|
| Quadrant | DetID | PixID | Counts | Sigma | Mean | Median | Sigma |
| A | 10 | 83 | 2550389 | 15125.06 | 809 | 792 | 168.6 |
| A | 13 | 248 | 245756 | 1453.21 | 809 | 792 | 168.6 |
| A | 15 | 174 | 51358 | 299.97 | 809 | 792 | 168.6 |
| B | 5 | 32 | 83350 | 515.51 | 812 | 787 | 160.2 |
| B | 5 | 172 | 66039 | 407.43 | 812 | 787 | 160.2 |
| B | 3 | 112 | 65298 | 402.8 | 812 | 787 | 160.2 |
| C | 14 | 254 | 528572 | 2834.86 | 788 | 791 | 186.2 |
| C | 3 | 233 | 119762 | 639.03 | 788 | 791 | 186.2 |
| C | 2 | 14 | 56378 | 298.57 | 788 | 791 | 186.2 |
| D | 2 | 249 | 2893660 | 15922.84 | 719 | 696 | 181.7 |
| D | 5 | 222 | 2247492 | 12366.34 | 719 | 696 | 181.7 |
| D | 13 | 249 | 559332 | 3074.73 | 719 | 696 | 181.7 |
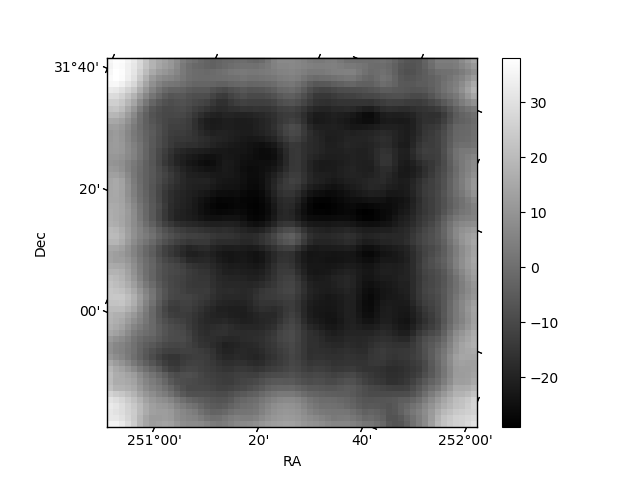
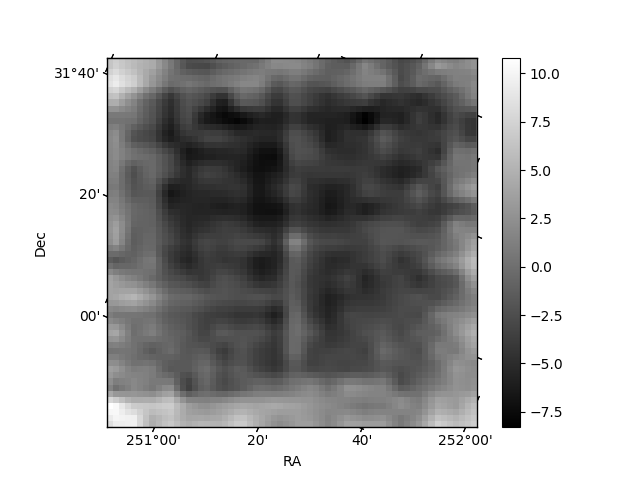
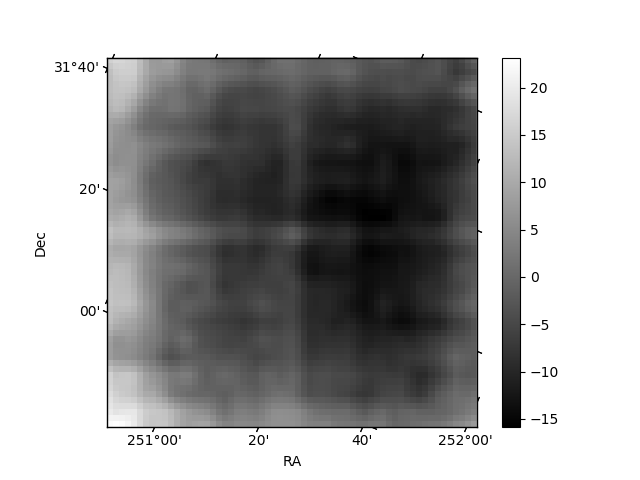
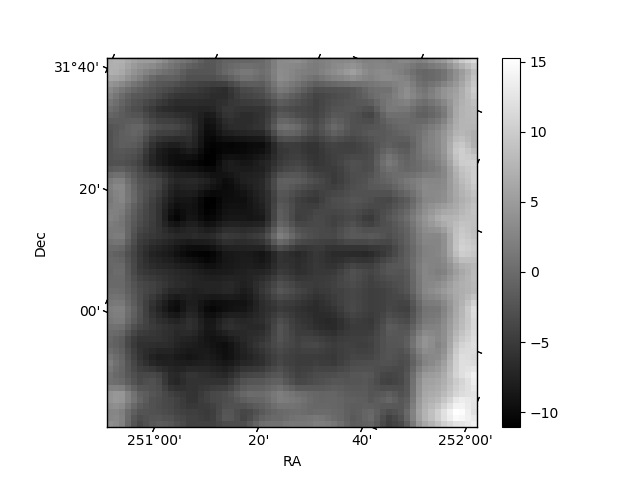
Histogram calculated using DETX and DETY for each event in the final _common_clean file
| Quadrant A | 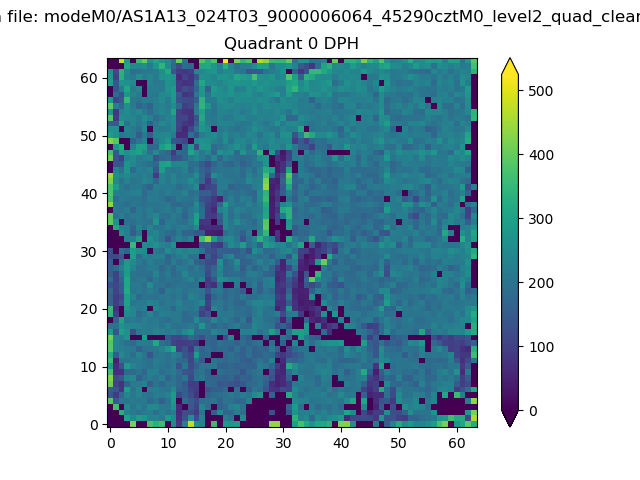 |
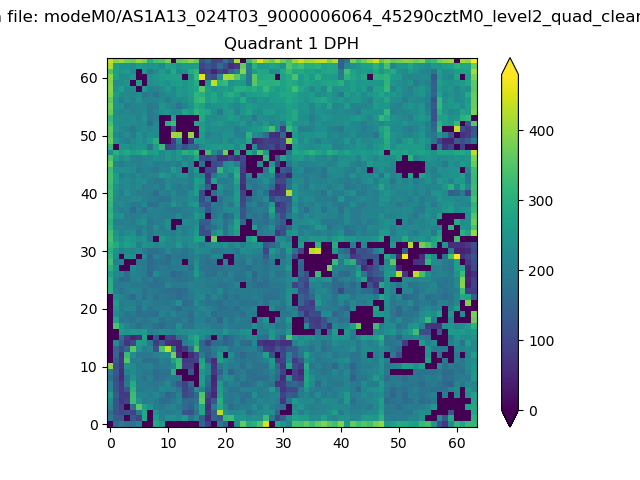 |
Quadrant B |
|---|---|---|---|
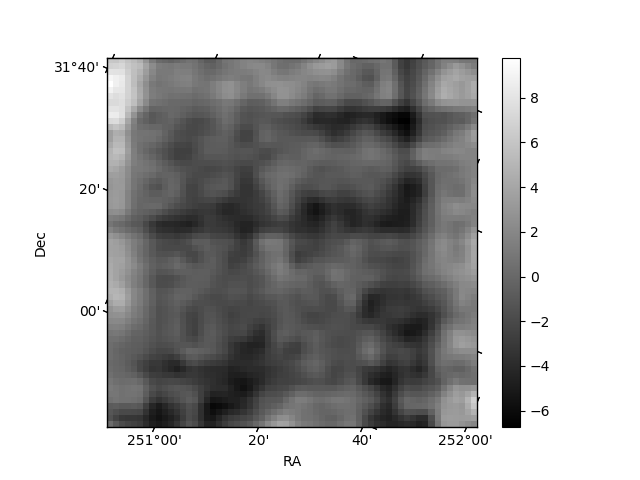
| Quadrant D | 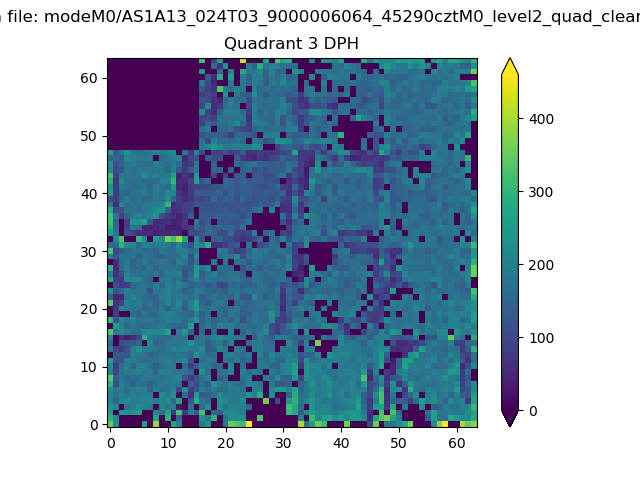 |
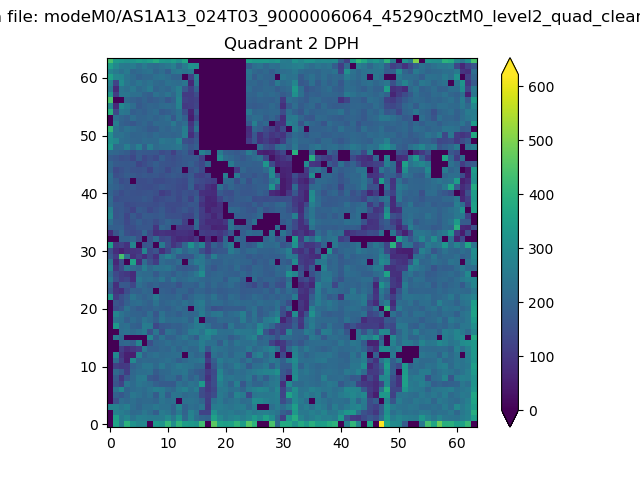 |
Quadrant C |
| Plot type | Count rate plots | Images |
|---|---|---|
| Comparison with Poisson distribution Blue bars denote a histogram of data divided into 1 sec bins. Red curve is a Poisson curve with rate = median count rate of data. |
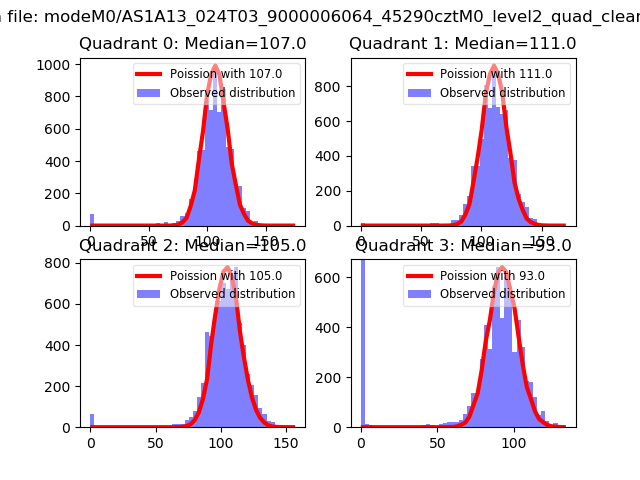 |
 |
| Quadrant-wise count rates Data is divided into 100 sec bins |
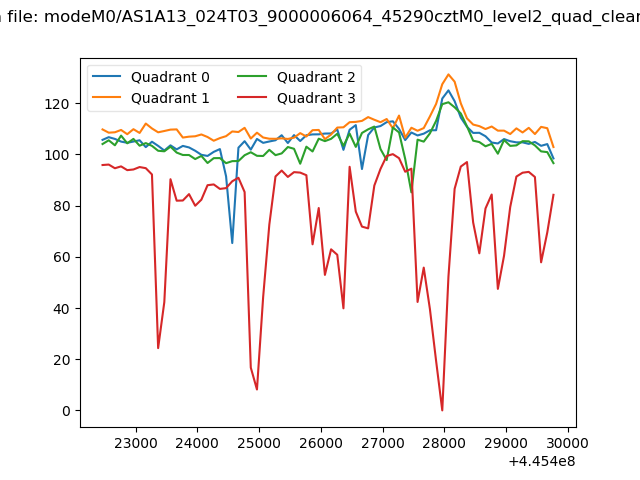 |
|
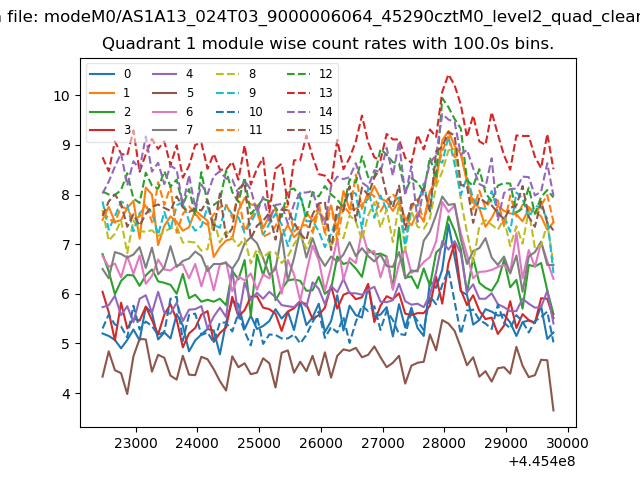
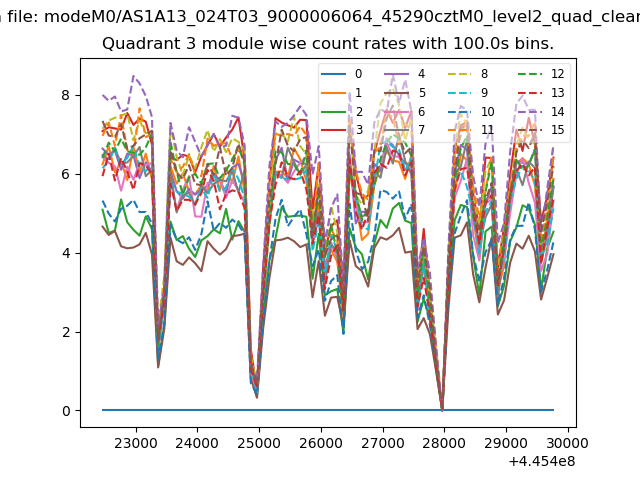
| Module-wise count rates for Quadrant A Data is divided into 100 sec bins |
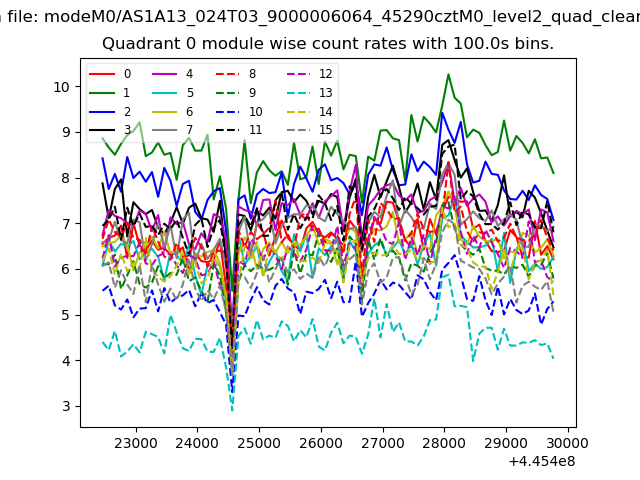 |
 |
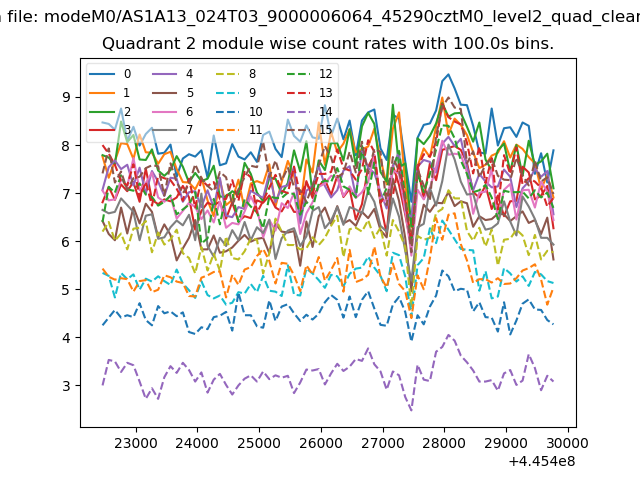
| Module-wise count rates for Quadrant B Data is divided into 100 sec bins |
 |
 |
| Module-wise count rates for Quadrant C Data is divided into 100 sec bins |
 |
 |
| Module-wise count rates for Quadrant D Data is divided into 100 sec bins |
 |
 |
| Parameter | Plot |
|---|---|
| CZT HV Monitor | 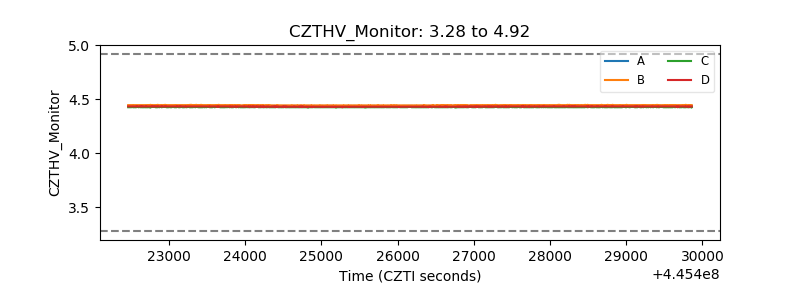 |
| D_VDD | 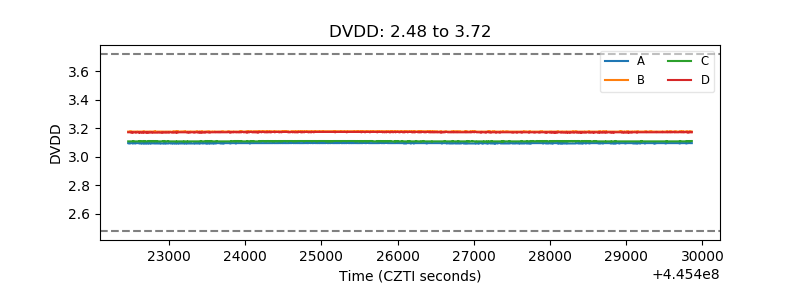 |
| Temperature 1 | 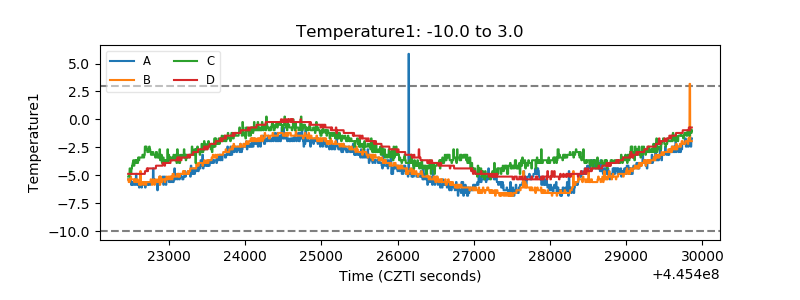 |
| Veto HV Monitor | 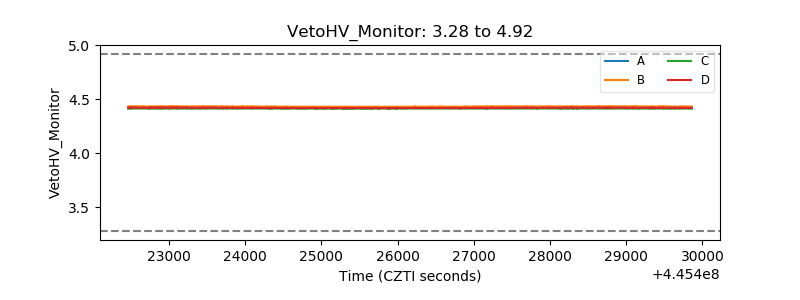 |
| Veto LLD | 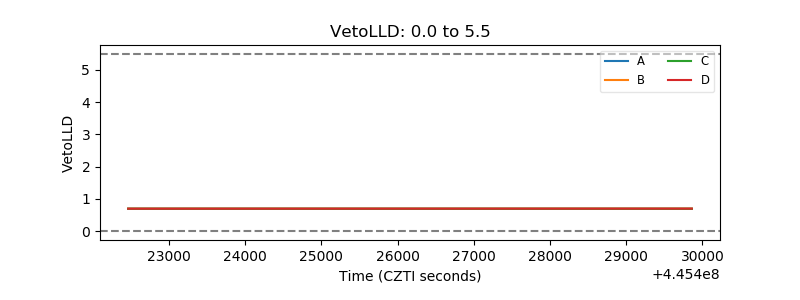 |
| Alpha Counter | 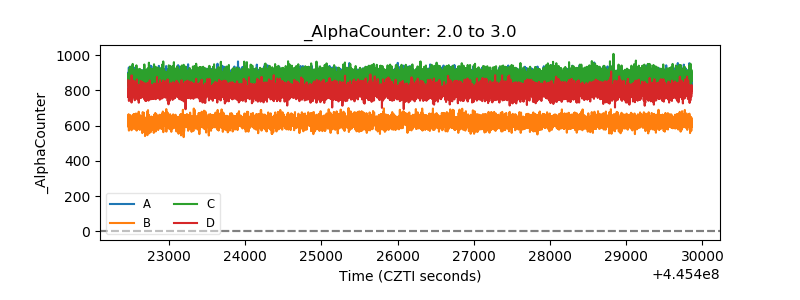 |
| _CPM_Rate | 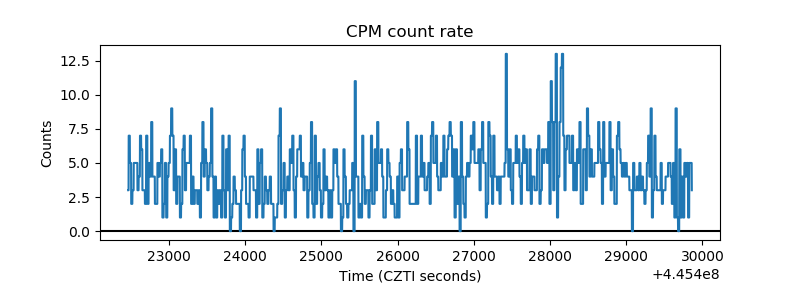 |
| CZT Counter | 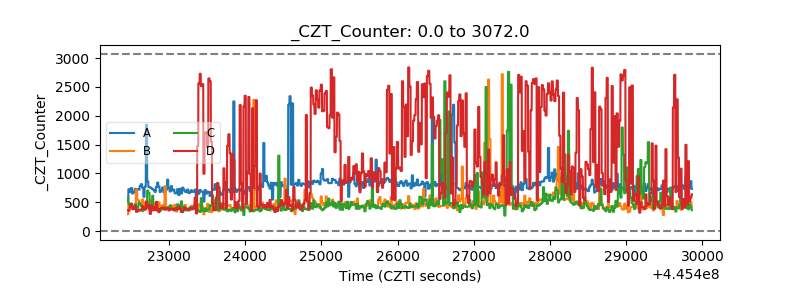 |
| +2.5 Volts monitor | 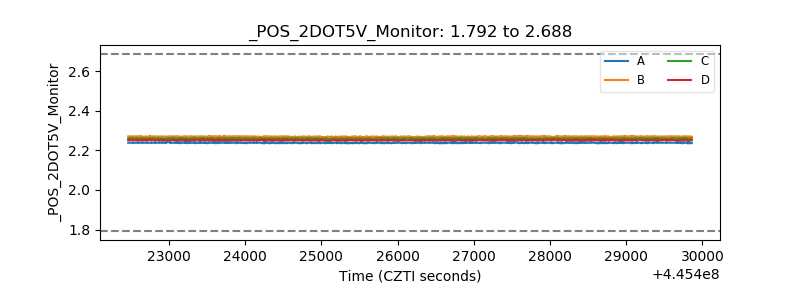 |
| +5 Volts monitor | 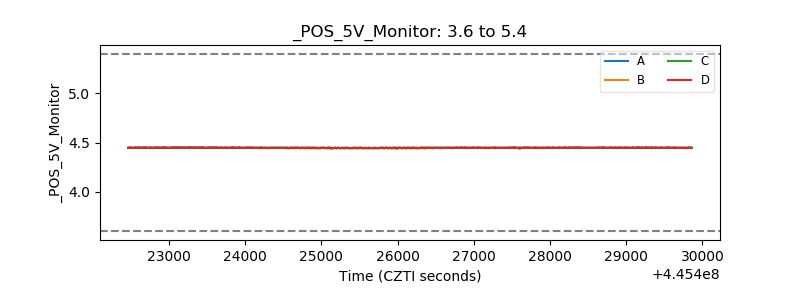 |
| _ROLL_ROT | 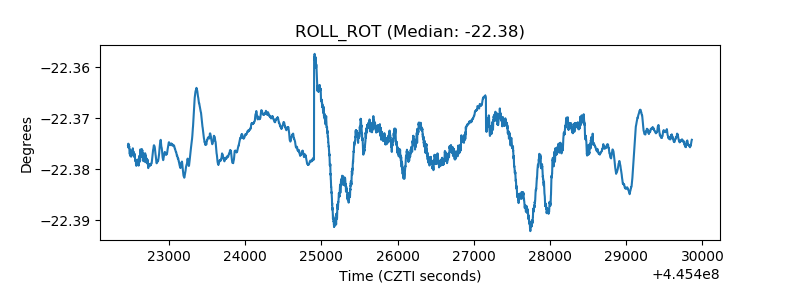 |
| _Roll_DEC | 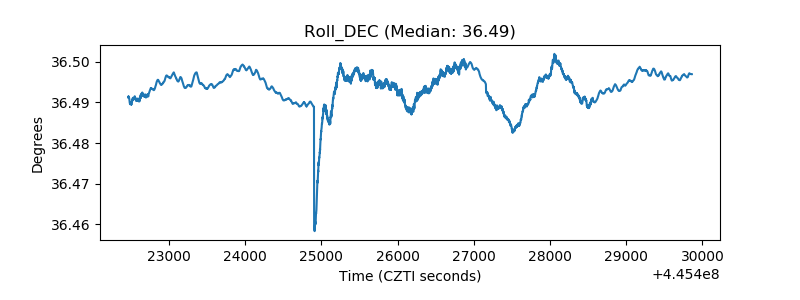 |
| _Roll_RA | 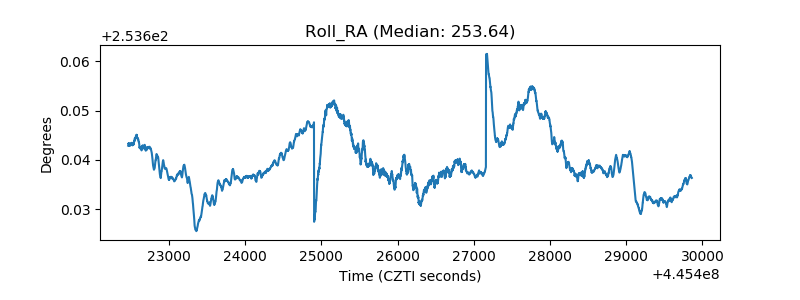 |
| Veto Counter | 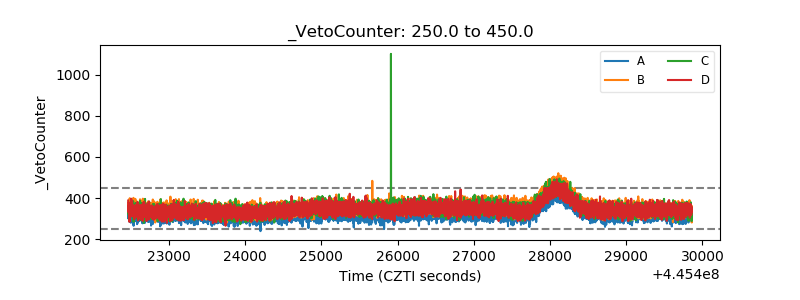 |